Volatility Term-Structure Concordance [RC Tools]
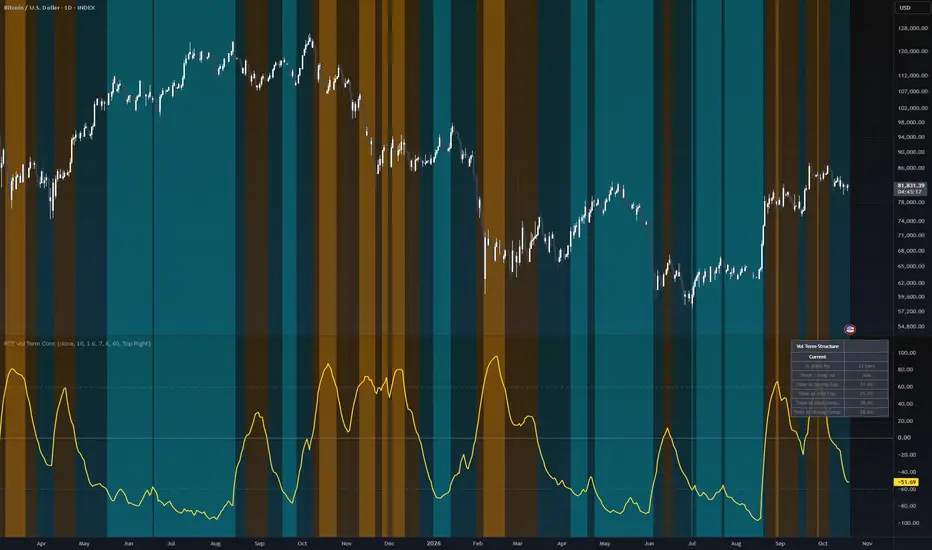
RC Tools — Volatility Term-Structure Concordance
────────────────────────────────────────────────────────────────────
█ OVERVIEW
Most volatility tools tell you how volatile the market is right now. This one asks a different question: what is the SHAPE of volatility across timeframes? When short-window volatility sits above every longer window, volatility is expanding across the board. When it sits below every longer window, volatility is compressed relative to its own longer-run history. When the windows disagree, the structure is tangled and there is no clean story.
█ WHAT IT DOES
Computes realised volatility over a ladder of increasing lookback windows (default: 5, 8, 13, 20, 33 and 52 bars), then scores how consistently those readings are ordered from short to long, on a scale of -100 to +100. Classifies the result into four bands — Strong Expansion, Mild Expansion, Mild Compression, Strong Compression — colours the chart background accordingly, and shows a table with the current band, how long it has persisted, the short-to-long volatility ratio, and how much of the loaded chart history each band has occupied.
█ THE THEORY BEHIND IT
Volatility "term structure" is a well-established idea from options markets: volatility measured over different horizons is rarely the same, and the relationship between short and long horizons carries information about the market's current state. This tool applies the same idea to REALISED volatility, using rank concordance — a public, long-established statistical measure related to Kendall's tau — to quantify how consistently the windows are ordered.
If every shorter window shows more volatility than every longer one, the ladder is fully "inverted": recent movement is outrunning the longer-run norm. If every shorter window shows less volatility than every longer one, the ladder is fully "normal": recent movement is quieter than the longer-run norm. Anything in between is a partially ordered or tangled structure. Because it is built from pairwise agreement across the whole ladder rather than one short-versus-long comparison, it is less sensitive to any single window being noisy.
This is related to, but distinct from, a percentile-ranked volatility reading (see the Regime Classifier and Percentile Context). Those ask "how high is volatility compared with its own history?" This asks "how are the different horizons ordered relative to each other right now?"
█ HOW IT IS CALCULATED
1. Compute realised volatility (standard deviation of log returns) over N windows, each longer than the last by a fixed growth factor.
2. For every pair of windows (i, j) where i is shorter than j: score +1 if vol > vol[j] (expansion-consistent), -1 if vol < vol[j] (compression-consistent), 0 if tied.
3. Sum all pair scores, normalise by the number of pairs, and scale to -100..+100.
4. Optionally EMA-smooth the raw score, which is otherwise a somewhat steppy pairwise count.
5. Classify into four bands using a configurable Strong threshold (default 60).
Score and band update ONLY on confirmed bar close, so nothing here repaints or flips mid-bar.
█ SETTINGS & CONFIGURATION
• Source (default close)
• Shortest Window (default 5 bars)
• Window Growth Factor (default 1.6) — each window is this many times longer than the previous one
• Number of Windows (3-8, default 6) — more windows read a richer structure but add warm-up and lag
• Score Smoothing Length — EMA on the raw score (set to 1 for none)
• Strong Threshold — the score above which (or below its negative) a band counts as "Strong" rather than "Mild"
• Table position, band colours, and main-chart background painting are all configurable
█ HOW TO USE IT
Use it as context, not as a signal. Strong Expansion tells you volatility is rising across every horizon you are measuring, which usually means position sizing and stop distances calibrated for a quieter market may be too tight. Strong Compression tells you volatility is low relative to its own longer-run history, which is a description of conditions rather than a prediction. Compression can last a long time. Frequent flipping between Mild bands means the structure is unsettled.
It is deliberately non-directional: it says nothing about whether price will go up or down. Pair it with whatever you already use to read direction and trend.
Works on any asset and timeframe; windows are measured in bars, so tune the ladder to how you trade.
█ LIMITATIONS
• This measures the SHAPE of realised volatility, not direction. It does not predict the direction or size of any move.
• Strong Compression describes volatility that is low relative to its own longer-run history. Compression can persist for a long time and is NOT a timing signal for an expansion.
• Realised volatility over very short windows is inherently noisy, so the shortest windows will flip ordering against longer ones more often.
• Ladder length and growth factor are a real trade-off: a longer ladder reads a richer structure but adds warm-up and lag from the longest window.
• The occupancy percentages in the table describe time spent in each state across the loaded chart history only. They vary with how much history your chart has loaded and are not a performance statistic.
• Four bands are a deliberate simplification of a continuous reality.
• Score and band update on confirmed bar close only. This script does NOT repaint.
█ DISCLAIMER
For educational and informational purposes only. Nothing here is financial advice. Past behaviour of any volatility state does not indicate future results. Trade at your own risk.
────────────────────────────────────────────────────────────────────
█ OVERVIEW
Most volatility tools tell you how volatile the market is right now. This one asks a different question: what is the SHAPE of volatility across timeframes? When short-window volatility sits above every longer window, volatility is expanding across the board. When it sits below every longer window, volatility is compressed relative to its own longer-run history. When the windows disagree, the structure is tangled and there is no clean story.
█ WHAT IT DOES
Computes realised volatility over a ladder of increasing lookback windows (default: 5, 8, 13, 20, 33 and 52 bars), then scores how consistently those readings are ordered from short to long, on a scale of -100 to +100. Classifies the result into four bands — Strong Expansion, Mild Expansion, Mild Compression, Strong Compression — colours the chart background accordingly, and shows a table with the current band, how long it has persisted, the short-to-long volatility ratio, and how much of the loaded chart history each band has occupied.
█ THE THEORY BEHIND IT
Volatility "term structure" is a well-established idea from options markets: volatility measured over different horizons is rarely the same, and the relationship between short and long horizons carries information about the market's current state. This tool applies the same idea to REALISED volatility, using rank concordance — a public, long-established statistical measure related to Kendall's tau — to quantify how consistently the windows are ordered.
If every shorter window shows more volatility than every longer one, the ladder is fully "inverted": recent movement is outrunning the longer-run norm. If every shorter window shows less volatility than every longer one, the ladder is fully "normal": recent movement is quieter than the longer-run norm. Anything in between is a partially ordered or tangled structure. Because it is built from pairwise agreement across the whole ladder rather than one short-versus-long comparison, it is less sensitive to any single window being noisy.
This is related to, but distinct from, a percentile-ranked volatility reading (see the Regime Classifier and Percentile Context). Those ask "how high is volatility compared with its own history?" This asks "how are the different horizons ordered relative to each other right now?"
█ HOW IT IS CALCULATED
1. Compute realised volatility (standard deviation of log returns) over N windows, each longer than the last by a fixed growth factor.
2. For every pair of windows (i, j) where i is shorter than j: score +1 if vol > vol[j] (expansion-consistent), -1 if vol < vol[j] (compression-consistent), 0 if tied.
3. Sum all pair scores, normalise by the number of pairs, and scale to -100..+100.
4. Optionally EMA-smooth the raw score, which is otherwise a somewhat steppy pairwise count.
5. Classify into four bands using a configurable Strong threshold (default 60).
Score and band update ONLY on confirmed bar close, so nothing here repaints or flips mid-bar.
█ SETTINGS & CONFIGURATION
• Source (default close)
• Shortest Window (default 5 bars)
• Window Growth Factor (default 1.6) — each window is this many times longer than the previous one
• Number of Windows (3-8, default 6) — more windows read a richer structure but add warm-up and lag
• Score Smoothing Length — EMA on the raw score (set to 1 for none)
• Strong Threshold — the score above which (or below its negative) a band counts as "Strong" rather than "Mild"
• Table position, band colours, and main-chart background painting are all configurable
█ HOW TO USE IT
Use it as context, not as a signal. Strong Expansion tells you volatility is rising across every horizon you are measuring, which usually means position sizing and stop distances calibrated for a quieter market may be too tight. Strong Compression tells you volatility is low relative to its own longer-run history, which is a description of conditions rather than a prediction. Compression can last a long time. Frequent flipping between Mild bands means the structure is unsettled.
It is deliberately non-directional: it says nothing about whether price will go up or down. Pair it with whatever you already use to read direction and trend.
Works on any asset and timeframe; windows are measured in bars, so tune the ladder to how you trade.
█ LIMITATIONS
• This measures the SHAPE of realised volatility, not direction. It does not predict the direction or size of any move.
• Strong Compression describes volatility that is low relative to its own longer-run history. Compression can persist for a long time and is NOT a timing signal for an expansion.
• Realised volatility over very short windows is inherently noisy, so the shortest windows will flip ordering against longer ones more often.
• Ladder length and growth factor are a real trade-off: a longer ladder reads a richer structure but adds warm-up and lag from the longest window.
• The occupancy percentages in the table describe time spent in each state across the loaded chart history only. They vary with how much history your chart has loaded and are not a performance statistic.
• Four bands are a deliberate simplification of a continuous reality.
• Score and band update on confirmed bar close only. This script does NOT repaint.
█ DISCLAIMER
For educational and informational purposes only. Nothing here is financial advice. Past behaviour of any volatility state does not indicate future results. Trade at your own risk.

Declinazione di responsabilità
Le informazioni e le pubblicazioni non sono intese come, e non costituiscono, consulenza o raccomandazioni finanziarie, di investimento, di trading o di altro tipo fornite o approvate da TradingView. Per ulteriori informazioni, consultare i Termini di utilizzo.
Declinazione di responsabilità
Le informazioni e le pubblicazioni non sono intese come, e non costituiscono, consulenza o raccomandazioni finanziarie, di investimento, di trading o di altro tipo fornite o approvate da TradingView. Per ulteriori informazioni, consultare i Termini di utilizzo.