Relative Volume
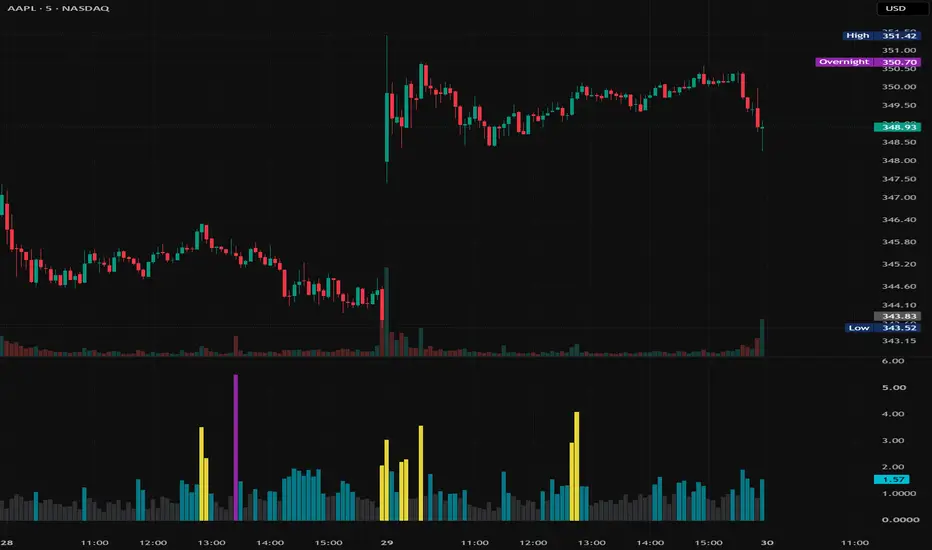
Relative Volume measures how busy the current bar is compared with the same time of day on recent days, not with the bar before it.
Volume follows a strong intraday shape: the open and the close are always heavier than midday. A plain average therefore understates a quiet open and overstates a busy close. Comparing the same clock time removes that shape from the comparison.
HOW IT WORKS
Each bar writes its volume into the slot that belongs to its own time of day. The baseline for a slot is the median of the last N samples recorded at that slot on earlier days, and RVol is this bar's volume divided by that baseline.
The median is used instead of an average so that a single past spike — news, a halt, an expiry — cannot lift the baseline of that time slot for every following day.
Daily and higher timeframes have no time of day to segment, so there the baseline is a plain rolling median of the same length.
READING THE HISTOGRAM
1.0 is the typical volume of that time slot.
Gray : below typical
Cyan : typical and above, under the high threshold
Yellow : high threshold and above (default 2.0)
Purple : extreme threshold and above (default 5.0)
SETTINGS
RVol Lookback (Days) — how many past days of the same slot are compared. Default 10, capped at 60.
High RVol Threshold / Extreme RVol Threshold — the two levels that drive the colors. They change the coloring only, not the calculation.
NOTES
A reading above 1 means more participants than usual are trading that time slot. It says nothing about direction; direction has to come from price.
The value of the forming bar moves while the bar builds, because volume is still arriving. It settles when the bar closes.
Intraday charts of 1 minute and above. Sub-minute charts draw nothing: a 1-second chart would need 86,400 time slots, which exceeds the size limit of a Pine collection.
A time slot stays blank until it has collected the full lookback of samples from earlier days, so the left edge of an intraday chart starts empty. Daily charts warm up the same way over the first N bars.
Volume is read in the symbol's own unit, so RVol is dimensionless and comparable across symbols.
Volume follows a strong intraday shape: the open and the close are always heavier than midday. A plain average therefore understates a quiet open and overstates a busy close. Comparing the same clock time removes that shape from the comparison.
HOW IT WORKS
Each bar writes its volume into the slot that belongs to its own time of day. The baseline for a slot is the median of the last N samples recorded at that slot on earlier days, and RVol is this bar's volume divided by that baseline.
The median is used instead of an average so that a single past spike — news, a halt, an expiry — cannot lift the baseline of that time slot for every following day.
Daily and higher timeframes have no time of day to segment, so there the baseline is a plain rolling median of the same length.
READING THE HISTOGRAM
1.0 is the typical volume of that time slot.
Gray : below typical
Cyan : typical and above, under the high threshold
Yellow : high threshold and above (default 2.0)
Purple : extreme threshold and above (default 5.0)
SETTINGS
RVol Lookback (Days) — how many past days of the same slot are compared. Default 10, capped at 60.
High RVol Threshold / Extreme RVol Threshold — the two levels that drive the colors. They change the coloring only, not the calculation.
NOTES
A reading above 1 means more participants than usual are trading that time slot. It says nothing about direction; direction has to come from price.
The value of the forming bar moves while the bar builds, because volume is still arriving. It settles when the bar closes.
Intraday charts of 1 minute and above. Sub-minute charts draw nothing: a 1-second chart would need 86,400 time slots, which exceeds the size limit of a Pine collection.
A time slot stays blank until it has collected the full lookback of samples from earlier days, so the left edge of an intraday chart starts empty. Daily charts warm up the same way over the first N bars.
Volume is read in the symbol's own unit, so RVol is dimensionless and comparable across symbols.

Declinazione di responsabilità
Le informazioni e le pubblicazioni non sono intese come, e non costituiscono, consulenza o raccomandazioni finanziarie, di investimento, di trading o di altro tipo fornite o approvate da TradingView. Per ulteriori informazioni, consultare i Termini di utilizzo.
Declinazione di responsabilità
Le informazioni e le pubblicazioni non sono intese come, e non costituiscono, consulenza o raccomandazioni finanziarie, di investimento, di trading o di altro tipo fornite o approvate da TradingView. Per ulteriori informazioni, consultare i Termini di utilizzo.