Futia Deviation Bands
█ OVERVIEW
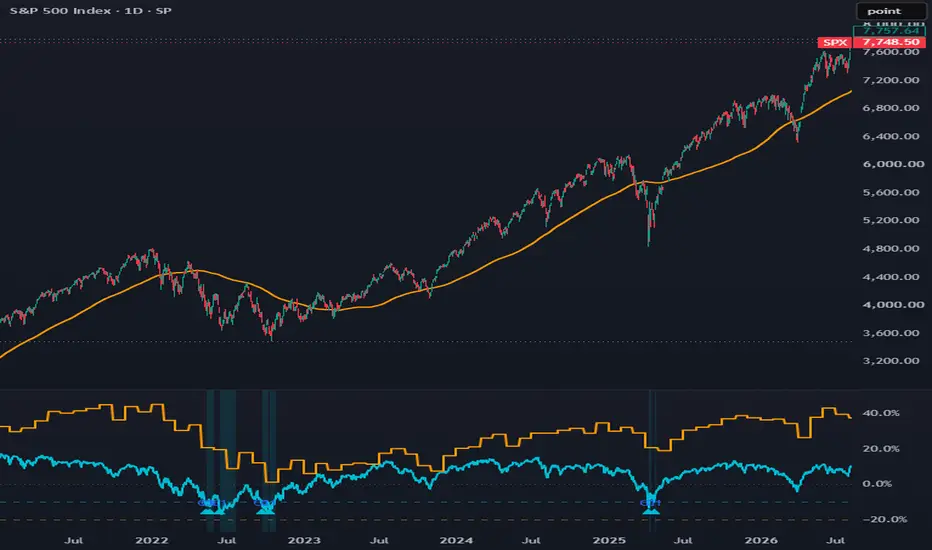
Futia Deviation Bands (200D SMA / 48M SMA) plots, in a separate pane, the percentage deviation of price from two fixed-timeframe simple moving averages: the 200-day SMA and the 48-month SMA. Both series are computed from daily and monthly data regardless of the chart timeframe. The thesis is that extreme downside stretch from these two reference trends has historically marked two distinct classes of mean-reversion conditions in broad equity indexes: a short-horizon tactical condition and a rare long-horizon undervaluation condition.
█ HISTORY / BACKGROUND
The method derives from the contrarian trading framework described by Carl Futia in the book The Art of Contrarian Trading (2009). Futia proposed the 48-month simple moving average of a broad stock index as a rough proxy for long-term fair value, and used deviations from the 200-day moving average as a tactical gauge of bearish sentiment extremes. In his framework these price conditions are meant to be combined with a discretionary assessment of crowd psychology; this indicator implements only the mechanical price conditions.
The conceptual basis is mean reversion around trend. A close far below the one-year trend (200-day SMA) reflects a compressed, fear-driven market state that has tended to resolve over weeks to months. A close far below the four-year trend (48-month SMA) is a much rarer state, historically clustered into a small number of major bear market episodes, and reflects deep departure from long-run value rather than short-term sentiment.
█ HOW IT WORKS
The script performs the following computations on every chart bar:
█ HOW TO USE
The indicator loads in its own pane below the chart. The aqua line is the deviation from the 200-day SMA; the orange line is the deviation from the 48-month SMA. A dotted gray line marks zero deviation, and dashed horizontal lines mark the two thresholds.
Because both series are pinned to daily and monthly resolutions through higher-timeframe requests, the indicator can be applied to any chart timeframe and will display the same deviation values. On intraday charts each bar shows the most recent completed daily and monthly readings when the confirmed-bars input is on. A daily chart is the natural resolution for routine monitoring, since Condition 1 is defined on daily closes.
Interpretation follows the two-condition design. Condition 1 identifies short-horizon stretch below the one-year trend; in the historical record of the S&P 500 from 1950 to 2018 it occurred roughly 21 distinct times, and it says nothing about whether a bear market has ended. Deep bear markets have triggered it repeatedly on the way to lower lows. Condition 2 identifies deep departure from the four-year trend; in the same record it was active in only a few dozen monthly observations, clustered into a small number of major bear market episodes. The red combined state corresponds to the deepest of those episodes. The indicator is a conditioning and context tool, not a complete trading system, and its author intended such conditions to modulate exposure around a baseline allocation rather than to switch fully in and out of a market.
█ SETTINGS
█ WHAT MAKES IT ORIGINAL
The script combines two deviation measures from different fixed timeframes in a single pane and keeps both pinned to their native resolutions independently of the chart timeframe. Most deviation or distance-from-average tools compute on the chart resolution, which changes the meaning of the reading whenever the user changes timeframes. Here the 200-day and 48-month references are structural: they always mean one year of trading days and four years of months. The pairing is also specific: one fast sentiment-stretch measure and one slow value-stretch measure, with a distinct visual state for their intersection, which historically has been the signature of the deepest bear market conditions. The threshold logic, the non-repainting toggle, and the onset markers implement the mechanical portion of a published discretionary framework in reproducible form.
█ NOTES / LIMITATIONS
Futia Deviation Bands (200D SMA / 48M SMA) plots, in a separate pane, the percentage deviation of price from two fixed-timeframe simple moving averages: the 200-day SMA and the 48-month SMA. Both series are computed from daily and monthly data regardless of the chart timeframe. The thesis is that extreme downside stretch from these two reference trends has historically marked two distinct classes of mean-reversion conditions in broad equity indexes: a short-horizon tactical condition and a rare long-horizon undervaluation condition.
█ HISTORY / BACKGROUND
The method derives from the contrarian trading framework described by Carl Futia in the book The Art of Contrarian Trading (2009). Futia proposed the 48-month simple moving average of a broad stock index as a rough proxy for long-term fair value, and used deviations from the 200-day moving average as a tactical gauge of bearish sentiment extremes. In his framework these price conditions are meant to be combined with a discretionary assessment of crowd psychology; this indicator implements only the mechanical price conditions.
The conceptual basis is mean reversion around trend. A close far below the one-year trend (200-day SMA) reflects a compressed, fear-driven market state that has tended to resolve over weeks to months. A close far below the four-year trend (48-month SMA) is a much rarer state, historically clustered into a small number of major bear market episodes, and reflects deep departure from long-run value rather than short-term sentiment.
█ HOW IT WORKS
The script performs the following computations on every chart bar:
- It requests daily data for the chart symbol and computes 100 * (close / SMA(close, 200) - 1), the percentage deviation of the daily close from the 200-day SMA.
- It requests monthly data for the chart symbol and computes 100 * (close / SMA(close, 48) - 1), the percentage deviation of the monthly close from the 48-month SMA.
- When the confirmed-bars input is enabled, both requests return the value of the previously completed daily or monthly bar, using the standard non-repainting higher-timeframe pattern (offset by one bar with lookahead on). When disabled, the requests return the developing value of the current daily or monthly bar with lookahead off.
- Condition 1 is true when the daily deviation is at or below the Condition 1 threshold (default -10 percent).
- Condition 2 is true when the monthly deviation is at or below the Condition 2 threshold (default -20 percent).
- The pane background is shaded aqua when only Condition 1 is active, orange when only Condition 2 is active, and red when both are active.
- A small triangle marker labeled C1 or C2 is drawn at the bottom of the pane on the first bar where each condition becomes true after being false.
- Three alert conditions are provided: Condition 1 onset, Condition 2 onset, and both conditions active.
█ HOW TO USE
The indicator loads in its own pane below the chart. The aqua line is the deviation from the 200-day SMA; the orange line is the deviation from the 48-month SMA. A dotted gray line marks zero deviation, and dashed horizontal lines mark the two thresholds.
Because both series are pinned to daily and monthly resolutions through higher-timeframe requests, the indicator can be applied to any chart timeframe and will display the same deviation values. On intraday charts each bar shows the most recent completed daily and monthly readings when the confirmed-bars input is on. A daily chart is the natural resolution for routine monitoring, since Condition 1 is defined on daily closes.
Interpretation follows the two-condition design. Condition 1 identifies short-horizon stretch below the one-year trend; in the historical record of the S&P 500 from 1950 to 2018 it occurred roughly 21 distinct times, and it says nothing about whether a bear market has ended. Deep bear markets have triggered it repeatedly on the way to lower lows. Condition 2 identifies deep departure from the four-year trend; in the same record it was active in only a few dozen monthly observations, clustered into a small number of major bear market episodes. The red combined state corresponds to the deepest of those episodes. The indicator is a conditioning and context tool, not a complete trading system, and its author intended such conditions to modulate exposure around a baseline allocation rather than to switch fully in and out of a market.
█ SETTINGS
- Condition 1: % below 200-day SMA. The deviation threshold at or below which Condition 1 is active. Default -10.
- Condition 2: % below 48-month SMA. The deviation threshold at or below which Condition 2 is active. Default -20.
- Use confirmed HTF bars (no repaint). When on, both deviations update only when the underlying daily or monthly bar closes, so signals do not change intrabar. When off, the current developing daily and monthly values are used and can change until those bars close. Default on.
█ WHAT MAKES IT ORIGINAL
The script combines two deviation measures from different fixed timeframes in a single pane and keeps both pinned to their native resolutions independently of the chart timeframe. Most deviation or distance-from-average tools compute on the chart resolution, which changes the meaning of the reading whenever the user changes timeframes. Here the 200-day and 48-month references are structural: they always mean one year of trading days and four years of months. The pairing is also specific: one fast sentiment-stretch measure and one slow value-stretch measure, with a distinct visual state for their intersection, which historically has been the signature of the deepest bear market conditions. The threshold logic, the non-repainting toggle, and the onset markers implement the mechanical portion of a published discretionary framework in reproducible form.
█ NOTES / LIMITATIONS
- The 48-month SMA requires at least 48 completed monthly bars, and the 200-day SMA requires at least 200 completed daily bars. On symbols with shorter history the corresponding line returns na and does not render.
- The thresholds were studied on a broad large-cap equity index (S&P 500 daily history, 1950 to 2018). On individual stocks, volatile sector indexes, or other asset classes, deviations of these magnitudes occur at very different frequencies and the default thresholds are not calibrated for them.
- With the confirmed-bars input off, the current daily and monthly deviation values update intrabar and a condition can appear and disappear before the underlying bar closes. With it on, values lag by one completed daily or monthly bar.
- Higher-timeframe values are obtained with request.security. On chart timeframes above daily or monthly, each chart bar displays the last completed reading available within that bar.
- Condition 2 changes state only on monthly closes, so it is inherently slow and infrequent by construction.
- The indicator generates context conditions, not trade signals with defined exits, position sizing, or risk management.

Declinazione di responsabilità
Le informazioni e le pubblicazioni non sono intese come, e non costituiscono, consulenza o raccomandazioni finanziarie, di investimento, di trading o di altro tipo fornite o approvate da TradingView. Per ulteriori informazioni, consultare i Termini di utilizzo.
Declinazione di responsabilità
Le informazioni e le pubblicazioni non sono intese come, e non costituiscono, consulenza o raccomandazioni finanziarie, di investimento, di trading o di altro tipo fornite o approvate da TradingView. Per ulteriori informazioni, consultare i Termini di utilizzo.