OPEN-SOURCE SCRIPT
Quadruple EMA with Support and Resistance
# EMA Trend + Support & Resistance Strategy
## Overview
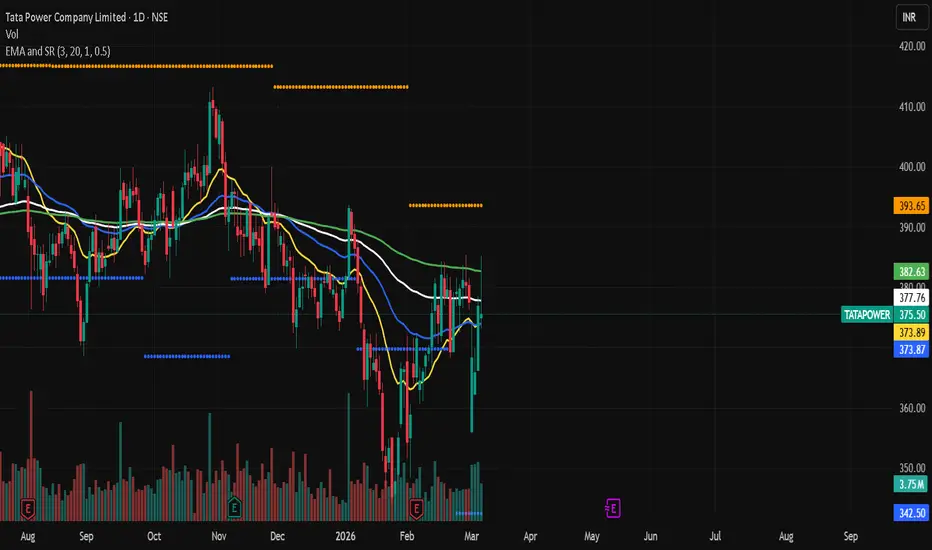
A clean, rule-based trading strategy designed for the **Daily timeframe**. It uses four Exponential Moving Averages (EMA 20, 50, 100, 200) as a trend filter combined with dynamic Support & Resistance levels to identify high-probability breakout and breakdown setups.
The logic is intentionally simple — no indicators stacked on indicators, no complex filters. Just price, trend direction, and key levels.
---
## How It Works
### Entry — Long (CE / Buy)
A long entry is triggered when:
- Price closes **above all four EMAs** (20, 50, 100, 200) — confirming strong bullish trend alignment
- Price **breaks above the previous bar's high** — confirming momentum and breakout
### Entry — Short (PE / Sell)
A short entry is triggered when:
- Price closes **below all four EMAs** (20, 50, 100, 200) — confirming strong bearish trend alignment
- Price **breaks below the previous bar's low** — confirming momentum and breakdown
### Exit Logic
- **Stop Loss** — set at the previous bar's low (for longs) or previous bar's high (for shorts)
- **Target** — calculated using the configurable Risk:Reward Ratio (default 3:1)
- **EMA-based dynamic exit** — if price closes below EMA 20 or EMA 50 (for longs), or above EMA 20 or EMA 50 (for shorts), the stop is tightened to force an exit on the next bar, protecting open profit
- **Optional Trailing Stop Loss** — activates after a defined profit % is reached, then trails at a set % distance from the peak
---
## Indicators on Chart
| Line | Color | Meaning |
|------|-------|---------|
| EMA 20 | Yellow | Fast trend / momentum |
| EMA 50 | Blue | Mid-term trend |
| EMA 100 | White | Medium-long trend support |
| EMA 200 | Green | Long-term trend direction |
| Resistance | Orange dots | Swing high levels |
| Support | Blue dots | Swing low levels |
| ▲ Green arrow | Below bar | Long (CE) entry signal |
| ▼ Red arrow | Above bar | Short (PE) entry signal |
---
## Settings
| Input | Default | Description |
|-------|---------|-------------|
| Risk Reward Ratio | 3.0 | Target = Entry + (RR × Risk) |
| Show Support/Resistance | On | Toggle S/R level plots |
| Swing Detection Bars | 20 | Lookback bars for pivot detection |
| One Trade Per Day | On | Limits to one CE and one PE per day |
| Use Trailing Stop Loss | Off | Enable trailing SL after activation |
| Trailing Activation % | 1.0% | Profit % before trailing SL kicks in |
| Trailing Distance % | 0.5% | Distance the trailing SL follows from peak |
---
## Best Used On
- **Timeframe:** Daily (recommended), Weekly
- **Instruments:** Stocks, Indices, ETFs
- Works well on trending instruments where EMA stacking is meaningful
---
## Notes
- This strategy does **not** use candle body filters, volume filters, or session time windows — keeping it universally applicable across timeframes and instruments
- One trade per direction per day is enforced by default to avoid overtrading
- Both CE (long) and PE (short) trades cannot be open simultaneously
---
⚠️ **Disclaimer:** This strategy is for educational and backtesting purposes only. Past performance does not guarantee future results. This is not financial advice. Always do your own research and consult a qualified financial advisor before making any trading decisions.
## Overview
A clean, rule-based trading strategy designed for the **Daily timeframe**. It uses four Exponential Moving Averages (EMA 20, 50, 100, 200) as a trend filter combined with dynamic Support & Resistance levels to identify high-probability breakout and breakdown setups.
The logic is intentionally simple — no indicators stacked on indicators, no complex filters. Just price, trend direction, and key levels.
---
## How It Works
### Entry — Long (CE / Buy)
A long entry is triggered when:
- Price closes **above all four EMAs** (20, 50, 100, 200) — confirming strong bullish trend alignment
- Price **breaks above the previous bar's high** — confirming momentum and breakout
### Entry — Short (PE / Sell)
A short entry is triggered when:
- Price closes **below all four EMAs** (20, 50, 100, 200) — confirming strong bearish trend alignment
- Price **breaks below the previous bar's low** — confirming momentum and breakdown
### Exit Logic
- **Stop Loss** — set at the previous bar's low (for longs) or previous bar's high (for shorts)
- **Target** — calculated using the configurable Risk:Reward Ratio (default 3:1)
- **EMA-based dynamic exit** — if price closes below EMA 20 or EMA 50 (for longs), or above EMA 20 or EMA 50 (for shorts), the stop is tightened to force an exit on the next bar, protecting open profit
- **Optional Trailing Stop Loss** — activates after a defined profit % is reached, then trails at a set % distance from the peak
---
## Indicators on Chart
| Line | Color | Meaning |
|------|-------|---------|
| EMA 20 | Yellow | Fast trend / momentum |
| EMA 50 | Blue | Mid-term trend |
| EMA 100 | White | Medium-long trend support |
| EMA 200 | Green | Long-term trend direction |
| Resistance | Orange dots | Swing high levels |
| Support | Blue dots | Swing low levels |
| ▲ Green arrow | Below bar | Long (CE) entry signal |
| ▼ Red arrow | Above bar | Short (PE) entry signal |
---
## Settings
| Input | Default | Description |
|-------|---------|-------------|
| Risk Reward Ratio | 3.0 | Target = Entry + (RR × Risk) |
| Show Support/Resistance | On | Toggle S/R level plots |
| Swing Detection Bars | 20 | Lookback bars for pivot detection |
| One Trade Per Day | On | Limits to one CE and one PE per day |
| Use Trailing Stop Loss | Off | Enable trailing SL after activation |
| Trailing Activation % | 1.0% | Profit % before trailing SL kicks in |
| Trailing Distance % | 0.5% | Distance the trailing SL follows from peak |
---
## Best Used On
- **Timeframe:** Daily (recommended), Weekly
- **Instruments:** Stocks, Indices, ETFs
- Works well on trending instruments where EMA stacking is meaningful
---
## Notes
- This strategy does **not** use candle body filters, volume filters, or session time windows — keeping it universally applicable across timeframes and instruments
- One trade per direction per day is enforced by default to avoid overtrading
- Both CE (long) and PE (short) trades cannot be open simultaneously
---
⚠️ **Disclaimer:** This strategy is for educational and backtesting purposes only. Past performance does not guarantee future results. This is not financial advice. Always do your own research and consult a qualified financial advisor before making any trading decisions.
Script open-source
Nello spirito di TradingView, l'autore di questo script lo ha reso open source, in modo che i trader possano esaminarne e verificarne la funzionalità. Complimenti all'autore! Sebbene sia possibile utilizzarlo gratuitamente, ricordiamo che la ripubblicazione del codice è soggetta al nostro Regolamento.

Declinazione di responsabilità
Le informazioni e le pubblicazioni non sono intese come, e non costituiscono, consulenza o raccomandazioni finanziarie, di investimento, di trading o di altro tipo fornite o approvate da TradingView. Per ulteriori informazioni, consultare i Termini di utilizzo.
Script open-source
Nello spirito di TradingView, l'autore di questo script lo ha reso open source, in modo che i trader possano esaminarne e verificarne la funzionalità. Complimenti all'autore! Sebbene sia possibile utilizzarlo gratuitamente, ricordiamo che la ripubblicazione del codice è soggetta al nostro Regolamento.
Declinazione di responsabilità
Le informazioni e le pubblicazioni non sono intese come, e non costituiscono, consulenza o raccomandazioni finanziarie, di investimento, di trading o di altro tipo fornite o approvate da TradingView. Per ulteriori informazioni, consultare i Termini di utilizzo.