Aggiornato
Obvious Trend v3.2
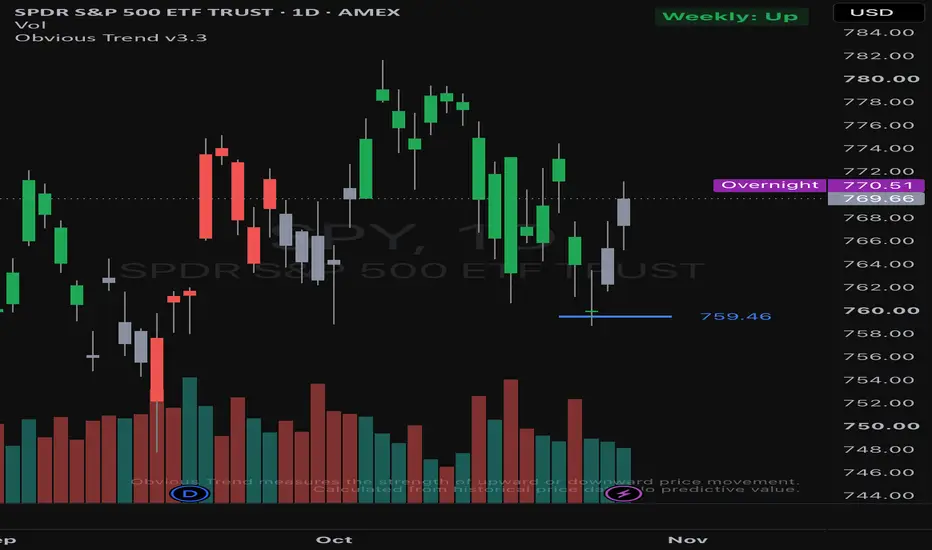
Obvious Trend colors every candle by the strength of the move: green when price is moving up, red when it is moving down, grey when the two measures behind it disagree. One blue line marks a trailing reference level. It measures the strength of upward or downward price movement and nothing more. It has no predictive value.
How it works
Two tools vote on direction: a fast (10) and a slow (30) simple moving average, and the Parabolic SAR (0.005 / 0.005 / 0.05). The candle is green when both point up, red when both point down, and grey when they disagree. Grey means the strength is weakening or has not yet built up. It does not mean the trend has changed. A third tool, an ATR trailing stop (22-bar high or low, less or plus 3 x ATR of 10 bars), draws the blue line. It has no vote and never changes the color.
Why combine them
The averages react slowly to a turn and the SAR reacts quickly. Showing a direction only when both agree displays a disagreement as grey instead of as a flip of color.
Use
Add it to any chart and time frame. It works on the chart's own bars. Alerts are available for Up, Neutral and Down. Colors, lengths and SAR settings can be changed.
Limits
The current bar can change until it closes. Like all trend tools it lags turns and can change often in choppy markets. The blue line is a calculated level, not protection. Colors describe past price behaviour only. Our own historical tests found no proven predictive value, so none is claimed. Information only, not advice.
Credits
Parabolic SAR and ATR: J. Welles Wilder Jr. (1978). Trailing stop idea: Chuck LeBeau, popularised by Alexander Elder. Moving averages: public methods. Pine Script and built-in functions: TradingView. The people named are credited for their methods only.
How it works
Two tools vote on direction: a fast (10) and a slow (30) simple moving average, and the Parabolic SAR (0.005 / 0.005 / 0.05). The candle is green when both point up, red when both point down, and grey when they disagree. Grey means the strength is weakening or has not yet built up. It does not mean the trend has changed. A third tool, an ATR trailing stop (22-bar high or low, less or plus 3 x ATR of 10 bars), draws the blue line. It has no vote and never changes the color.
Why combine them
The averages react slowly to a turn and the SAR reacts quickly. Showing a direction only when both agree displays a disagreement as grey instead of as a flip of color.
Use
Add it to any chart and time frame. It works on the chart's own bars. Alerts are available for Up, Neutral and Down. Colors, lengths and SAR settings can be changed.
Limits
The current bar can change until it closes. Like all trend tools it lags turns and can change often in choppy markets. The blue line is a calculated level, not protection. Colors describe past price behaviour only. Our own historical tests found no proven predictive value, so none is claimed. Information only, not advice.
Credits
Parabolic SAR and ATR: J. Welles Wilder Jr. (1978). Trailing stop idea: Chuck LeBeau, popularised by Alexander Elder. Moving averages: public methods. Pine Script and built-in functions: TradingView. The people named are credited for their methods only.
Note di rilascio
v3.3New
- Higher time frame table (top right). A small table shows the reading on the next time frame up, for example "Weekly: Up" on a daily chart. It uses the same rule as the candle colours and is for information only.
- The time frame is chosen automatically (under 1 hour: 1-hour; 1 to under 4 hours: 4-hour; other intraday: Daily; Daily: Weekly; Weekly: Monthly). You can choose one yourself, switch the table off, or use the still-forming bar instead of the last completed bar.
Changed
- The on-chart note now reads: "Obvious Trend measures the strength of upward or downward price movement. Calculated from historical price data. No predictive value."
- The documentation in the code header describes the new table, and lists request.security in the credits.
Unchanged
- The candle colours, the trailing stop line, the settings and the alerts are calculated exactly as in v3.2.

Declinazione di responsabilità
Le informazioni e le pubblicazioni non sono intese come, e non costituiscono, consulenza o raccomandazioni finanziarie, di investimento, di trading o di altro tipo fornite o approvate da TradingView. Per ulteriori informazioni, consultare i Termini di utilizzo.
Declinazione di responsabilità
Le informazioni e le pubblicazioni non sono intese come, e non costituiscono, consulenza o raccomandazioni finanziarie, di investimento, di trading o di altro tipo fornite o approvate da TradingView. Per ulteriori informazioni, consultare i Termini di utilizzo.