Daily maximum price range for Credit Spreads
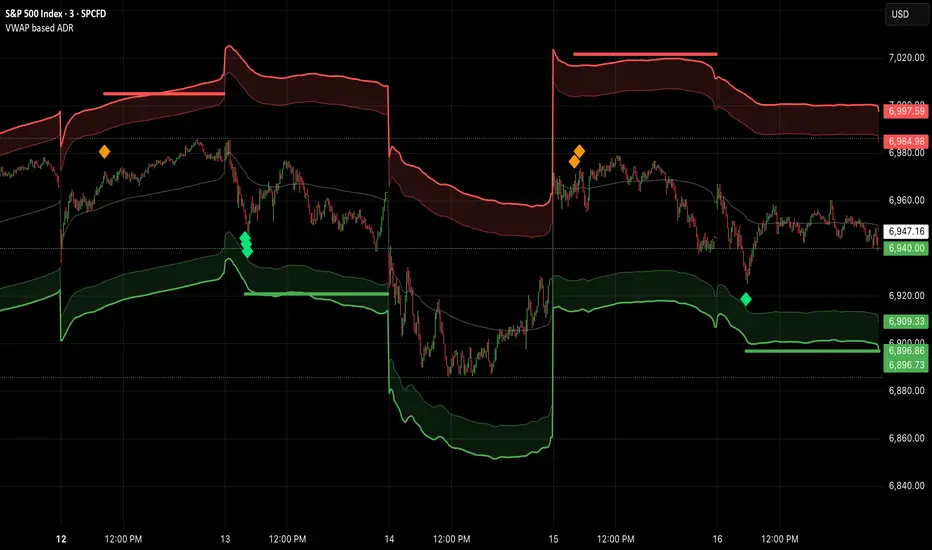
Volatility & Momentum for Credit Spreads
It is a specialized mean-reversion tool designed primarily for options traders focusing on Credit Spreads (specifically 0DTE on SPX) and intraday reversals. By combining Volume Weighted Average Price (VWAP) with VIX-adjusted volatility bands, this indicator identifies statistical extremes where price is likely to revert.
Unlike standard Bollinger Bands or Keltner Channels, TITAN adapts its width based on real-time implied volatility (VIX), ensuring that your "overextended" zones are accurate whether the market is calm or chaotic.
🎯 Core Concept
The indicator relies on the principle that price moves within a definable "Daily Range" relative to the VWAP. When price pushes to the outer limits of this range while simultaneously hitting RSI extremes; it signals a high-probability reversal setup ideal for selling premium.
🛠 How It Works
The engine is built on three pillars:
🚀 Key Features
📉 How to Trade It (Example Strategy)
⚙️ Settings
⚠️ Disclaimer
This tool is for informational purposes only. Trading options, especially 0DTE credit spreads, involves significant risk. Always backtest strategies and manage risk accordingly.
It is a specialized mean-reversion tool designed primarily for options traders focusing on Credit Spreads (specifically 0DTE on SPX) and intraday reversals. By combining Volume Weighted Average Price (VWAP) with VIX-adjusted volatility bands, this indicator identifies statistical extremes where price is likely to revert.
Unlike standard Bollinger Bands or Keltner Channels, TITAN adapts its width based on real-time implied volatility (VIX), ensuring that your "overextended" zones are accurate whether the market is calm or chaotic.
🎯 Core Concept
The indicator relies on the principle that price moves within a definable "Daily Range" relative to the VWAP. When price pushes to the outer limits of this range while simultaneously hitting RSI extremes; it signals a high-probability reversal setup ideal for selling premium.
🛠 How It Works
The engine is built on three pillars:
- Volatility-Adaptive Bands: The bands are calculated using a 14-day Average Daily Range (ADR), which is then dynamically scaled by the current VIX relative to a baseline. If VIX spikes, the bands widen instantly to keep you safe from premature entries.
- Momentum Triggers: Signals are generated only when the RSI (14) hits extreme Overbought (>70) or Oversold (<30) levels.
- "Golden Hour" Filtering: To avoid market open noise or late-day chop, the indicator includes a customizable time filter (Default: 10:15 – 11:30 AM EST). Signals outside this window are suppressed to enforce trading discipline.
🚀 Key Features
- Visual Strategy Simulation: The indicator now includes a built-in "Strike Simulator." Upon the first valid signal of the session, it automatically plots a horizontal "Strike Line" at the Outer Band ± a user-defined buffer (e.g., 10 points). This helps you visualize your theoretical strike price for the rest of the day.
- Bull & Bear Zones: Color-coded fills (Green for Bullish Buy Zones, Red for Bearish Sell Zones) make it easy to see market context at a glance.
- Live Dashboard: A Heads-Up Display (HUD) in the bottom right shows real-time RSI values, Golden Hour status, and current signal state.
- Unified Alert System: A single master alert condition triggers if price hits an RSI extreme OR touches a volatility band during your active trading window.
📉 How to Trade It (Example Strategy)
- Wait for the Window: Ensure the "Golden Hour" on the dashboard reads ACTIVE (Default 10:15 AM EST).
- Identify the Zone: Short Setup (Call Credit Spread): Price pushes into the Red Zone (Outer High). Long Setup (Put Credit Spread): Price pushes into the Green Zone (Outer Low).
- Confirm the Signal: Look for the Diamond Icon. This confirms RSI has hit the extreme threshold.
- Check the "Strike Line": Use the simulated horizontal line to identify where your short strike would be (Outer Band + Buffer) to verify it is at a safe distance from current price.
⚙️ Settings
- ADR Length: Lookback period for daily range calculation (Default: 10).
- Baseline VIX:* The standard VIX level used for normalization (Default: 15.0).
- Inner/Outer Multipliers: Controls the width of the bands.
- Golden Hour: The specific time window for valid signals.
- Strike Buffer: Points added to the outer band to simulate your option strike price.
⚠️ Disclaimer
This tool is for informational purposes only. Trading options, especially 0DTE credit spreads, involves significant risk. Always backtest strategies and manage risk accordingly.

Declinazione di responsabilità
Le informazioni e le pubblicazioni non sono intese come, e non costituiscono, consulenza o raccomandazioni finanziarie, di investimento, di trading o di altro tipo fornite o approvate da TradingView. Per ulteriori informazioni, consultare i Termini di utilizzo.
Declinazione di responsabilità
Le informazioni e le pubblicazioni non sono intese come, e non costituiscono, consulenza o raccomandazioni finanziarie, di investimento, di trading o di altro tipo fornite o approvate da TradingView. Per ulteriori informazioni, consultare i Termini di utilizzo.