Risk & Position Planner [Indicatr]
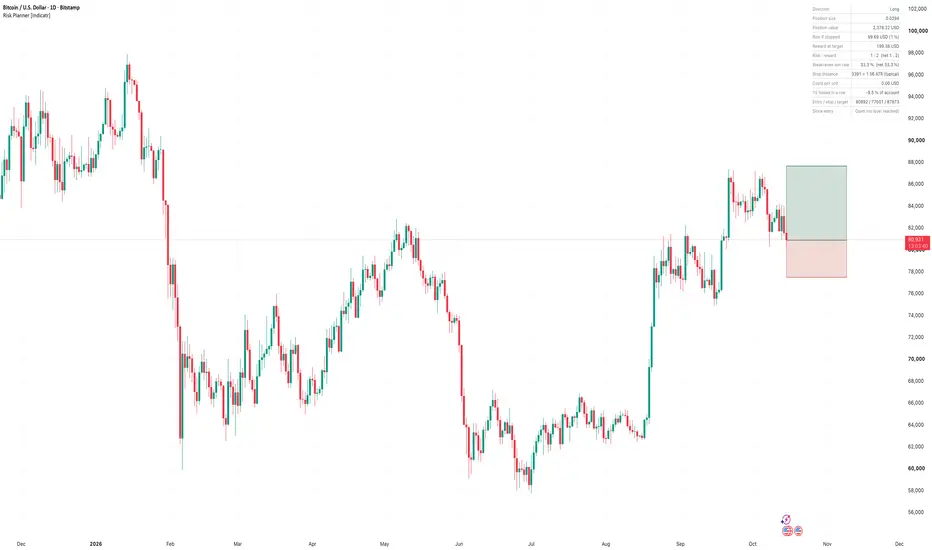
Risk & Position Planner turns a trade idea into numbers before you enter: position size for a fixed risk, risk : reward before and after costs, the win rate you need to break even, how wide your stop is compared to normal volatility, and what a losing streak would do to your account - for long and short.
WHAT IT DOES
Most traders know their entry and stop, but not their position size, their real risk after costs or how many trades they could lose in a row. This tool shows all of it in one table and draws the trade as risk and reward zones on the chart.
HOW IT WORKS
HOW TO USE
THE CHART
BTCUSD daily. Long planned at the last close with a stop 1.56 ATR below and the target at 2R. Account 10,000, risk 1 percent, no costs entered. The table shows position size 0.0294 BTC, risk 99.69 USD, risk : reward 1 : 2, break-even win rate 33.3 percent and a 10-trade losing streak of about -9.5 percent.
WHAT IS ORIGINAL
Position size calculators already exist. This one combines sizing with three checks that are usually missing: the cost-adjusted break-even win rate, the stop distance measured in ATR with a noise warning, and a compounded losing-streak preview. It also tracks whether stop or target was reached first after the entry.
LIMITATIONS
Disclaimer
For educational and analytical purposes only. Not financial advice. Marks and signals are not buy or sell recommendations. Past behaviour does not guarantee future results.
WHAT IT DOES
Most traders know their entry and stop, but not their position size, their real risk after costs or how many trades they could lose in a row. This tool shows all of it in one table and draws the trade as risk and reward zones on the chart.
HOW IT WORKS
- Set the trade: when the script is added, click the entry point, the stop and the target on the chart. Direction is detected automatically (stop below entry = long, stop above entry = short). The target can also be set as an R multiple.
- Position size: risk amount (percent of account or a fixed amount) divided by the risk per unit. Risk per unit = stop distance x point value of the symbol + round-trip costs per unit. The size is rounded down to the size step (auto: 0.0001 for crypto, 1 for everything else), so the real risk never exceeds your limit.
- Costs: commission per side in percent and spread/slippage in ticks are included. The table shows risk : reward and the break-even win rate both gross and net of costs.
- Break-even win rate = 1 / (1 + R). At 1 : 2 you need just over 33 percent winners before costs.
- Stop check: the stop distance is expressed in ATR. Below 1 ATR the stop sits inside normal noise and is flagged; 1 to 3 ATR is typical; above 3 ATR is wide.
- Loss streak preview: shows how much of the account a series of losses at this risk would cost (default 10 trades, compounded).
- Since entry: after the entry time, the script tracks which level was reached first - stop or target - and ends the zones there.
HOW TO USE
- Plan before you click buy or sell: check size, net R and break-even win rate.
- If the stop is flagged as inside normal noise, consider a wider stop with a smaller position instead of a tight stop with a large one.
- Change account size, risk and costs in the inputs; move entry, stop and target by dragging the points or in the settings.
- Alerts: stop level reached, target level reached, price crossed entry.
THE CHART
BTCUSD daily. Long planned at the last close with a stop 1.56 ATR below and the target at 2R. Account 10,000, risk 1 percent, no costs entered. The table shows position size 0.0294 BTC, risk 99.69 USD, risk : reward 1 : 2, break-even win rate 33.3 percent and a 10-trade losing streak of about -9.5 percent.
WHAT IS ORIGINAL
Position size calculators already exist. This one combines sizing with three checks that are usually missing: the cost-adjusted break-even win rate, the stop distance measured in ATR with a noise warning, and a compounded losing-streak preview. It also tracks whether stop or target was reached first after the entry.
LIMITATIONS
- Amounts are shown in the currency of the symbol. If your account currency is different, convert the risk amount yourself.
- Point value comes from the symbol information; check contract specs with your broker, especially for CFDs and forex lot sizes.
- The outcome check uses bar highs and lows. If stop and target are both touched in the same bar, the stop is counted first (conservative).
- The tool does not place orders and gives no trade signals.
Disclaimer
For educational and analytical purposes only. Not financial advice. Marks and signals are not buy or sell recommendations. Past behaviour does not guarantee future results.

Indicatr - the indicators you know, rebuilt with market context: volume, trend and momentum, for long and short. Free open-source tools and Pro tools. Guides and setups: indicator.trading/en/link
Declinazione di responsabilità
Le informazioni e le pubblicazioni non sono intese come, e non costituiscono, consulenza o raccomandazioni finanziarie, di investimento, di trading o di altro tipo fornite o approvate da TradingView. Per ulteriori informazioni, consultare i Termini di utilizzo.
Indicatr - the indicators you know, rebuilt with market context: volume, trend and momentum, for long and short. Free open-source tools and Pro tools. Guides and setups: indicator.trading/en/link
Declinazione di responsabilità
Le informazioni e le pubblicazioni non sono intese come, e non costituiscono, consulenza o raccomandazioni finanziarie, di investimento, di trading o di altro tipo fornite o approvate da TradingView. Per ulteriori informazioni, consultare i Termini di utilizzo.