OPEN-SOURCE SCRIPT
Aggiornato GMS Ultimate Indicator
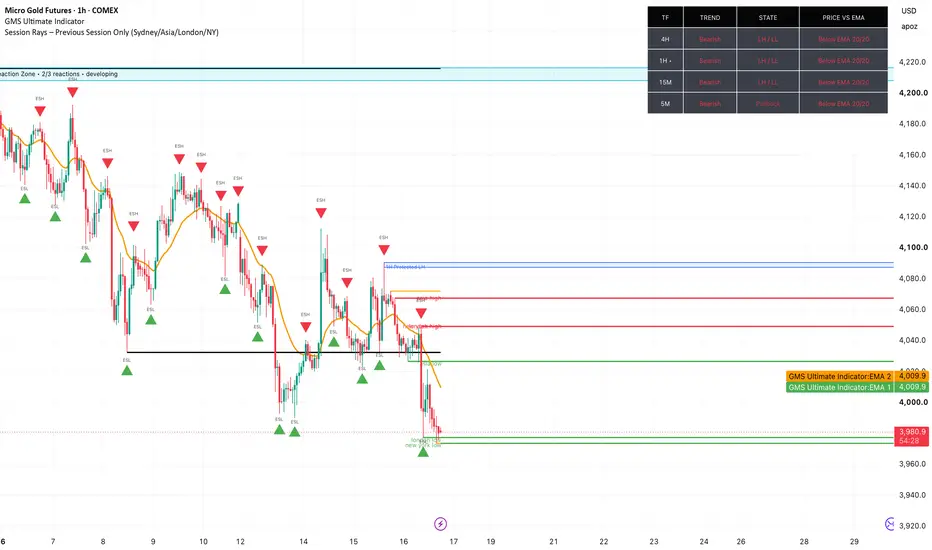
GMS Ultimate Indicator 9.0 is a customizable multi timeframe market structure and price action tool designed to help traders stay aligned with the dominant side of the market.
It analyzes the Daily, 4H, 1H, 15M, 5M, and 1M trends using HH/HL and LH/LL structure, while identifying pullbacks, consolidation, liquidity sweeps, BOS, CHOCH, protected structure, reaction zones, retests, and rejection candles. Its setup engine helps locate higher probability entries within the broader trend, with adjustable alerts, dashboard layouts, and display settings.
For analysis and educational purposes only. Use proper risk management and backtesting.
It analyzes the Daily, 4H, 1H, 15M, 5M, and 1M trends using HH/HL and LH/LL structure, while identifying pullbacks, consolidation, liquidity sweeps, BOS, CHOCH, protected structure, reaction zones, retests, and rejection candles. Its setup engine helps locate higher probability entries within the broader trend, with adjustable alerts, dashboard layouts, and display settings.
For analysis and educational purposes only. Use proper risk management and backtesting.
Note di rilascio
GMS Ultimate Indicator is a customizable multi timeframe market structure and price action tool designed to help traders stay aligned with the market’s direction. It tracks 4H, 1H, 15M, and 5M trend conditions, structure state, and price position relative to selected EMAs.The indicator also identifies BOS, CHOCH, swing highs and lows, liquidity pools and sweeps, previous day/week levels, protected 1H structure, 4H reaction zones, retests, rejection candles, potential setups, targets, and alerts.
Built for scalpers, intraday traders, and swing traders who use market structure and price action. For analysis and educational purposes only.
Note di rilascio
GMS Ultimate Indicator is a customizable multi timeframe market structure and price action tool designed to help traders stay aligned with the market’s direction. It tracks 4H, 1H, 15M, and 5M trend conditions, structure state, and price position relative to selected EMAs.The indicator also identifies BOS, CHOCH, swing highs and lows, liquidity pools and sweeps, previous day/week levels, protected 1H structure, 4H reaction zones, retests, rejection candles, potential setups, targets, and alerts.
Built for scalpers, intraday traders, and swing traders who use market structure and price action. For analysis and educational purposes only.
Note di rilascio
GMS Ultimate Indicator is a customizable multi timeframe market structure and price action tool designed to help traders stay aligned with the market’s direction. It tracks 4H, 1H, 15M, and 5M trend conditions, structure state, and price position relative to selected EMAs.The indicator also identifies BOS, CHOCH, swing highs and lows, liquidity pools and sweeps, previous day/week levels, protected 1H structure, 4H reaction zones, retests, rejection candles, potential setups, targets, and alerts.
Built for scalpers, intraday traders, and swing traders who use market structure and price action. For analysis and educational purposes only.
Note di rilascio
GMS Ultimate Indicator is a customizable multi timeframe market structure and price action tool designed to help traders stay aligned with the market’s direction. It tracks 4H, 1H, 15M, and 5M trend conditions, structure state, and price position relative to selected EMAs.The indicator also identifies BOS, CHOCH, swing highs and lows, liquidity pools and sweeps, previous day/week levels, protected 1H structure, 4H reaction zones, retests, rejection candles, potential setups, targets, and alerts.
Built for scalpers, intraday traders, and swing traders who use market structure and price action. For analysis and educational purposes only.
Note di rilascio
Updated : 12.9GMS Ultimate Indicator is a customizable multi timeframe market structure and price action tool designed to help traders stay aligned with the dominant side of the market.
It analyzes the Daily, 4H, 1H, 15M, 5M, and 1M trends using HH/HL and LH/LL structure, while identifying pullbacks, consolidation, liquidity sweeps, BOS, CHOCH, protected structure, reaction zones, retests, and rejection candles. Its setup engine helps locate higher probability entries within the broader trend, with adjustable alerts, dashboard layouts, and display settings.
For analysis and educational purposes only. Use proper risk management and backtesting.
Note di rilascio
Updated v 13.0 GMS Ultimate Indicator is a customizable multi timeframe market structure and price action tool designed to help traders stay aligned with the dominant side of the market.
It analyzes the Daily, 4H, 1H, 15M, 5M, and 1M trends using HH/HL and LH/LL structure, while identifying pullbacks, consolidation, liquidity sweeps, BOS, CHOCH, protected structure, reaction zones, retests, and rejection candles. Its setup engine helps locate higher probability entries within the broader trend, with adjustable alerts, dashboard layouts, and display settings.
For analysis and educational purposes only. Use proper risk management and backtesting.
Script open-source
Nello spirito di TradingView, l'autore di questo script lo ha reso open source, in modo che i trader possano esaminarne e verificarne la funzionalità. Complimenti all'autore! Sebbene sia possibile utilizzarlo gratuitamente, ricordiamo che la ripubblicazione del codice è soggetta al nostro Regolamento.

Declinazione di responsabilità
Le informazioni e le pubblicazioni non sono intese come, e non costituiscono, consulenza o raccomandazioni finanziarie, di investimento, di trading o di altro tipo fornite o approvate da TradingView. Per ulteriori informazioni, consultare i Termini di utilizzo.
Script open-source
Nello spirito di TradingView, l'autore di questo script lo ha reso open source, in modo che i trader possano esaminarne e verificarne la funzionalità. Complimenti all'autore! Sebbene sia possibile utilizzarlo gratuitamente, ricordiamo che la ripubblicazione del codice è soggetta al nostro Regolamento.
Declinazione di responsabilità
Le informazioni e le pubblicazioni non sono intese come, e non costituiscono, consulenza o raccomandazioni finanziarie, di investimento, di trading o di altro tipo fornite o approvate da TradingView. Per ulteriori informazioni, consultare i Termini di utilizzo.