OPEN-SOURCE SCRIPT
Aggiornato Stablecoin Liquidity Pulse Map [AGPro Series]
Stablecoin Liquidity Pulse Map [AGPro Series]
🧠 Core Idea
Is stablecoin liquidity expanding into the market, parking defensively on the sidelines, or drying up before risk appetite weakens?
📌 Overview / What it does
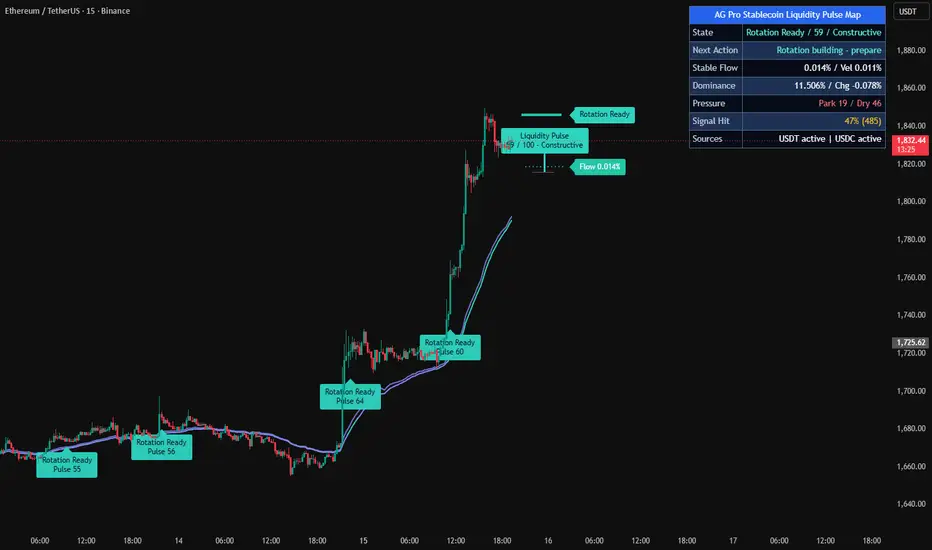
Stablecoin Liquidity Pulse Map [AGPro Series] is a crypto market-context tool that maps stablecoin liquidity flow, stablecoin dominance pressure, and risk-appetite behavior into a clean visual pulse framework.
The script reads USDT and USDC market-cap sources, optionally includes DAI, compares stablecoin flow against broader crypto market-cap context, and converts those inputs into liquidity pulse states.
It produces a right-side liquidity pulse ribbon, pulse tracks, selective event labels, optional compact markers, and an AG Pro dashboard panel. It does not predict price, automate trades, or claim that stablecoin growth must immediately create a bullish market.
🎯 Purpose & Design Philosophy
Stablecoins are one of the most important liquidity layers in crypto.
When stablecoin supply expands, capital may be entering or preparing to rotate. When stablecoin dominance rises while price weakens, capital may be parking defensively. When stablecoin flow contracts, risk liquidity can become thinner.
This script was built to turn that macro liquidity layer into a practical chart-reading tool without pretending that liquidity alone is a complete trading system.
⚡ Why This Script Is Different
Most tools focus on price, trend, volatility, or exchange-specific derivatives data.
This script does NOT focus on funding, open interest, basis, leverage reset, liquidation levels, or ordinary trend signals.
Instead, it studies the stablecoin liquidity layer behind the market. It asks whether stablecoin flow, dominance pressure, and price behavior are aligned with expansion, defensive parking, dry liquidity, or early rotation.
⚙️ Methodology
1. Stablecoin Flow Detection
The script reads USDT and USDC market-cap data, with optional DAI inclusion.
2. Dominance Pressure Mapping
It compares stablecoin value against total crypto market-cap context when available.
3. Risk-Appetite Evaluation
It evaluates whether price is behaving constructively or defensively relative to a baseline.
4. Pulse Classification
The script combines flow, velocity, dominance pressure, parking risk, dry-liquidity behavior, and rotation context into a single liquidity pulse state.
🗺️ How to Read the Chart
The right-side pulse ribbon is the main visual object.
The center ribbon shows the active liquidity pulse state.
The upper ribbon tracks stablecoin flow and expansion pressure.
The lower ribbon helps identify parking or dry-liquidity pressure.
The vertical needle shows where the current pulse sits inside the active liquidity range.
Event labels identify important state changes such as Liquidity Inflow, Risk-Off Parking, Dry Liquidity, or Rotation Ready.
The panel summarizes state, pulse, stable flow, velocity, dominance, dominance change, direction, grade, risk parking, dry score, and data-source availability.
🚦 Signals & States
• Liquidity Expansion → stablecoin flow is improving while dominance pressure is not defensive
• Risk-Off Parking → stablecoin dominance pressure is rising while market appetite weakens
• Dry Liquidity → stablecoin flow is contracting and liquidity conditions may be thinner
• Rotation Ready → stablecoin flow improves while market behavior begins to recover
• Neutral Pulse → no strong stablecoin liquidity state is active
• Data Missing → selected stablecoin sources are unavailable
🔔 Alerts Logic
Alerts can be enabled for Liquidity Expansion, Risk-Off Parking, Dry Liquidity, and Rotation Ready.
Each alert triggers when the selected state becomes active. Alerts are attention markers, not trade instructions.
🧩 Confluence Logic
The strongest reads happen when stablecoin flow, velocity, dominance behavior, and price context align.
For example, rising stablecoin flow with falling defensive dominance pressure can support a constructive liquidity read.
Rising stablecoin dominance while price weakens can suggest defensive parking rather than active risk appetite.
📊 When to Use
• Crypto market-cycle analysis
• BTC and ETH context checks
• Stablecoin liquidity monitoring
• Risk-on / risk-off environment review
• Macro crypto liquidity dashboards
• 1D and 1W chart analysis
⚠️ When NOT to Use
• Very low liquidity altcoins as the only decision source
• Symbols where stablecoin market-cap data does not load
• Extremely noisy intraday charts
• Situations requiring exact exchange order flow
• Any workflow that expects a standalone buy/sell signal
🎛️ Key Inputs
• USDT Market Cap Symbol → primary stablecoin source
• USDC Market Cap Symbol → secondary stablecoin source
• Include DAI Source → optional additional stablecoin component
• Total Crypto Market Cap Symbol → used for dominance pressure
• Liquidity Flow Length → controls stablecoin flow measurement
• Pulse Baseline Length → controls slower liquidity and trend context
• Inflow / Outflow Thresholds → control state sensitivity
• Dominance Pressure Threshold → controls risk-off parking sensitivity
• Visual settings → control ribbon, event labels, tracks, markers, panel, and font sizes
🖥️ Interface & Visual Design
The design is intentionally different from derivatives-focused maps.
It avoids large projected zones, liquidation paths, reset ladders, and basis meters.
The right-side pulse ribbon keeps the visual focused on liquidity context rather than exact price levels. Colors remain visible on both dark and white chart backgrounds, and the panel follows the AG Pro merged-header format.
🧪 Practical Usage Workflow
1. Read the panel state first.
2. Confirm USDT and USDC sources are active.
3. Check stable flow and dominance change.
4. Review the right-side pulse ribbon.
5. Compare the state with price structure and broader market trend.
6. Use alerts as attention markers, not trade instructions.
🔍 Interpretation Guidelines
Liquidity Expansion does not guarantee upside.
Risk-Off Parking does not guarantee downside.
Dry Liquidity does not guarantee immediate volatility.
Rotation Ready means conditions are improving, not that a rotation must occur.
Use the script as a market-context layer alongside structure, trend, volatility, and disciplined risk management.
🚫 What This Script Is NOT
This script is not a prediction engine.
It is not financial advice.
It is not an automated trading system.
It is not an exact order-flow tool.
It does not guarantee market direction.
⚠️ Limitations & Transparency
Stablecoin market-cap symbols depend on TradingView data availability.
Total crypto market-cap data may not be available in every environment.
Stablecoin supply changes can lag market behavior.
Different timeframes can produce different interpretations.
Extreme events, exchange stress, depegs, or abnormal data conditions can affect readings.
🧠 Market Context Notes
Stablecoin liquidity is not automatically bullish or bearish.
The meaning depends on context. Stablecoins can represent incoming buying power, defensive parking, cash rotation, or liquidity withdrawal.
This script focuses on interpreting that context more clearly.
🧾 Use Case Examples
When stablecoin flow rises and defensive dominance pressure is low, the script may show Liquidity Expansion.
When stablecoin dominance rises while price weakens, it may show Risk-Off Parking.
When stablecoin flow contracts and market appetite is weak, it may show Dry Liquidity.
When stablecoin flow improves with early market recovery, it may show Rotation Ready.
🧱 System Philosophy
AGProLabs scripts are built as structured decision-support tools.
The goal is to make hidden market context easier to read, not to replace judgment with certainty.
🔐 Non-Promise Statement
No liquidity model can remove uncertainty.
No state should be treated as certainty.
No visual element should replace trader judgment.
📉 Risk Disclosure
Trading involves risk.
Crypto markets can be highly volatile and liquidity conditions can change quickly.
This script is for educational and analytical purposes only.
Nothing in this script should be interpreted as financial advice, investment advice, or a guaranteed trading outcome.
Users remain fully responsible for their own decisions.
📚 Educational Note
Use this script to study how stablecoin supply, stablecoin dominance, and risk appetite interact across crypto market cycles.
🧠 Core Idea
Is stablecoin liquidity expanding into the market, parking defensively on the sidelines, or drying up before risk appetite weakens?
📌 Overview / What it does
Stablecoin Liquidity Pulse Map [AGPro Series] is a crypto market-context tool that maps stablecoin liquidity flow, stablecoin dominance pressure, and risk-appetite behavior into a clean visual pulse framework.
The script reads USDT and USDC market-cap sources, optionally includes DAI, compares stablecoin flow against broader crypto market-cap context, and converts those inputs into liquidity pulse states.
It produces a right-side liquidity pulse ribbon, pulse tracks, selective event labels, optional compact markers, and an AG Pro dashboard panel. It does not predict price, automate trades, or claim that stablecoin growth must immediately create a bullish market.
🎯 Purpose & Design Philosophy
Stablecoins are one of the most important liquidity layers in crypto.
When stablecoin supply expands, capital may be entering or preparing to rotate. When stablecoin dominance rises while price weakens, capital may be parking defensively. When stablecoin flow contracts, risk liquidity can become thinner.
This script was built to turn that macro liquidity layer into a practical chart-reading tool without pretending that liquidity alone is a complete trading system.
⚡ Why This Script Is Different
Most tools focus on price, trend, volatility, or exchange-specific derivatives data.
This script does NOT focus on funding, open interest, basis, leverage reset, liquidation levels, or ordinary trend signals.
Instead, it studies the stablecoin liquidity layer behind the market. It asks whether stablecoin flow, dominance pressure, and price behavior are aligned with expansion, defensive parking, dry liquidity, or early rotation.
⚙️ Methodology
1. Stablecoin Flow Detection
The script reads USDT and USDC market-cap data, with optional DAI inclusion.
2. Dominance Pressure Mapping
It compares stablecoin value against total crypto market-cap context when available.
3. Risk-Appetite Evaluation
It evaluates whether price is behaving constructively or defensively relative to a baseline.
4. Pulse Classification
The script combines flow, velocity, dominance pressure, parking risk, dry-liquidity behavior, and rotation context into a single liquidity pulse state.
🗺️ How to Read the Chart
The right-side pulse ribbon is the main visual object.
The center ribbon shows the active liquidity pulse state.
The upper ribbon tracks stablecoin flow and expansion pressure.
The lower ribbon helps identify parking or dry-liquidity pressure.
The vertical needle shows where the current pulse sits inside the active liquidity range.
Event labels identify important state changes such as Liquidity Inflow, Risk-Off Parking, Dry Liquidity, or Rotation Ready.
The panel summarizes state, pulse, stable flow, velocity, dominance, dominance change, direction, grade, risk parking, dry score, and data-source availability.
🚦 Signals & States
• Liquidity Expansion → stablecoin flow is improving while dominance pressure is not defensive
• Risk-Off Parking → stablecoin dominance pressure is rising while market appetite weakens
• Dry Liquidity → stablecoin flow is contracting and liquidity conditions may be thinner
• Rotation Ready → stablecoin flow improves while market behavior begins to recover
• Neutral Pulse → no strong stablecoin liquidity state is active
• Data Missing → selected stablecoin sources are unavailable
🔔 Alerts Logic
Alerts can be enabled for Liquidity Expansion, Risk-Off Parking, Dry Liquidity, and Rotation Ready.
Each alert triggers when the selected state becomes active. Alerts are attention markers, not trade instructions.
🧩 Confluence Logic
The strongest reads happen when stablecoin flow, velocity, dominance behavior, and price context align.
For example, rising stablecoin flow with falling defensive dominance pressure can support a constructive liquidity read.
Rising stablecoin dominance while price weakens can suggest defensive parking rather than active risk appetite.
📊 When to Use
• Crypto market-cycle analysis
• BTC and ETH context checks
• Stablecoin liquidity monitoring
• Risk-on / risk-off environment review
• Macro crypto liquidity dashboards
• 1D and 1W chart analysis
⚠️ When NOT to Use
• Very low liquidity altcoins as the only decision source
• Symbols where stablecoin market-cap data does not load
• Extremely noisy intraday charts
• Situations requiring exact exchange order flow
• Any workflow that expects a standalone buy/sell signal
🎛️ Key Inputs
• USDT Market Cap Symbol → primary stablecoin source
• USDC Market Cap Symbol → secondary stablecoin source
• Include DAI Source → optional additional stablecoin component
• Total Crypto Market Cap Symbol → used for dominance pressure
• Liquidity Flow Length → controls stablecoin flow measurement
• Pulse Baseline Length → controls slower liquidity and trend context
• Inflow / Outflow Thresholds → control state sensitivity
• Dominance Pressure Threshold → controls risk-off parking sensitivity
• Visual settings → control ribbon, event labels, tracks, markers, panel, and font sizes
🖥️ Interface & Visual Design
The design is intentionally different from derivatives-focused maps.
It avoids large projected zones, liquidation paths, reset ladders, and basis meters.
The right-side pulse ribbon keeps the visual focused on liquidity context rather than exact price levels. Colors remain visible on both dark and white chart backgrounds, and the panel follows the AG Pro merged-header format.
🧪 Practical Usage Workflow
1. Read the panel state first.
2. Confirm USDT and USDC sources are active.
3. Check stable flow and dominance change.
4. Review the right-side pulse ribbon.
5. Compare the state with price structure and broader market trend.
6. Use alerts as attention markers, not trade instructions.
🔍 Interpretation Guidelines
Liquidity Expansion does not guarantee upside.
Risk-Off Parking does not guarantee downside.
Dry Liquidity does not guarantee immediate volatility.
Rotation Ready means conditions are improving, not that a rotation must occur.
Use the script as a market-context layer alongside structure, trend, volatility, and disciplined risk management.
🚫 What This Script Is NOT
This script is not a prediction engine.
It is not financial advice.
It is not an automated trading system.
It is not an exact order-flow tool.
It does not guarantee market direction.
⚠️ Limitations & Transparency
Stablecoin market-cap symbols depend on TradingView data availability.
Total crypto market-cap data may not be available in every environment.
Stablecoin supply changes can lag market behavior.
Different timeframes can produce different interpretations.
Extreme events, exchange stress, depegs, or abnormal data conditions can affect readings.
🧠 Market Context Notes
Stablecoin liquidity is not automatically bullish or bearish.
The meaning depends on context. Stablecoins can represent incoming buying power, defensive parking, cash rotation, or liquidity withdrawal.
This script focuses on interpreting that context more clearly.
🧾 Use Case Examples
When stablecoin flow rises and defensive dominance pressure is low, the script may show Liquidity Expansion.
When stablecoin dominance rises while price weakens, it may show Risk-Off Parking.
When stablecoin flow contracts and market appetite is weak, it may show Dry Liquidity.
When stablecoin flow improves with early market recovery, it may show Rotation Ready.
🧱 System Philosophy
AGProLabs scripts are built as structured decision-support tools.
The goal is to make hidden market context easier to read, not to replace judgment with certainty.
🔐 Non-Promise Statement
No liquidity model can remove uncertainty.
No state should be treated as certainty.
No visual element should replace trader judgment.
📉 Risk Disclosure
Trading involves risk.
Crypto markets can be highly volatile and liquidity conditions can change quickly.
This script is for educational and analytical purposes only.
Nothing in this script should be interpreted as financial advice, investment advice, or a guaranteed trading outcome.
Users remain fully responsible for their own decisions.
📚 Educational Note
Use this script to study how stablecoin supply, stablecoin dominance, and risk appetite interact across crypto market cycles.
Note di rilascio
🔧 UPDATE NOTES - V1.1This update focuses on readability, panel contrast, chart structure, and cleaner public-release presentation.
The core purpose of the script remains unchanged.
This release improves how the existing stablecoin liquidity logic is presented, organized, and interpreted on the chart.
This script continues to function as an analytical and visualization tool.
It does not attempt to predict price direction or provide guaranteed outcomes.
------------------------
What Changed
------------------------
• Rebuilt the AG Pro panel into the current standard layout.
The panel now uses a single merged blue header row with only the script name in the header.
• Replaced the older multi-column panel with a cleaner two-column readout.
This improves scanning and reduces the compact-table feel on publication screenshots.
• Standardized panel themes.
The panel now uses Dark and Light options for consistency with current AGPro public-release formatting.
• Improved dark-panel contrast.
Panel row backgrounds, borders, labels, and values now use stronger separation for clearer reading.
• Improved chart label and tag readability.
Event labels, center labels, and right-side tags now use contrast-aware text coloring.
------------------------
Visual Improvements
------------------------
• Improved chart readability by refining label contrast, right-side tags, and pulse-ribbon text.
• Reduced visual clutter while keeping enough event labels for an active chart story.
• Refined visual hierarchy so liquidity state, stable flow, dominance pressure, and action context are easier to separate.
• Adjusted default label density to keep the chart informative without crowding price action.
------------------------
Interface & Usability
------------------------
• Optimized panel layout for clearer information flow.
• Improved label readability for better chart interaction.
• Added the full standard panel-location option set.
• Preserved configurable panel visibility, location, theme, and font-size controls.
------------------------
Behavior Notes
------------------------
This update does not change the core analytical logic of the script.
The goal is to improve clarity and usability, not to introduce new predictive behavior.
Users should interpret outputs the same way as before, but with improved visual structure.
------------------------
Limitations Reminder
------------------------
The script remains a rule-based analytical tool.
Stablecoin market-cap feeds, dominance data, timeframe differences, exchange context, and crypto volatility may affect how liquidity states appear.
Outputs should always be interpreted within broader market context.
------------------------
Risk Reminder
------------------------
This script is for educational and analytical purposes only.
It does not provide financial advice or guaranteed trading outcomes.
Crypto markets can move rapidly and liquidity conditions can change without warning.
Users remain responsible for their own decisions.
Note di rilascio
🔧 UPDATE NOTES - v1.2This update focuses on readability and on adding a signal hit-rate proof.
The core purpose of the script remains unchanged.
This release keeps the same stablecoin liquidity pulse model and states, declutters the
right-side ribbon, adds a clear next action, and proves how often each liquidity state was
confirmed by the chart symbol's follow-through.
This script continues to function as an analytical and visualization tool.
It does not attempt to predict price direction or provide guaranteed outcomes.
------------------------
What Changed
------------------------
- Decluttered pulse ribbon
Removed a duplicate pulse tag and tightened the centered badge into a clean two-line
readout, so the right-side ribbon reads premium instead of crowded.
- Signal Hit proof layer
The panel now reports how often a liquidity state was confirmed by price within a defined
window. Risk-on states are checked for upside follow-through; risk-off states for downside.
Shown with the sample count for transparency.
- Clear Next Action row
The panel now states an explicit posture for each liquidity state (favor strength, prepare
for rotation, protect capital, reduce size, or wait) instead of a descriptive line.
- New proof inputs
Added Signal Proof Window and Signal Proof Move ATR to control how signals are scored.
------------------------
Visual Improvements
------------------------
- Reduced right-side label stacking for a cleaner first-glance read
- Tightened the centered liquidity badge to a single, non-redundant readout
- Kept event labels selective and clear of candles
- Preserved the pulse tracks and ribbon identity while lowering visual noise
------------------------
Interface & Usability
------------------------
- Added Next Action and Signal Hit rows to the panel for an at-a-glance decision and track record
- Refined panel hierarchy so state, action and proof lead the readout
- Adjusted default visuals for a balanced, publication-ready appearance
- Enhanced overall user experience without changing the core liquidity logic
------------------------
Behavior Notes
------------------------
This update does not change the core analytical logic of the script.
The liquidity states and scores are unchanged. The Signal Hit rate is a separate historical
track-record layer and does not alter how states are classified.
------------------------
Limitations Reminder
------------------------
The script remains a rule-based analytical tool that depends on external stablecoin market-cap data.
Market conditions such as volatility, liquidity, and data availability may affect how states and
the hit rate appear.
Outputs should always be interpreted within broader market context.
------------------------
Risk Reminder
------------------------
This script is for educational and analytical purposes only.
It does not provide financial advice or guaranteed trading outcomes.
Users remain responsible for their own decisions.
Script open-source
Nello spirito di TradingView, l'autore di questo script lo ha reso open source, in modo che i trader possano esaminarne e verificarne la funzionalità. Complimenti all'autore! Sebbene sia possibile utilizzarlo gratuitamente, ricordiamo che la ripubblicazione del codice è soggetta al nostro Regolamento.

Public-free scripts + invite-only AGPro workflows for market analysis, liquidity context, risk planning and execution review.
Rules-based. No hype. No guesswork.
Library & access: agprolabs.com/
Telegram: t.me/agprolabs
Rules-based. No hype. No guesswork.
Library & access: agprolabs.com/
Telegram: t.me/agprolabs
Declinazione di responsabilità
Le informazioni e le pubblicazioni non sono intese come, e non costituiscono, consulenza o raccomandazioni finanziarie, di investimento, di trading o di altro tipo fornite o approvate da TradingView. Per ulteriori informazioni, consultare i Termini di utilizzo.
Script open-source
Nello spirito di TradingView, l'autore di questo script lo ha reso open source, in modo che i trader possano esaminarne e verificarne la funzionalità. Complimenti all'autore! Sebbene sia possibile utilizzarlo gratuitamente, ricordiamo che la ripubblicazione del codice è soggetta al nostro Regolamento.
Public-free scripts + invite-only AGPro workflows for market analysis, liquidity context, risk planning and execution review.
Rules-based. No hype. No guesswork.
Library & access: agprolabs.com/
Telegram: t.me/agprolabs
Rules-based. No hype. No guesswork.
Library & access: agprolabs.com/
Telegram: t.me/agprolabs
Declinazione di responsabilità
Le informazioni e le pubblicazioni non sono intese come, e non costituiscono, consulenza o raccomandazioni finanziarie, di investimento, di trading o di altro tipo fornite o approvate da TradingView. Per ulteriori informazioni, consultare i Termini di utilizzo.