The Staircase
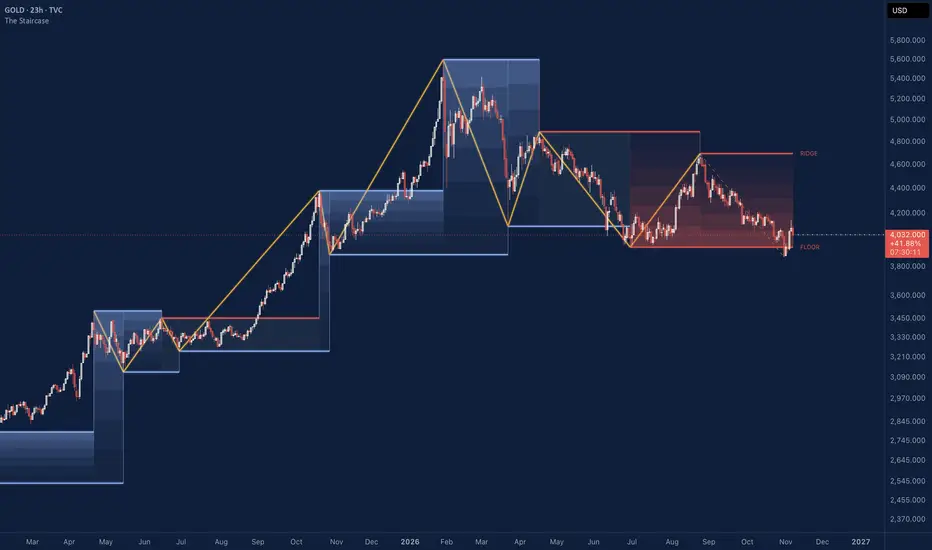
This shows you the multi month swing structure.
Zoom out far enough and every market is a staircase. Gold climbs a flight, rests on a landing, slips a step, climbs again. The big turns, months apart, are the steps. The Staircase draws them on your chart, so the trend is something you see in one look, not something you have to work out.
Climbing the stairs or walking down them? Look at the colour. That is the whole read.
IN ONE LOOK
Every big swing high is a step, held flat until the next big high takes over. Every big swing low the same. A step higher than the last of its kind is blue. A step lower is red. Highs and lows both stepping up: the space between them fills blue, strongest at the high step, the edge that is leading. Highs and lows both stepping down: red, strongest at the low step. One up and one down: you are on a landing, and the shade goes faint to say so. The gold line is the path through the swings. The dashed gold line is the swing still being built: wet cement, not a step yet. RIDGE names the last known swing high, FLOOR the last known swing low. If one sits off the screen, its name waits at the edge: RIDGE ABOVE, FLOOR BELOW. Hover a name for its price and the day it was made. No numbers on the chart, no odds, no table. Just the stairs.
HOW A SWING IS FOUND
It reads the day, closed days only, whatever chart you have open. A swing high is the highest high of 30 days on each side of it, about six weeks each way. A swing low is the lowest low. Highs and lows always alternate, so the stairs never skip a step. If two swing highs come with no swing low between them, the lowest low between them becomes the low they skipped. Two swing lows take the highest high between them. On my broker's gold, 2013 to November 2026, that is 84 swings, about one every 42 trading days. Big swings only. The noise stays out.
LATE ON PURPOSE
A swing counts only once its 30 days to the right have closed. Until then it is not on the chart. A swing filled in by the alternating rule is known when the swing after it is. That makes it late, by design. It also makes it a line you can trust: once a step is on the chart, it never moves and never disappears. Late and true beats early and redrawn. One thing to know when you scroll back: the steps are drawn from the day the swing was made, so on history a step appears to start before anyone could have known it. Open Bar Replay and you will watch each step arrive on the day it was known, not a day sooner. Every value it takes from the daily chart is the day before's, so the live day never moves anything. Nothing repaints.
ON THE CHART ABOVE
TradingView's gold on its 23 hour day, January 2025 to November 2026. Up the stairs into the late January 2026 high near 5,600, blue all the way, except the summer and early autumn of 2025, when one high came in lower and the shade went faint: a landing. Then down. A lower high in April: one edge down, a landing again, faint. The end of June low stepped under the March low: both edges down, red. Late August added another lower high. At the end of October price traded under that June floor. The dashed line is that swing, still forming. It becomes a step only if it holds its 30 days.
WHAT IS DIFFERENT
Pivots and zigzags are everywhere. Most draw points or a zigzag and leave the reading to you, and a zigzag's last leg keeps moving as price does. Here is what this one does that they do not. It reads the day on any chart up to the day, so your 10 minute chart and your daily chart carry the same staircase, and nothing on it repaints. Highs and lows always alternate, so the stairs never skip a step. Each swing is held as a step until the next of its kind, and the space between is shaded by which way the stairs are running, strongest at the leading edge. The trend is the picture. It keeps the candles' height. Steps far from the candles on screen are named at the edge instead of drawn, so they never squash your chart. Zoomed in, the shade goes quiet.
SETTINGS
Swing size, days each side: 30. Smaller gives more, shorter swings. Larger gives fewer, longer ones. Swings to draw, at most: 40, about six years of gold's day. Shade between the steps, the path through the swings, the swing still forming, the names of the last two steps: each on or off. Colours for a higher step, a lower step, a step not yet compared, and the path.
ALERTS
The Staircase: a higher step. The Staircase: a lower step. The Staircase: a new step. Each fires once, on the first bar after the swing is known. Set one and let the stairs tap you on the shoulder.
LIMITS
It describes the structure so far. It does not say where price goes next. A broken floor or ridge stays drawn until the next swing of its kind is known, 30 days or more later. The staircase moves slowly on purpose. On charts under the day, a step starts at the open of the day it was made, not at the bar that made it. The path and the forming swing are drawn only when the chart shows at least 30 days. Above the daily chart it draws nothing in this version, and says so on the chart. The day is your symbol's own daily bar on TradingView.
WHY I BUILT IT
Humans are not computers. We view everything in pictures. When we speak we don't see words, it's a motion picture. So I wanted the overall trend as a picture, not data: the multi month highs and lows, in one look.
Zoom out far enough and every market is a staircase. Gold climbs a flight, rests on a landing, slips a step, climbs again. The big turns, months apart, are the steps. The Staircase draws them on your chart, so the trend is something you see in one look, not something you have to work out.
Climbing the stairs or walking down them? Look at the colour. That is the whole read.
IN ONE LOOK
Every big swing high is a step, held flat until the next big high takes over. Every big swing low the same. A step higher than the last of its kind is blue. A step lower is red. Highs and lows both stepping up: the space between them fills blue, strongest at the high step, the edge that is leading. Highs and lows both stepping down: red, strongest at the low step. One up and one down: you are on a landing, and the shade goes faint to say so. The gold line is the path through the swings. The dashed gold line is the swing still being built: wet cement, not a step yet. RIDGE names the last known swing high, FLOOR the last known swing low. If one sits off the screen, its name waits at the edge: RIDGE ABOVE, FLOOR BELOW. Hover a name for its price and the day it was made. No numbers on the chart, no odds, no table. Just the stairs.
HOW A SWING IS FOUND
It reads the day, closed days only, whatever chart you have open. A swing high is the highest high of 30 days on each side of it, about six weeks each way. A swing low is the lowest low. Highs and lows always alternate, so the stairs never skip a step. If two swing highs come with no swing low between them, the lowest low between them becomes the low they skipped. Two swing lows take the highest high between them. On my broker's gold, 2013 to November 2026, that is 84 swings, about one every 42 trading days. Big swings only. The noise stays out.
LATE ON PURPOSE
A swing counts only once its 30 days to the right have closed. Until then it is not on the chart. A swing filled in by the alternating rule is known when the swing after it is. That makes it late, by design. It also makes it a line you can trust: once a step is on the chart, it never moves and never disappears. Late and true beats early and redrawn. One thing to know when you scroll back: the steps are drawn from the day the swing was made, so on history a step appears to start before anyone could have known it. Open Bar Replay and you will watch each step arrive on the day it was known, not a day sooner. Every value it takes from the daily chart is the day before's, so the live day never moves anything. Nothing repaints.
ON THE CHART ABOVE
TradingView's gold on its 23 hour day, January 2025 to November 2026. Up the stairs into the late January 2026 high near 5,600, blue all the way, except the summer and early autumn of 2025, when one high came in lower and the shade went faint: a landing. Then down. A lower high in April: one edge down, a landing again, faint. The end of June low stepped under the March low: both edges down, red. Late August added another lower high. At the end of October price traded under that June floor. The dashed line is that swing, still forming. It becomes a step only if it holds its 30 days.
WHAT IS DIFFERENT
Pivots and zigzags are everywhere. Most draw points or a zigzag and leave the reading to you, and a zigzag's last leg keeps moving as price does. Here is what this one does that they do not. It reads the day on any chart up to the day, so your 10 minute chart and your daily chart carry the same staircase, and nothing on it repaints. Highs and lows always alternate, so the stairs never skip a step. Each swing is held as a step until the next of its kind, and the space between is shaded by which way the stairs are running, strongest at the leading edge. The trend is the picture. It keeps the candles' height. Steps far from the candles on screen are named at the edge instead of drawn, so they never squash your chart. Zoomed in, the shade goes quiet.
SETTINGS
Swing size, days each side: 30. Smaller gives more, shorter swings. Larger gives fewer, longer ones. Swings to draw, at most: 40, about six years of gold's day. Shade between the steps, the path through the swings, the swing still forming, the names of the last two steps: each on or off. Colours for a higher step, a lower step, a step not yet compared, and the path.
ALERTS
The Staircase: a higher step. The Staircase: a lower step. The Staircase: a new step. Each fires once, on the first bar after the swing is known. Set one and let the stairs tap you on the shoulder.
LIMITS
It describes the structure so far. It does not say where price goes next. A broken floor or ridge stays drawn until the next swing of its kind is known, 30 days or more later. The staircase moves slowly on purpose. On charts under the day, a step starts at the open of the day it was made, not at the bar that made it. The path and the forming swing are drawn only when the chart shows at least 30 days. Above the daily chart it draws nothing in this version, and says so on the chart. The day is your symbol's own daily bar on TradingView.
WHY I BUILT IT
Humans are not computers. We view everything in pictures. When we speak we don't see words, it's a motion picture. So I wanted the overall trend as a picture, not data: the multi month highs and lows, in one look.

The Fan: 7 days free, then €149.99/month. Cancel before day 7 and pay nothing.
Start the trial: thesimplifier7.com/method.html
The record, every miss kept: thesimplifier7.com
Questions: DM @TheSimplifier7 on X
Start the trial: thesimplifier7.com/method.html
The record, every miss kept: thesimplifier7.com
Questions: DM @TheSimplifier7 on X
Declinazione di responsabilità
Le informazioni e le pubblicazioni non sono intese come, e non costituiscono, consulenza o raccomandazioni finanziarie, di investimento, di trading o di altro tipo fornite o approvate da TradingView. Per ulteriori informazioni, consultare i Termini di utilizzo.
The Fan: 7 days free, then €149.99/month. Cancel before day 7 and pay nothing.
Start the trial: thesimplifier7.com/method.html
The record, every miss kept: thesimplifier7.com
Questions: DM @TheSimplifier7 on X
Start the trial: thesimplifier7.com/method.html
The record, every miss kept: thesimplifier7.com
Questions: DM @TheSimplifier7 on X
Declinazione di responsabilità
Le informazioni e le pubblicazioni non sono intese come, e non costituiscono, consulenza o raccomandazioni finanziarie, di investimento, di trading o di altro tipo fornite o approvate da TradingView. Per ulteriori informazioni, consultare i Termini di utilizzo.