Buy/Sell Signals: SMA + Volume + Trade Profit
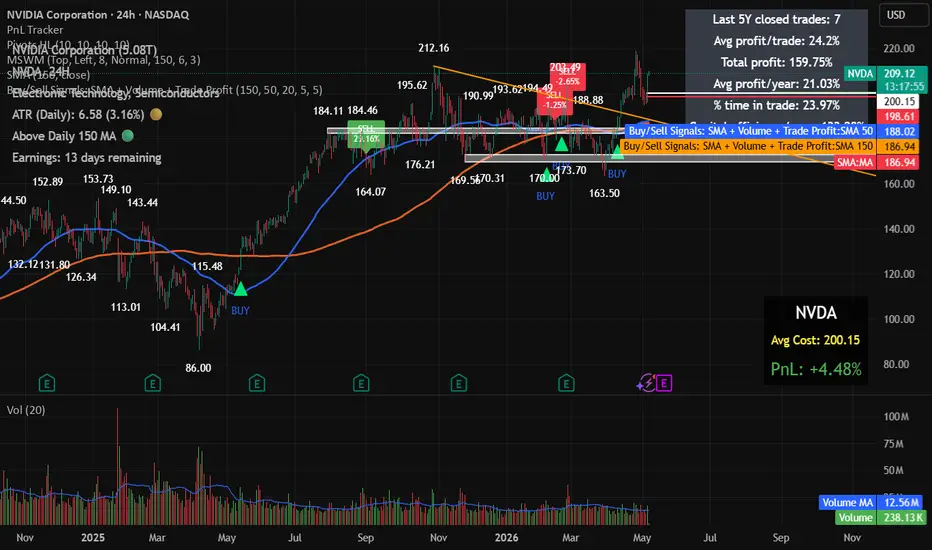
This indicator generates buy and sell signals using SMA 150, SMA 50, candle color, and volume conditions.
A buy signal appears when a green candle closes above the SMA 150, remains within the selected maximum percentage above it, closes above the SMA 50, and has above-average volume.
A sell signal appears on the first candle that closes below the SMA 50 after a buy signal.
The indicator tracks each completed trade and displays the profit/loss percentage on the sell candle. It also includes a summary table showing trade count, average profit, total compounded profit, average yearly profit, time spent in trades, and yearly capital-efficiency adjusted for exposure time.
The checked time period is configurable in years.
A buy signal appears when a green candle closes above the SMA 150, remains within the selected maximum percentage above it, closes above the SMA 50, and has above-average volume.
A sell signal appears on the first candle that closes below the SMA 50 after a buy signal.
The indicator tracks each completed trade and displays the profit/loss percentage on the sell candle. It also includes a summary table showing trade count, average profit, total compounded profit, average yearly profit, time spent in trades, and yearly capital-efficiency adjusted for exposure time.
The checked time period is configurable in years.

Declinazione di responsabilità
Le informazioni e le pubblicazioni non sono intese come, e non costituiscono, consulenza o raccomandazioni finanziarie, di investimento, di trading o di altro tipo fornite o approvate da TradingView. Per ulteriori informazioni, consultare i Termini di utilizzo.
Declinazione di responsabilità
Le informazioni e le pubblicazioni non sono intese come, e non costituiscono, consulenza o raccomandazioni finanziarie, di investimento, di trading o di altro tipo fornite o approvate da TradingView. Per ulteriori informazioni, consultare i Termini di utilizzo.