OPEN-SOURCE SCRIPT
Gravity Trend Levels [BOSWaves]
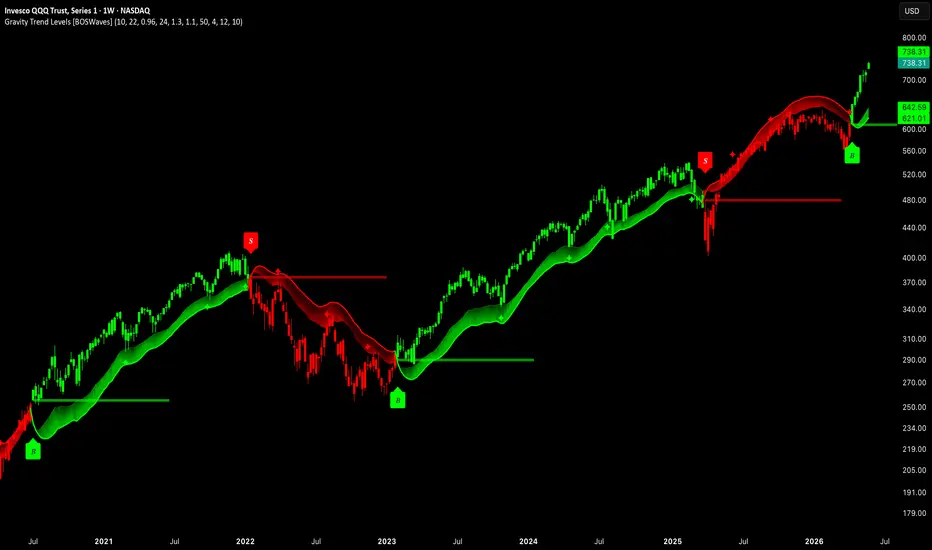
Gravity Trend Levels [BOSWaves] - Acceleration-Derived Gravity Modeling with Adaptive Cloud Trail and Fail Level Projection
Overview
Gravity Trend Levels [BOSWaves] is a momentum acceleration-based trend system that models directional gravity through the normalized rate of change of an EMA-derived velocity measurement, where cloud thickness, trail distance, and trend state are continuously adapted based on whether gravitational pull is building, sustained, or decaying rather than through fixed volatility multipliers or static band thresholds.

Instead of relying on conventional moving average crossovers or ATR-scaled bands that treat all market conditions identically, trend state and cloud positioning are determined by measuring price acceleration relative to MAD-normalized volatility, converting that acceleration into a gravity score that decays exponentially when momentum diminishes and drives adaptive band interpolation between configurable tight and wide trail distances.
This creates a trend framework where the cloud reflects genuine momentum dynamics rather than arbitrary indicator levels. The cloud tightens and hugs price during high gravity periods when acceleration is strong and directional pull is confirmed, expands during gravity decay when momentum is weakening, and generates gravity fail levels at the precise price points where trend state changed, marking the exact locations where prior gravitational force collapsed and direction reversed.
Price is therefore evaluated against a cloud that continuously updates its distance from price based on measured acceleration dynamics, producing a trail that reflects the actual pull state of the current trend rather than applying a uniform band regardless of momentum conditions.
Conceptual Framework
Gravity Trend Levels is founded on the principle that trend confidence should be measured through the acceleration characteristics of price momentum rather than through price position relative to fixed indicators, and that the distance between price and its trailing cloud boundary should dynamically reflect whether momentum is actively pulling price in the trend direction or losing gravitational force.
Traditional trend-following tools apply consistent band distances regardless of whether momentum is surging or stalling, producing identical visual representations for high-conviction and deteriorating trend conditions. This framework replaces uniform band geometry with an acceleration-driven gravity model where band distance shrinks under strong gravitational pull and expands as gravity decays, communicating trend health through cloud behavior rather than requiring separate momentum indicators for context.
Three core principles guide the design:
This shifts trend analysis from static band monitoring into continuous gravitational force measurement where cloud dynamics communicate momentum state and fail levels preserve the structural evidence of prior gravity collapses.
Theoretical Foundation
The indicator combines EMA-based trend baseline construction, MAD volatility measurement, velocity and acceleration derivation from baseline rate of change, gravity scoring with exponential decay, and adaptive trail interpolation that maps pull strength to band distance.
The trend baseline is calculated as an EMA of close over the configured length, providing a smoothed directional reference. Velocity measures the change in baseline over the gravity lookback period, and acceleration measures the bar-to-bar change in velocity. Acceleration is normalized by MAD to produce a dimensionless score that reflects momentum change intensity relative to current volatility. When normalized acceleration exceeds the minimum threshold, gravity is set proportionally to the acceleration reading and capped at a maximum value. When acceleration falls below the threshold, gravity decays multiplicatively by the configured decay rate each bar. Pull converts gravity to a normalized 0-1 range that drives trail multiplier interpolation between the minimum tight distance and the maximum wide distance.
Four internal systems operate in tandem:
This design allows the cloud and trail to respond continuously to gravity dynamics while fail levels accumulate as a historical record of structural gravity collapses.
How It Works
Gravity Trend Levels evaluates price through a sequence of acceleration-aware and gravity-driven processes:
Together, these elements form a continuously updating gravity-driven trend system where cloud dynamics reveal pull strength, fail levels mark structural collapse points, and retest diamonds identify price interactions with the inner cloud boundary throughout the trend.
Interpretation
Gravity Trend Levels should be interpreted as a momentum-gravity conviction system with dynamically adaptive cloud geometry and structural fail level mapping:
Cloud thickness dynamics, fail level locations, and retest diamond positioning collectively provide more information than trend direction alone.
Signal Logic & Visual Cues
Gravity Trend Levels presents two primary trend transition signals alongside continuous cloud retest monitoring:
Retest diamond detection provides continuous secondary monitoring, marking price touches of the cloud inner edge throughout the established trend after the signal buffer period with per-side cooldown enforcement.
Alert generation covers bullish and bearish gravity trend flips and any retest diamond occurrence for systematic monitoring workflows.
Strategy Integration
Gravity Trend Levels fits within momentum-informed and adaptive trend-following approaches:
Technical Implementation Details
Optimal Application Parameters
Timeframe Guidance:
Suggested Baseline Configuration:
These suggested parameters should be used as a baseline; their effectiveness depends on the instrument's momentum characteristics, volatility behavior, and preferred signal frequency, so fine-tuning is expected for optimal performance.
Parameter Calibration Notes
Use the following adjustments to refine behavior without altering the core logic:
Adjustments should be incremental and evaluated across multiple session types rather than isolated market conditions.
Performance Characteristics
High Effectiveness:
Reduced Effectiveness:
Integration Guidelines
Disclaimer
Gravity Trend Levels [BOSWaves] is a professional-grade momentum acceleration and trend conviction analysis tool. It uses acceleration-derived gravity modeling with adaptive cloud construction and structural fail level projection but does not predict future price movements. Results depend on market conditions, instrument momentum characteristics, parameter selection, and disciplined execution. BOSWaves recommends deploying this indicator within a broader analytical framework that incorporates order flow context, volume analysis, and comprehensive risk management.
Overview
Gravity Trend Levels [BOSWaves] is a momentum acceleration-based trend system that models directional gravity through the normalized rate of change of an EMA-derived velocity measurement, where cloud thickness, trail distance, and trend state are continuously adapted based on whether gravitational pull is building, sustained, or decaying rather than through fixed volatility multipliers or static band thresholds.
Instead of relying on conventional moving average crossovers or ATR-scaled bands that treat all market conditions identically, trend state and cloud positioning are determined by measuring price acceleration relative to MAD-normalized volatility, converting that acceleration into a gravity score that decays exponentially when momentum diminishes and drives adaptive band interpolation between configurable tight and wide trail distances.
This creates a trend framework where the cloud reflects genuine momentum dynamics rather than arbitrary indicator levels. The cloud tightens and hugs price during high gravity periods when acceleration is strong and directional pull is confirmed, expands during gravity decay when momentum is weakening, and generates gravity fail levels at the precise price points where trend state changed, marking the exact locations where prior gravitational force collapsed and direction reversed.
Price is therefore evaluated against a cloud that continuously updates its distance from price based on measured acceleration dynamics, producing a trail that reflects the actual pull state of the current trend rather than applying a uniform band regardless of momentum conditions.
Conceptual Framework
Gravity Trend Levels is founded on the principle that trend confidence should be measured through the acceleration characteristics of price momentum rather than through price position relative to fixed indicators, and that the distance between price and its trailing cloud boundary should dynamically reflect whether momentum is actively pulling price in the trend direction or losing gravitational force.
Traditional trend-following tools apply consistent band distances regardless of whether momentum is surging or stalling, producing identical visual representations for high-conviction and deteriorating trend conditions. This framework replaces uniform band geometry with an acceleration-driven gravity model where band distance shrinks under strong gravitational pull and expands as gravity decays, communicating trend health through cloud behavior rather than requiring separate momentum indicators for context.
Three core principles guide the design:
- Gravitational pull should be derived from normalized price acceleration rather than from price position alone, ensuring that cloud behavior reflects actual momentum intensity rather than the mere direction of a smoothed average.
- Cloud thickness and trail distance should adapt continuously to the measured pull state, contracting during strong gravity and expanding during decay to provide a visual representation of trend conviction at all times.
- Gravity fail levels should be projected from the precise price points where trend state changed, marking the locations where gravitational force reversed as permanent structural references for future price interaction.
This shifts trend analysis from static band monitoring into continuous gravitational force measurement where cloud dynamics communicate momentum state and fail levels preserve the structural evidence of prior gravity collapses.
Theoretical Foundation
The indicator combines EMA-based trend baseline construction, MAD volatility measurement, velocity and acceleration derivation from baseline rate of change, gravity scoring with exponential decay, and adaptive trail interpolation that maps pull strength to band distance.
The trend baseline is calculated as an EMA of close over the configured length, providing a smoothed directional reference. Velocity measures the change in baseline over the gravity lookback period, and acceleration measures the bar-to-bar change in velocity. Acceleration is normalized by MAD to produce a dimensionless score that reflects momentum change intensity relative to current volatility. When normalized acceleration exceeds the minimum threshold, gravity is set proportionally to the acceleration reading and capped at a maximum value. When acceleration falls below the threshold, gravity decays multiplicatively by the configured decay rate each bar. Pull converts gravity to a normalized 0-1 range that drives trail multiplier interpolation between the minimum tight distance and the maximum wide distance.
Four internal systems operate in tandem:
- Gravity Detection Engine: Derives velocity from EMA baseline change over the gravity lookback, calculates acceleration as the bar-to-bar velocity change, normalizes against MAD, and updates the gravity state either by setting it proportional to current acceleration or applying exponential decay when acceleration subsides.
- Adaptive Trail Construction: Converts gravity to a normalized pull value and interpolates the trail multiplier between the configured minimum and maximum settings, scaling MAD to produce upper and lower band distances from the baseline that tighten with strong pull and widen with decay.
- Gravity Cloud System: Constructs a one-sided cloud positioned below price in uptrends and above price in downtrends, with cloud thickness scaling proportionally to current pull strength through a separate MAD-scaled thickness calculation that produces a visually dynamic pull indicator.
- Gravity Fail Level Engine: On each trend state switch, projects a horizontal line from the flip bar's low for bullish flips and high for bearish flips, extending forward for the configured projection length to mark the price level where prior gravitational force collapsed and direction changed.
This design allows the cloud and trail to respond continuously to gravity dynamics while fail levels accumulate as a historical record of structural gravity collapses.
How It Works
Gravity Trend Levels evaluates price through a sequence of acceleration-aware and gravity-driven processes:
- Baseline Calculation: EMA smoothing of close over the configured trend length produces the directional reference from which velocity and acceleration are derived.
- MAD Volatility Measurement: Mean Absolute Deviation over the configured length provides the adaptive volatility unit that normalizes acceleration and scales all band and cloud distances.
- Velocity Derivation: The difference between the current baseline and the baseline a configurable number of bars ago provides the velocity reading that captures the rate of directional change in the smoothed trend.
- Acceleration Calculation: The bar-to-bar change in velocity produces the acceleration reading, which captures whether directional momentum is intensifying or diminishing.
- Gravity State Update: Normalized acceleration above the minimum threshold sets gravity proportionally to the acceleration magnitude scaled by eight and capped at two. Below the threshold, gravity decays by multiplying by the configured decay rate each bar.
- Pull Normalization: Gravity is divided by 1.5 and capped at one to produce a normalized pull value that maps the full gravity range to a 0-1 scale for trail interpolation.
- Trail Multiplier Interpolation: The pull value interpolates between the maximum trail distance at zero pull and the minimum trail distance at full pull, producing a continuously adapting multiplier that scales MAD into upper and lower band distances.
- Trend State Logic: Price crossing above the upper band triggers bullish state. Price crossing below the lower band triggers bearish state. State persists until the opposing band is breached.
- Cloud Construction: The active cloud positions at the lower band in uptrends and upper band in downtrends, with an inner boundary offset by a pull-scaled thickness producing a two-edge cloud whose depth visually reflects current gravitational pull.
- Gravity Fail Level Projection: On each trend switch, a horizontal line is projected from the flip bar at the bar's low for bullish flips and high for bearish flips, extending forward for the configured projection length as a structural fail reference.
- Retest Diamond Detection: After the configured signal buffer period from the most recent flip, price touching the cloud inner edge triggers a retest diamond marker with a configurable minimum bar cooldown between consecutive signals on the same side.
Together, these elements form a continuously updating gravity-driven trend system where cloud dynamics reveal pull strength, fail levels mark structural collapse points, and retest diamonds identify price interactions with the inner cloud boundary throughout the trend.
Interpretation
Gravity Trend Levels should be interpreted as a momentum-gravity conviction system with dynamically adaptive cloud geometry and structural fail level mapping:
- Bullish Trend State (Green): Established when price closes above the upper adaptive band, with the gravity cloud positioned below price reflecting the upward gravitational pull state.
- Bearish Trend State (Red): Established when price closes below the lower adaptive band, with the gravity cloud positioned above price reflecting the downward gravitational pull state.
- Gravity Cloud: The one-sided filled zone between the outer and inner cloud boundaries reflects current pull strength through its thickness. A thick cloud indicates strong gravitational pull with high trend conviction. A thin cloud indicates gravity decay and diminishing directional force.
- Cloud Outer Edge: The primary structural boundary of the gravity cloud, positioned at the active adaptive band and colored fully in the trend direction, representing the outer limit of the gravitational field.
- Cloud Inner Edge: The pull-scaled inner boundary of the cloud, representing the nearer edge of the gravitational zone and the threshold for retest diamond detection.
- Gravity Fail Levels: Horizontal lines projected from trend flip bars at the flip bar's low for bullish flips and high for bearish flips, marking the exact price level where prior gravitational force collapsed. These levels persist as structural references for the configured projection length.
- 𝑩 Buy Signals: Green labels appearing below the bar when trend state switches from bearish to bullish, marking the gravity flip bar where upward pull has been established.
- 𝑺 Sell Signals: Red labels appearing above the bar when trend state switches from bullish to bearish, marking the gravity flip bar where downward pull has been established.
- ✦ Retest Diamonds: Small star diamonds plotted below bars during bullish retests and above bars during bearish retests when price touches the cloud inner edge after the signal buffer period, identifying interactions with the gravitational boundary during the trend.
- Colored Candles: Optional bar coloring reflects current trend state direction, providing continuous directional context independent of cloud proximity or signal generation. Note: The original chart candles must be disabled in chart settings for the trend-colored candles to display properly.
Cloud thickness dynamics, fail level locations, and retest diamond positioning collectively provide more information than trend direction alone.
Signal Logic & Visual Cues
Gravity Trend Levels presents two primary trend transition signals alongside continuous cloud retest monitoring:
- Buy Signal (𝑩): Green label appears when trend state switches from bearish to bullish via upper band crossover, indicating gravitational pull has reversed to the upside and a fail level is projected from the flip bar's low.
- Sell Signal (𝑺): Red label appears when trend state switches from bullish to bearish via lower band crossunder, indicating gravitational pull has reversed to the downside and a fail level is projected from the flip bar's high.
Retest diamond detection provides continuous secondary monitoring, marking price touches of the cloud inner edge throughout the established trend after the signal buffer period with per-side cooldown enforcement.
Alert generation covers bullish and bearish gravity trend flips and any retest diamond occurrence for systematic monitoring workflows.
Strategy Integration
Gravity Trend Levels fits within momentum-informed and adaptive trend-following approaches:
- Gravity Flip Entries: Use trend state switches as primary entry triggers where gravitational acceleration has driven price through the adaptive band, entering in the flip direction with the projected fail level providing an immediate structural reference for invalidation.
- Cloud Thickness Conviction Reading: Monitor cloud thickness as a real-time gravity strength gauge. A thick, prominent cloud indicates strong active pull supporting the trend. A thin, contracting cloud warns of gravitational decay and warrants reduced confidence in trend continuation.
- Fail Level Framework: Use gravity fail levels as structural references for subsequent price interaction, monitoring whether price respects or violates the level where prior gravity collapsed to assess the structural significance of the most recent trend change.
- Retest Diamond Re-entry: Treat cloud inner edge retests after the signal buffer period as potential continuation opportunities within the established trend, using the diamond signal as a lower-risk re-entry reference relative to the initial flip signal.
- Cloud Proximity Risk Management: Use the outer cloud edge as a dynamic trailing reference for position management, maintaining directional bias while price remains beyond the cloud and reassessing when price approaches or enters the gravitational zone.
- Multi-Timeframe Gravity Alignment: Apply higher-timeframe gravity trend state as a directional bias filter, engaging with lower-timeframe flip signals only when they align with the established higher-timeframe gravitational direction.
Technical Implementation Details
- Core Engine: EMA baseline with MAD volatility measurement for adaptive scaling
- Gravity Model: Velocity from baseline rate of change, acceleration from velocity change, MAD normalization, proportional gravity setting with exponential decay
- Adaptive Trail: Pull-normalized interpolation between configurable minimum and maximum MAD multipliers
- Cloud Construction: One-sided pull-scaled thickness fill between outer and inner boundaries with EMA smoothing on both edges
- Fail Levels: Flip-triggered horizontal line projection from bar extreme at configurable length and width
- Retest System: Inner cloud edge proximity detection with signal buffer and per-side cooldown enforcement
- Visualization: Gravity cloud fill, fail level lines, trend flip labels, retest diamond markers, and optional trend candle coloring
- Performance Profile: Optimized for real-time execution across all timeframes with stateful gravity variable maintaining continuous decay between acceleration events
Optimal Application Parameters
Timeframe Guidance:
- 1 - 5 min: Intraday gravity tracking for scalping with shorter trend length and gravity lookback for faster acceleration detection and responsive cloud behavior
- 15 - 60 min: Session-level trend identification with balanced gravity decay and moderate trail settings for reliable intraday directional framing
- 4H - Daily: Swing-level gravity trend mapping with longer trend length and higher decay rate for sustained gravitational pull persistence across multi-session moves
Suggested Baseline Configuration:
- Trend Length: 14
- Gravity Lookback: 19
- Gravity Decay: 0.96
- MAD Length: 24
- Trail Min (Strong Pull): 1.0
- Trail Max (Weak Pull): 1.0
- Show Gravity Cloud: Enabled
- Show Gravity Fail Levels: Enabled
- Show Buy/Sell Signals: Enabled
- Retest Diamonds: Enabled
- Color Bars: Enabled (requires disabling original chart candles in chart settings)
These suggested parameters should be used as a baseline; their effectiveness depends on the instrument's momentum characteristics, volatility behavior, and preferred signal frequency, so fine-tuning is expected for optimal performance.
Parameter Calibration Notes
Use the following adjustments to refine behavior without altering the core logic:
- Cloud too wide throughout: Decrease Trail Max to reduce band distance during low gravity periods, bringing the cloud closer to price during momentum decay phases.
- Cloud too tight throughout: Increase Trail Max to allow greater band expansion during gravity decay, producing a more visually prominent cloud separation during low-conviction conditions.
- Gravity builds too slowly: Decrease Gravity Lookback toward 5 for a shorter velocity measurement window that captures acceleration shifts more rapidly, producing faster gravity activation on momentum changes.
- Gravity activates too frequently: Increase Gravity Lookback to smooth the velocity measurement across more bars, requiring more sustained directional change before acceleration registers as gravitational pull.
- Gravity decays too quickly: Increase Gravity Decay toward 0.99 to sustain gravitational pull longer between acceleration events, maintaining cloud contraction for more bars after acceleration subsides.
- Gravity lingers too long: Decrease Gravity Decay toward 0.80 for faster pull dissipation, allowing the cloud to expand more quickly when momentum weakens and reducing lag between gravity collapse and visual cloud response.
- Too many retest diamonds: Increase Retest Cooldown to enforce greater bar separation between consecutive diamond markers, or increase Signal Buffer Period to delay retest detection further from each flip event.
Adjustments should be incremental and evaluated across multiple session types rather than isolated market conditions.
Performance Characteristics
High Effectiveness:
- Trending markets with clear momentum phases where gravitational acceleration builds and sustains across multiple bars, producing thick, persistent clouds that visually confirm directional pull throughout the move
- Instruments with consistent volatility behavior where MAD normalization accurately calibrates acceleration significance and cloud distance across varying market conditions
- Momentum continuation strategies where cloud retest diamonds identify lower-risk re-entry points within established gravity trends after the initial flip signal
- Structural reference frameworks where gravity fail levels provide meaningful historical markers at the exact price points where prior directional momentum collapsed
Reduced Effectiveness:
- Choppy, low-momentum markets where acceleration readings oscillate without sustained directional pull, producing frequent gravity flips and thin clouds that fail to establish meaningful directional framing
- Extremely volatile environments where individual bar acceleration spikes generate momentary gravity readings that decay before producing sustained cloud contraction or reliable trend state persistence
- News-driven or gap-heavy instruments where instantaneous momentum changes trigger gravity activation and immediate flip signals without the gradual acceleration buildup the model is designed to detect
- Consolidation and sideways conditions where velocity and acceleration remain near zero, preventing meaningful gravity generation and causing the cloud to remain in its expanded low-pull state without directional conviction
- Mean-reversion dominant markets where band crossovers trigger frequent state changes that repeatedly project fail levels without the subsequent directional follow-through that validates their structural significance
Integration Guidelines
- Confluence: Combine with BOSWaves order flow tools, volume analysis, or structural indicators to validate gravity flip signals with participation context before committing to directional positions
- Cloud Thickness Monitoring: Track cloud thickness evolution throughout the trend as an ongoing gravity health assessment. Consistently thick clouds support continuation confidence while progressive thinning signals approaching decay and warrants defensive position management.
- Fail Level Awareness: Monitor price behavior when it returns to prior gravity fail levels. These levels mark the exact prices where directional force previously collapsed, making them structurally meaningful references for future support, resistance, or reversal reactions.
- Decay Anticipation: Use cloud thinning as an early warning of approaching gravity decay before a formal flip signal is generated. Thinning during an extended trend suggests acceleration is subsiding and the probability of a state change is increasing.
- State Discipline: Maintain directional bias aligned with current gravity trend state until a confirmed band crossover flip occurs. Cloud retests and fail level interactions within an established trend do not constitute state changes and should be interpreted as continuation context rather than reversal signals.
Disclaimer
Gravity Trend Levels [BOSWaves] is a professional-grade momentum acceleration and trend conviction analysis tool. It uses acceleration-derived gravity modeling with adaptive cloud construction and structural fail level projection but does not predict future price movements. Results depend on market conditions, instrument momentum characteristics, parameter selection, and disciplined execution. BOSWaves recommends deploying this indicator within a broader analytical framework that incorporates order flow context, volume analysis, and comprehensive risk management.
Script open-source
Nello spirito di TradingView, l'autore di questo script lo ha reso open source, in modo che i trader possano esaminarne e verificarne la funzionalità. Complimenti all'autore! Sebbene sia possibile utilizzarlo gratuitamente, ricordiamo che la ripubblicazione del codice è soggetta al nostro Regolamento.

Declinazione di responsabilità
Le informazioni e le pubblicazioni non sono intese come, e non costituiscono, consulenza o raccomandazioni finanziarie, di investimento, di trading o di altro tipo fornite o approvate da TradingView. Per ulteriori informazioni, consultare i Termini di utilizzo.
Script open-source
Nello spirito di TradingView, l'autore di questo script lo ha reso open source, in modo che i trader possano esaminarne e verificarne la funzionalità. Complimenti all'autore! Sebbene sia possibile utilizzarlo gratuitamente, ricordiamo che la ripubblicazione del codice è soggetta al nostro Regolamento.
Declinazione di responsabilità
Le informazioni e le pubblicazioni non sono intese come, e non costituiscono, consulenza o raccomandazioni finanziarie, di investimento, di trading o di altro tipo fornite o approvate da TradingView. Per ulteriori informazioni, consultare i Termini di utilizzo.