OPEN-SOURCE SCRIPT
ADX with Trend/Range Zone Bands
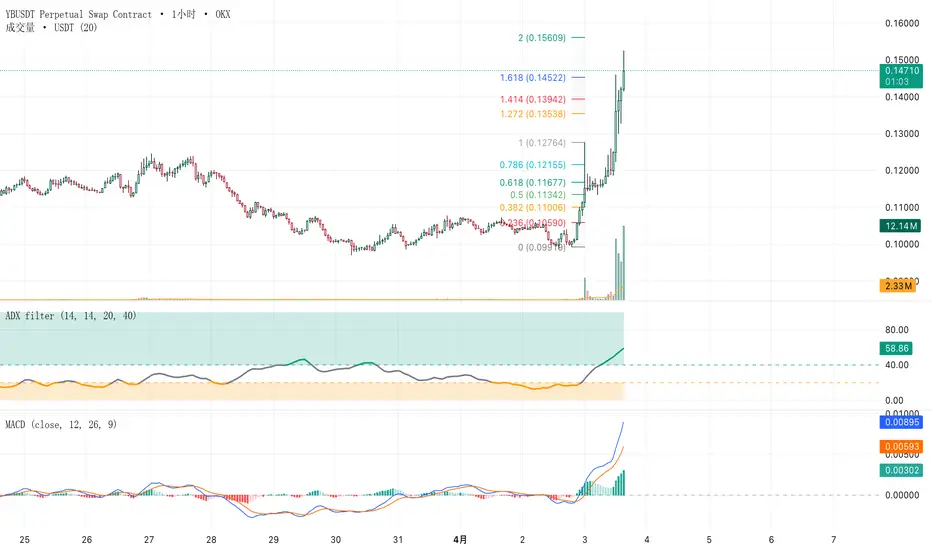
ADX with Trend/Range Zone Bands
This is an enhanced version of the classic Average Directional Index (ADX) indicator, designed to help traders instantly identify whether the market is **trending** or **ranging** — without any ambiguity.
**🔍 What's New**
- **Color-coded ADX line** — turns teal in trending markets, orange in ranging markets, and gray in transitional zones
- **Fixed zone bands** — two always-visible shaded regions define the range and trend areas at a glance
- **Dynamic background highlight** — the chart background changes color when ADX enters a confirmed zone
- **Fully customizable** — adjust the lower band (range threshold), upper band (trend confirmation), and zone colors to fit your trading style
**📊 How to Read It**
| ADX Value | Zone | Interpretation |
|---|---|---|
| Below Lower Band (default 20) | 🟠 Orange | Ranging market — avoid trend-following entries |
| Between bands (20–40) | ⬜ Gray | Transitional — proceed with caution |
| Above Upper Band (default 40) | 🟢 Teal | Strong trend — favor momentum strategies |
**💡 Best Used For**
- Futures & crypto derivatives traders who need quick market condition reads
- Filtering signals from trend-following systems (MA crossovers, breakouts)
- Avoiding false breakouts during low-ADX consolidation phases
*Works on all timeframes and asset classes.*
---
ADX 趋势/震荡区间可视化指标
本指标在经典 ADX 的基础上进行增强,通过**直观的色带与变色曲线**,帮助交易者在第一时间判断当前市场处于**趋势行情**还是**震荡行情**,无需反复猜测。
**🔍 新增功能**
- **ADX 曲线动态变色** —— 趋势行情显示蓝绿色,震荡行情显示橙色,过渡区显示灰色
- **固定区间色带** —— 两个常驻阴影区域,随时标注震荡区与趋势区的边界,一目了然
- **动态背景高亮** —— 当 ADX 进入确认区间时,图表背景自动切换颜色,强化视觉提示
- **参数完全可调** —— 震荡上限、趋势确认线、色带颜色均可自定义,适配不同交易风格
**📊 如何读图**
| ADX 数值 | 区间 | 行情判断 |
|---|---|---|
| 低于震荡上限(默认 20) | 🟠 橙色区 | 震荡市 —— 避免追趋势单,适合区间策略 |
| 介于两线之间(20–40) | ⬜ 灰色过渡 | 趋势形成中 —— 轻仓观望,等待确认 |
| 高于趋势确认线(默认 40) | 🟢 蓝绿区 | 强趋势市 —— 顺势持仓,适当放宽止损 |
**💡 适用场景**
- 加密货币合约、期货交易者快速判断市场状态
- 过滤均线交叉、突破等趋势信号,避免震荡期频繁被套
- 结合其他指标使用,在强趋势区间内提高入场胜率
*适用于所有时间周期与交易品种。*
This is an enhanced version of the classic Average Directional Index (ADX) indicator, designed to help traders instantly identify whether the market is **trending** or **ranging** — without any ambiguity.
**🔍 What's New**
- **Color-coded ADX line** — turns teal in trending markets, orange in ranging markets, and gray in transitional zones
- **Fixed zone bands** — two always-visible shaded regions define the range and trend areas at a glance
- **Dynamic background highlight** — the chart background changes color when ADX enters a confirmed zone
- **Fully customizable** — adjust the lower band (range threshold), upper band (trend confirmation), and zone colors to fit your trading style
**📊 How to Read It**
| ADX Value | Zone | Interpretation |
|---|---|---|
| Below Lower Band (default 20) | 🟠 Orange | Ranging market — avoid trend-following entries |
| Between bands (20–40) | ⬜ Gray | Transitional — proceed with caution |
| Above Upper Band (default 40) | 🟢 Teal | Strong trend — favor momentum strategies |
**💡 Best Used For**
- Futures & crypto derivatives traders who need quick market condition reads
- Filtering signals from trend-following systems (MA crossovers, breakouts)
- Avoiding false breakouts during low-ADX consolidation phases
*Works on all timeframes and asset classes.*
---
ADX 趋势/震荡区间可视化指标
本指标在经典 ADX 的基础上进行增强,通过**直观的色带与变色曲线**,帮助交易者在第一时间判断当前市场处于**趋势行情**还是**震荡行情**,无需反复猜测。
**🔍 新增功能**
- **ADX 曲线动态变色** —— 趋势行情显示蓝绿色,震荡行情显示橙色,过渡区显示灰色
- **固定区间色带** —— 两个常驻阴影区域,随时标注震荡区与趋势区的边界,一目了然
- **动态背景高亮** —— 当 ADX 进入确认区间时,图表背景自动切换颜色,强化视觉提示
- **参数完全可调** —— 震荡上限、趋势确认线、色带颜色均可自定义,适配不同交易风格
**📊 如何读图**
| ADX 数值 | 区间 | 行情判断 |
|---|---|---|
| 低于震荡上限(默认 20) | 🟠 橙色区 | 震荡市 —— 避免追趋势单,适合区间策略 |
| 介于两线之间(20–40) | ⬜ 灰色过渡 | 趋势形成中 —— 轻仓观望,等待确认 |
| 高于趋势确认线(默认 40) | 🟢 蓝绿区 | 强趋势市 —— 顺势持仓,适当放宽止损 |
**💡 适用场景**
- 加密货币合约、期货交易者快速判断市场状态
- 过滤均线交叉、突破等趋势信号,避免震荡期频繁被套
- 结合其他指标使用,在强趋势区间内提高入场胜率
*适用于所有时间周期与交易品种。*
Script open-source
Nello spirito di TradingView, l'autore di questo script lo ha reso open source, in modo che i trader possano esaminarne e verificarne la funzionalità. Complimenti all'autore! Sebbene sia possibile utilizzarlo gratuitamente, ricordiamo che la ripubblicazione del codice è soggetta al nostro Regolamento.

Declinazione di responsabilità
Le informazioni e le pubblicazioni non sono intese come, e non costituiscono, consulenza o raccomandazioni finanziarie, di investimento, di trading o di altro tipo fornite o approvate da TradingView. Per ulteriori informazioni, consultare i Termini di utilizzo.
Script open-source
Nello spirito di TradingView, l'autore di questo script lo ha reso open source, in modo che i trader possano esaminarne e verificarne la funzionalità. Complimenti all'autore! Sebbene sia possibile utilizzarlo gratuitamente, ricordiamo che la ripubblicazione del codice è soggetta al nostro Regolamento.
Declinazione di responsabilità
Le informazioni e le pubblicazioni non sono intese come, e non costituiscono, consulenza o raccomandazioni finanziarie, di investimento, di trading o di altro tipo fornite o approvate da TradingView. Per ulteriori informazioni, consultare i Termini di utilizzo.