OPEN-SOURCE SCRIPT
Buy/Sell Volume Pressure
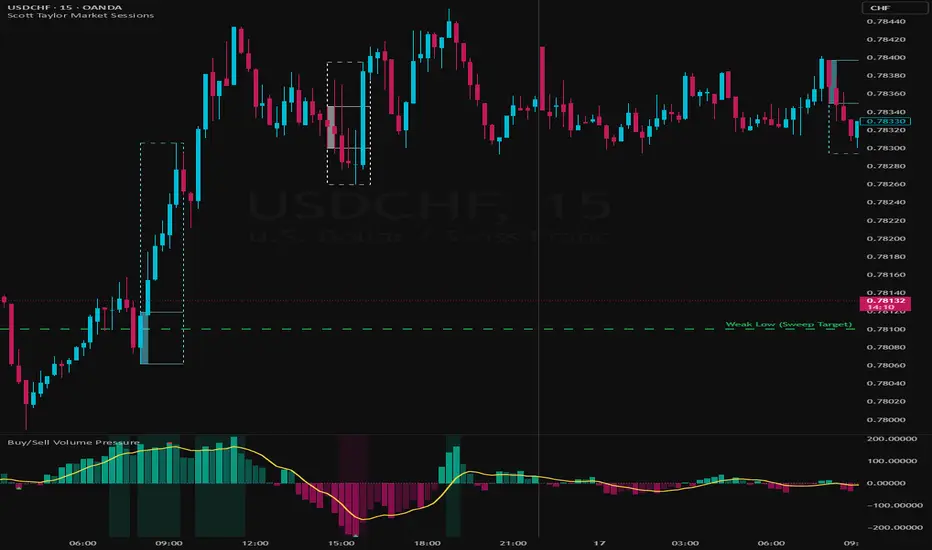

 GBPJPY 1. Overview
The Buy/Sell Volume Pressure indicator is a sophisticated volume-analysis tool designed to reveal the hidden tug-of-war between buyers and sellers. Unlike standard volume bars that only show total activity, this indicator decomposes every candle into its constituent buying and selling components based on price action within the bar (wick-to-body ratio). It provides a smoothed, oscillator-style histogram that identifies trend strength, exhaustion points, and high-probability reversals.
2. Key Features & Calculations
Wick-Based Pressure Estimation: Uses a precise calculation to determine volume distribution. It analyzes where the close sits relative to the high and low. A close near the high attributes more volume to "Buying Pressure," while a close near the low attributes it to "Selling Pressure."
Non-Repainting Multi-Timeframe (HTF) Support: Includes a built-in HTF toggle that allows you to view volume pressure from higher timeframes (e.g., Daily pressure on a 15m chart). Uses the industry-standard [1] offset to ensure data is confirmed and never repaints.
Volume Filter for Accuracy: An optional filter that only validates signals when volume is above its 20-period moving average, ensuring you aren't misled by "low-liquidity noise."
Extreme Zone Detection: Dynamically calculates overbought and oversold "Extreme Zones" based on recent historical ranges, highlighting areas where the trend may be overextended.
WMA Smoothing: Incorporates a Weighted Moving Average (WMA) to provide a clearer trend direction and reduce histogram volatility.
Price-Confirmed Divergences: Automatically detects Bullish and Bearish divergences between price and volume pressure, filtered by swing-point confirmation for higher reliability.
3. How to Use for Trading
Signal Interpretation
Teal Histogram Rising Buyers in control — trend confirmation
Maroon Histogram Falling Sellers dominating — trend confirmation
Zero-Line Cross (→ Positive) Momentum shift — potential long entry
Bullish Divergence (🟢) Price lower low + Pressure higher low = Selling exhaustion
Bearish Divergence (🔴) Price higher high + Pressure lower high = Buying exhaustion
Extreme Zone Highlight Market overextended — watch for reversal patterns
4. Input Parameters
Core Settings
Lookback Period: SMA length to smooth the raw buy/sell difference
Divergence Swing Lookback: Sensitivity of pivot points for divergence detection
Higher Timeframe: Overlay higher-level volume trends (1H, 4H, D, etc.)
Accuracy Improvements
Volume Filter: Only validate signals above average volume
Avg Volume Length: Period for calculating average volume
Visual & Smoothing
WMA Smoothing: Toggle the yellow Weighted Moving Average line
Threshold %: Adjusts how "extreme" the zones must be (top/bottom % of recent range)
5. Alerts Available
Zero-Line Crosses — Momentum shift notifications
Divergence Detections — Bullish/Bearish divergence alerts
Extreme Zone Entry/Exit — When pressure enters/leaves overbought/oversold zones
Script open-source
Nello spirito di TradingView, l'autore di questo script lo ha reso open source, in modo che i trader possano esaminarne e verificarne la funzionalità. Complimenti all'autore! Sebbene sia possibile utilizzarlo gratuitamente, ricordiamo che la ripubblicazione del codice è soggetta al nostro Regolamento.

Declinazione di responsabilità
Le informazioni e le pubblicazioni non sono intese come, e non costituiscono, consulenza o raccomandazioni finanziarie, di investimento, di trading o di altro tipo fornite o approvate da TradingView. Per ulteriori informazioni, consultare i Termini di utilizzo.
Script open-source
Nello spirito di TradingView, l'autore di questo script lo ha reso open source, in modo che i trader possano esaminarne e verificarne la funzionalità. Complimenti all'autore! Sebbene sia possibile utilizzarlo gratuitamente, ricordiamo che la ripubblicazione del codice è soggetta al nostro Regolamento.
Declinazione di responsabilità
Le informazioni e le pubblicazioni non sono intese come, e non costituiscono, consulenza o raccomandazioni finanziarie, di investimento, di trading o di altro tipo fornite o approvate da TradingView. Per ulteriori informazioni, consultare i Termini di utilizzo.