Trend Vector Momentum
Trend Vector Momentum
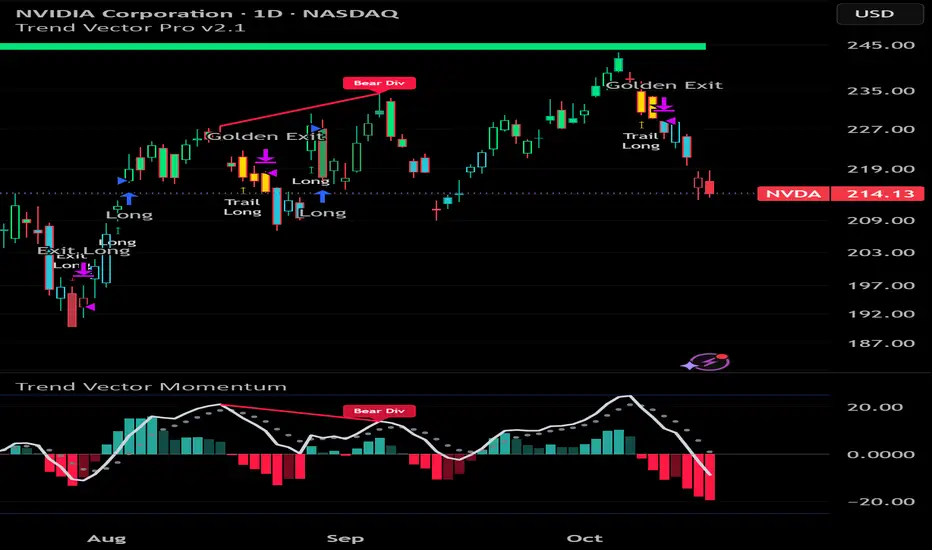
Trend Vector Momentum is a double-smoothed momentum oscillator with a signal line, an energy histogram and automatic divergence detection. It is the companion indicator of the Trend Vector Pro strategy and uses exactly the same momentum calculation, so the two scripts always agree.
━━━━━━━━━━━━━━━━━━━━
1. HOW IT IS CALCULATED
━━━━━━━━━━━━━━━━━━━━
━━━━━━━━━━━━━━━━━━━━
2. HOW TO READ IT
━━━━━━━━━━━━━━━━━━━━
━━━━━━━━━━━━━━━━━━━━
3. DIVERGENCES
━━━━━━━━━━━━━━━━━━━━
Divergences are detected automatically on the momentum pivots:
Filters that remove most false signals:
Divergence lines and labels are drawn in the momentum pane and, optionally, on the price chart as well ("Also Draw on Price Chart").
━━━━━━━━━━━━━━━━━━━━
4. ALERTS
━━━━━━━━━━━━━━━━━━━━
Create Alert → Condition: Trend Vector Momentum → choose the alert.
━━━━━━━━━━━━━━━━━━━━
5. USING IT WITH TREND VECTOR PRO
━━━━━━━━━━━━━━━━━━━━
Trend Vector Pro colors the bars, shows the Bullish / Bearish trend banner and manages trades. Trend Vector Momentum shows the strength behind those moves:
━━━━━━━━━━━━━━━━━━━━
SETTINGS
━━━━━━━━━━━━━━━━━━━━
Indicator Line Length (32), Smooth (5), Signal Line (5), Histogram Scale (2), Reference Lines (25), divergence options and all colors can be changed in the settings. Works on any symbol and timeframe.
What makes it different from the built-in TSI
The momentum line is based on the True Strength Index concept by William Blau. This script adds:
Limitations
Divergences are confirmed 5 bars after the pivot, so they appear with a delay (they do not repaint). Momentum can stay extreme for a long time in strong trends, and a divergence is a warning, not a signal to trade against the trend on its own.
Disclaimer: this script is for educational purposes only and is not financial advice. Always combine it with your own analysis and risk management.
Trend Vector Momentum is a double-smoothed momentum oscillator with a signal line, an energy histogram and automatic divergence detection. It is the companion indicator of the Trend Vector Pro strategy and uses exactly the same momentum calculation, so the two scripts always agree.
━━━━━━━━━━━━━━━━━━━━
1. HOW IT IS CALCULATED
━━━━━━━━━━━━━━━━━━━━
- Fast Momentum line (solid): a True Strength Index of the close. The bar-to-bar price change is smoothed twice with EMAs (32, then 5) and divided by the same double smoothing of the absolute change, scaled to ±100. This removes most of the noise while staying responsive.
- Slow Momentum line (dotted): a 5-bar EMA of the fast line.
- Histogram: the distance between the fast and slow lines (×2). It shows the energy behind the move: tall bars mean momentum is accelerating, shrinking bars mean it is fading.
- Reference lines (±25): scale guides only. No signals are taken from them.
━━━━━━━━━━━━━━━━━━━━
2. HOW TO READ IT
━━━━━━━━━━━━━━━━━━━━
- Above zero: buyers in control. Below zero: sellers in control.
- Fast line crossing the slow line: an early sign that momentum is turning.
- Histogram color: green above zero, red below zero. Bright = momentum growing, faded = momentum fading.
- Zero-line cross: confirms a change in the dominant side.
- Extreme readings (beyond ±25) show a stretched move. Watch for fading histogram bars there.
━━━━━━━━━━━━━━━━━━━━
3. DIVERGENCES
━━━━━━━━━━━━━━━━━━━━
Divergences are detected automatically on the momentum pivots:
- Bearish divergence: price makes a higher high while momentum makes a lower high (above zero).
- Bullish divergence: price makes a lower low while momentum makes a higher low (below zero).
Filters that remove most false signals:
- Confirm with Momentum Turn: a divergence is shown only if the fast line is already turning in the expected direction.
- Max Bars Between Pivots (60): pivots that are too far apart are not compared.
- Pivot Lookback (5): a pivot is confirmed 5 bars after it forms, so the signal does not repaint.
Divergence lines and labels are drawn in the momentum pane and, optionally, on the price chart as well ("Also Draw on Price Chart").
━━━━━━━━━━━━━━━━━━━━
4. ALERTS
━━━━━━━━━━━━━━━━━━━━
- Bearish Divergence
- Bullish Divergence
- Momentum Above Zero
- Momentum Below Zero
Create Alert → Condition: Trend Vector Momentum → choose the alert.
━━━━━━━━━━━━━━━━━━━━
5. USING IT WITH TREND VECTOR PRO
━━━━━━━━━━━━━━━━━━━━
Trend Vector Pro colors the bars, shows the Bullish / Bearish trend banner and manages trades. Trend Vector Momentum shows the strength behind those moves:
- Take entries when the bar colors turn bullish and momentum is rising.
- Be careful when the bars are still green but the histogram is fading or a bearish divergence appears.
- If both scripts draw divergences on the price chart, turn one of them off to avoid duplicate lines.
━━━━━━━━━━━━━━━━━━━━
SETTINGS
━━━━━━━━━━━━━━━━━━━━
Indicator Line Length (32), Smooth (5), Signal Line (5), Histogram Scale (2), Reference Lines (25), divergence options and all colors can be changed in the settings. Works on any symbol and timeframe.
What makes it different from the built-in TSI
The momentum line is based on the True Strength Index concept by William Blau. This script adds:
- An energy histogram (fast minus slow line) whose color shows whether momentum is growing or fading.
- Automatic bullish / bearish divergence detection with two filters: confirmation by a momentum turn, and a maximum distance between pivots.
- Divergence lines and labels drawn on the price chart as well as in the momentum pane.
- Ready-made alerts for divergences and zero-line crosses.
- The same calculation as the Trend Vector Pro strategy, so both scripts stay in sync.
Limitations
Divergences are confirmed 5 bars after the pivot, so they appear with a delay (they do not repaint). Momentum can stay extreme for a long time in strong trends, and a divergence is a warning, not a signal to trade against the trend on its own.
Disclaimer: this script is for educational purposes only and is not financial advice. Always combine it with your own analysis and risk management.

Declinazione di responsabilità
Le informazioni e le pubblicazioni non sono intese come, e non costituiscono, consulenza o raccomandazioni finanziarie, di investimento, di trading o di altro tipo fornite o approvate da TradingView. Per ulteriori informazioni, consultare i Termini di utilizzo.
Declinazione di responsabilità
Le informazioni e le pubblicazioni non sono intese come, e non costituiscono, consulenza o raccomandazioni finanziarie, di investimento, di trading o di altro tipo fornite o approvate da TradingView. Per ulteriori informazioni, consultare i Termini di utilizzo.