Aggiornato
Ultimate Bull Score - Multi-Factor Bullish Stock Scanner
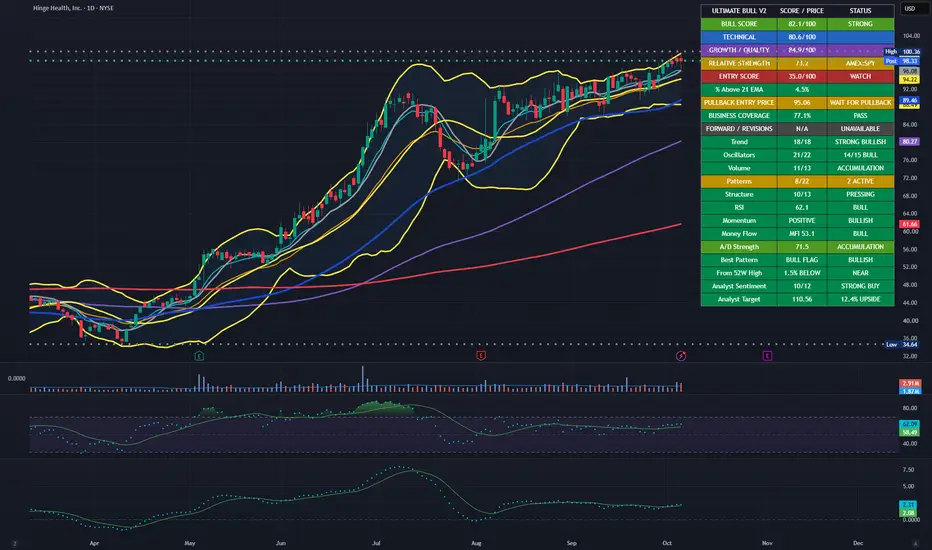
Ultimate Bull Score is a multi-factor technical analysis indicator designed to measure the overall bullish strength of a stock using a single 0–100 Bull Score.
Rather than relying on one indicator or chart pattern, Ultimate Bull Score evaluates multiple categories of bullish evidence simultaneously, including:
Trend Strength — moving-average alignment, price position, and trend direction
Momentum & Oscillators — RSI, MACD, Stochastic, Stochastic RSI, CCI, MFI, ROC, Williams %R, PPO, TSI, Ultimate Oscillator, Chaikin Money Flow, Aroon, and related momentum conditions
Volume & Accumulation — relative volume, OBV behavior, and buying-volume characteristics
Bullish Chart Patterns — searches for structures including Bull Flags, Cup & Handle, Ascending Triangles, Falling Wedges, Double Bottoms, Flat Bases, Rounded Bottoms, VCP-style contractions, volatility coils, and breakout/retest setups
Price Structure — higher highs, higher lows, resistance pressure, breakouts, support behavior, and proximity to 52-week highs
Analyst Sentiment — when analyst data is available, incorporates consensus recommendations and potential upside to the average analyst price target
These factors are combined into one easy-to-read Bull Score from 0 to 100.
Score Guide
90–100 — Excellent Bullish Setup
Strong agreement across multiple bullish factors.
75–89 — Strong Bullish Setup
A high-quality setup with substantial bullish confirmation.
60–74 — Bullish
Positive overall conditions, although some confirmation may still be missing.
Below 60 — Weak / Incomplete Setup
Bullish factors are limited or conflicting.
The dashboard breaks the total score into its individual components, making it possible to see whether a stock's strength is coming from trend, oscillators, volume, chart patterns, price structure, or analyst sentiment.
Ultimate Bull Score is also designed for use with Pine Screener, exposing numeric outputs that can be filtered and sorted to help identify the strongest setups in a watchlist or stock universe.
Important: This indicator is intended as a research and screening tool. A high Bull Score does not guarantee that a security will rise. Technical conditions can change rapidly, and the indicator should be used alongside appropriate risk management and independent research.
Rather than relying on one indicator or chart pattern, Ultimate Bull Score evaluates multiple categories of bullish evidence simultaneously, including:
Trend Strength — moving-average alignment, price position, and trend direction
Momentum & Oscillators — RSI, MACD, Stochastic, Stochastic RSI, CCI, MFI, ROC, Williams %R, PPO, TSI, Ultimate Oscillator, Chaikin Money Flow, Aroon, and related momentum conditions
Volume & Accumulation — relative volume, OBV behavior, and buying-volume characteristics
Bullish Chart Patterns — searches for structures including Bull Flags, Cup & Handle, Ascending Triangles, Falling Wedges, Double Bottoms, Flat Bases, Rounded Bottoms, VCP-style contractions, volatility coils, and breakout/retest setups
Price Structure — higher highs, higher lows, resistance pressure, breakouts, support behavior, and proximity to 52-week highs
Analyst Sentiment — when analyst data is available, incorporates consensus recommendations and potential upside to the average analyst price target
These factors are combined into one easy-to-read Bull Score from 0 to 100.
Score Guide
90–100 — Excellent Bullish Setup
Strong agreement across multiple bullish factors.
75–89 — Strong Bullish Setup
A high-quality setup with substantial bullish confirmation.
60–74 — Bullish
Positive overall conditions, although some confirmation may still be missing.
Below 60 — Weak / Incomplete Setup
Bullish factors are limited or conflicting.
The dashboard breaks the total score into its individual components, making it possible to see whether a stock's strength is coming from trend, oscillators, volume, chart patterns, price structure, or analyst sentiment.
Ultimate Bull Score is also designed for use with Pine Screener, exposing numeric outputs that can be filtered and sorted to help identify the strongest setups in a watchlist or stock universe.
Important: This indicator is intended as a research and screening tool. A high Bull Score does not guarantee that a security will rise. Technical conditions can change rapidly, and the indicator should be used alongside appropriate risk management and independent research.
Note di rilascio
Updated Money Flow StatusNote di rilascio
Updated chart designationsNote di rilascio
Normalized scoring systemNote di rilascio
Bull Scanner v2 — Release NotesPreserved the original technical core: trend calculations, 15 oscillator checks, ten pattern detectors, volume scoring, A/D Strength, and analyst diagnostics.
Added Growth / Quality: revenue growth, EPS improvement, profitability, free cash flow, and valuation relative to growth.
Added risk deductions: overextension, rapid price surges, weakening momentum, slowing revenue, deteriorating cash flow, and expensive valuation with weak growth.
Renamed Early Bull to Entry Score: the calculation remains unchanged and favors newly improving, relatively unextended setups.
Added Pullback Entry Price: a technical watch level near the rising 21 EMA, with statuses for waiting, nearing the entry area, or needing a reclaim.
Simplified extension display: “% Above 21 EMA” uses green, amber, or red.
Restored the colorful dashboard: new scores appear above the original details; allocation labels are removed.
Added scannable components: scores, risk deductions, pullback price, data coverage, and setup flags.
Use: Daily charts and the Pine Screener’s 1-day timeframe.
Limitations: Forward growth and estimate revisions remain unavailable. Missing business data is disclosed through coverage. Pullback prices move with the chart and are not automatic buy signals. TradingView compilation and live scanning remain unverified.
Note di rilascio
cleaned up presentationNote di rilascio
Added pullback entry price
Declinazione di responsabilità
Le informazioni e le pubblicazioni non sono intese come, e non costituiscono, consulenza o raccomandazioni finanziarie, di investimento, di trading o di altro tipo fornite o approvate da TradingView. Per ulteriori informazioni, consultare i Termini di utilizzo.
Declinazione di responsabilità
Le informazioni e le pubblicazioni non sono intese come, e non costituiscono, consulenza o raccomandazioni finanziarie, di investimento, di trading o di altro tipo fornite o approvate da TradingView. Per ulteriori informazioni, consultare i Termini di utilizzo.