OPEN-SOURCE SCRIPT
Aggiornato Volume accumulation distribution dashboard
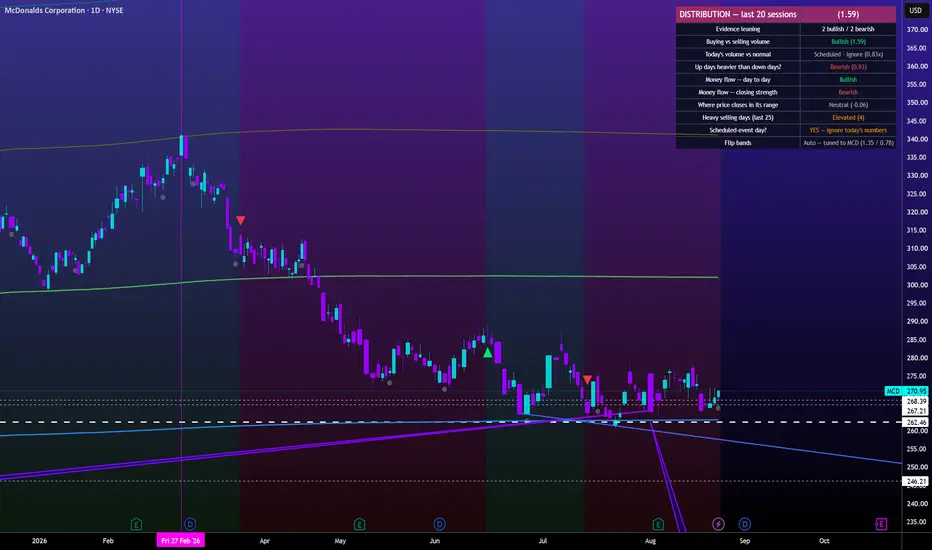
# Volume Evidence Dashboard — A Complete Guide
## What this is
Most volume indicators give you a squiggly line and leave you to interpret it. This one reads the volume for you and **writes the answer in plain English** — Bullish, Bearish, or Neutral, row by row — with a background color that tells you at a glance whether recent trading has been accumulation (buyers in control) or distribution (sellers in control).
It is a **reading aid for your own judgment**, not a buy/sell signal generator. It tells you who has been winning the volume war. You decide what to do about it.
**One thing to understand up front:** this tool looks *backward*. It reports what already happened over the recent past. It is a rearview mirror, not a windshield. Used that way, it's honest and useful. Expecting it to predict the next move is the one way to misuse it.
---
## The 10-second read
When you load it, look at two things:
1. **The background color.** Green = the recent tape was accumulation. Red = distribution. No color = contested, no clear winner.
2. **The top line of the table.** It states the current regime in words: "ACCUMULATION — last 20 sessions" or "DISTRIBUTION — last 20 sessions."
That's the headline. Everything else is the finer detail behind it.
---
## The background color, explained
The tool looks at the last 20 sessions and asks one question: **did up-day volume or down-day volume dominate?**
- **Green** — up-day volume won. Buyers were more aggressive. Accumulation.
- **Red** — down-day volume won. Sellers were more aggressive. Distribution.
- **No color** — neither side clearly dominated.
Two important properties:
- **It never repaints.** Each day is painted with that day's verdict and stays that way forever. The tool will never quietly rewrite its own history to look smarter — a trap many indicators fall into.
- **It confirms turns late — on purpose.** Because it averages 20 sessions, it typically flips a few weeks *after* the actual bottom or top. This is the cost of a clean signal that doesn't flip-flop on every wiggle. If you want to catch the exact low, this is the wrong tool. If you want to know which side has controlled the last month without second-guessing every candle, this is built for it.
When the regime flips, a small **green triangle** (turned accumulation) or **red triangle** (turned distribution) marks the exact bar.
---
## The dashboard table, row by row
Each row interprets itself. The colored word is the verdict; the number in parentheses is the raw value for when you want it.
**ACCUMULATION / DISTRIBUTION (top line)** — the current regime and the core buy/sell volume ratio. Above ~1 leans accumulation, below ~1 leans distribution (the exact flip points adapt to each stock — see Auto-Calibration below).
**Evidence leaning** — a simple tally: how many rows lean bullish vs bearish right now. It's counting, not predicting. A quick gut-check on the balance of evidence.
**Buying vs selling volume** — the heart of the tool. Over the window, which side moved more shares. This is what drives the background color.
**Today's volume vs normal** — is *today* heavy or light, and in which direction? Reads as "Strong buying," "Strong selling," "Quiet," or "Normal." Heavy volume on an up day is buying; heavy on a down day is selling; the tool sorts that out for you.
**Up days heavier than down days?** — this asks whether up-days are *bigger*, not just more frequent. Genuine accumulation makes up-days heavier. This row often disagrees with "Buying vs selling volume," and **that disagreement is a real signal**: frequent-but-light buying is weaker than the raw ratio suggests.
**Money flow — day to day** — the running direction of net volume (an OBV-style read). Rising or falling.
**Money flow — closing strength** — money flow weighted by *where price closes within each day's range* (an A/D-style read). Here's the useful part: when "day to day" is **rising** but "closing strength" is **falling**, it means buyers are active during the day but sellers are hitting the close. That split is a common, meaningful tell that a rally is being sold into.
**Where price closes in its range** — over the window, are closes landing near the highs (bullish) or the lows (bearish)?
**Heavy selling days (last 25)** — a count of institutional-style down days (a notable drop on above-average volume). Reads "Calm," "Elevated," or "Warning." Five or more is a classic topping caution.
**Scheduled-event day?** — the row that keeps the tool honest. Explained next.
**Flip bands** — shows whether the tool is auto-calibrated to this symbol or using manual bands, and the resolved numbers.
---
## Scheduled-event days (the feature most tools skip)
On certain days, volume is **mechanical plumbing, not sentiment**:
- **Ex-dividend days** — the stock opens lower by the dividend amount automatically. It looks like a red day but means nothing about buying or selling pressure.
- **Options expiration** (every third Friday) and **quarterly witching** (Mar/Jun/Sep/Dec) — volume balloons for structural reasons unrelated to conviction.
- **Index rebalancing** (late June) — one of the highest-volume, least-meaningful days of the year.
The tool detects these days, flags them ("YES — ignore today's numbers"), marks them with a small dot, and **automatically excludes them from every calculation**. This is why a scary-looking ex-dividend candle won't fool it — the math already knows to look away.
*(Ex-dividend detection depends on the data feed carrying dividend info for that symbol; not every symbol provides it.)*
---
## Auto-calibration — why it works on any stock
A sleepy utility and a volatile biotech have completely different normal volume behavior. A fixed threshold that fits one will misread the other.
With **Auto-calibrate** on (the default), the tool measures each stock's *own* buy/sell ratio over a long lookback and sets the flip points relative to that stock's normal range. Load it on any US stock and the bands retune themselves. The "Flip bands" row shows you what it settled on, e.g. "Auto — tuned to KO."
You can turn auto-calibration off and set the bands manually if you prefer a fixed standard across everything.
---
## How to use it — a simple workflow
1. **Use it on the daily chart.** That's where the logic is designed to work. Lower timeframes reinterpret "20 sessions" as "20 bars," which changes the meaning.
2. **Read the regime first** (background + top line), then read the rows for texture. The two "money flow" rows and "up days heavier?" often show the tape improving or weakening *before* the background flips — that's your early read.
3. **Watch for disagreement between the rows and the paint.** Rows leaning green under a red background = accumulation may be quietly building ahead of the flip. Rows leaning red under a green background = control may be slipping. The gap is where the early information lives.
4. **Always combine it with price levels.** This is a volume-context tool, not a standalone system. It tells you *who's winning the volume war*; your own support, resistance, and moving averages tell you *where to act*. When a regime flip lines up with a meaningful price level, that's a far stronger read than either alone.
5. **Respect the scheduled-event flag.** On flagged days, ignore the day's fresh numbers — the tool already discounts them, and you should too.
---
## Honest limitations — please read before trusting it
- **It lags at turns by design.** Expect roughly 2–4 weeks late confirming a major bottom or top. Not a bug — the price of a signal that doesn't whipsaw.
- **It produces false signals.** On a trending stock, expect on the order of one fake regime flip per year — a color change that reverses within weeks. No volume tool is immune. **Your price levels are what protect you when it's wrong.**
- **The finer thresholds were tuned on one stock's history.** The flip bands auto-adapt per symbol, but the row-level cutoffs (what counts as a "heavy selling day," etc.) are sensible defaults, not universally validated constants. Adjust and test on what you trade.
- **Volume analysis describes; it does not predict.** Treat every reading as evidence to weigh, never as an order to follow.
- **US equities only.** The scheduled-event calendar is built for US stocks. Don't rely on it for crypto or futures.
---
## The one-sentence summary
**Green means buyers have controlled the last month, red means sellers have — read it late, pair it with your price levels, ignore the scheduled-event days, and never mistake a description of the past for a prediction of the future.**
*This is a reading aid, not financial advice. It reports on volume; it does not know what happens next. Trade your own plan.*
## What this is
Most volume indicators give you a squiggly line and leave you to interpret it. This one reads the volume for you and **writes the answer in plain English** — Bullish, Bearish, or Neutral, row by row — with a background color that tells you at a glance whether recent trading has been accumulation (buyers in control) or distribution (sellers in control).
It is a **reading aid for your own judgment**, not a buy/sell signal generator. It tells you who has been winning the volume war. You decide what to do about it.
**One thing to understand up front:** this tool looks *backward*. It reports what already happened over the recent past. It is a rearview mirror, not a windshield. Used that way, it's honest and useful. Expecting it to predict the next move is the one way to misuse it.
---
## The 10-second read
When you load it, look at two things:
1. **The background color.** Green = the recent tape was accumulation. Red = distribution. No color = contested, no clear winner.
2. **The top line of the table.** It states the current regime in words: "ACCUMULATION — last 20 sessions" or "DISTRIBUTION — last 20 sessions."
That's the headline. Everything else is the finer detail behind it.
---
## The background color, explained
The tool looks at the last 20 sessions and asks one question: **did up-day volume or down-day volume dominate?**
- **Green** — up-day volume won. Buyers were more aggressive. Accumulation.
- **Red** — down-day volume won. Sellers were more aggressive. Distribution.
- **No color** — neither side clearly dominated.
Two important properties:
- **It never repaints.** Each day is painted with that day's verdict and stays that way forever. The tool will never quietly rewrite its own history to look smarter — a trap many indicators fall into.
- **It confirms turns late — on purpose.** Because it averages 20 sessions, it typically flips a few weeks *after* the actual bottom or top. This is the cost of a clean signal that doesn't flip-flop on every wiggle. If you want to catch the exact low, this is the wrong tool. If you want to know which side has controlled the last month without second-guessing every candle, this is built for it.
When the regime flips, a small **green triangle** (turned accumulation) or **red triangle** (turned distribution) marks the exact bar.
---
## The dashboard table, row by row
Each row interprets itself. The colored word is the verdict; the number in parentheses is the raw value for when you want it.
**ACCUMULATION / DISTRIBUTION (top line)** — the current regime and the core buy/sell volume ratio. Above ~1 leans accumulation, below ~1 leans distribution (the exact flip points adapt to each stock — see Auto-Calibration below).
**Evidence leaning** — a simple tally: how many rows lean bullish vs bearish right now. It's counting, not predicting. A quick gut-check on the balance of evidence.
**Buying vs selling volume** — the heart of the tool. Over the window, which side moved more shares. This is what drives the background color.
**Today's volume vs normal** — is *today* heavy or light, and in which direction? Reads as "Strong buying," "Strong selling," "Quiet," or "Normal." Heavy volume on an up day is buying; heavy on a down day is selling; the tool sorts that out for you.
**Up days heavier than down days?** — this asks whether up-days are *bigger*, not just more frequent. Genuine accumulation makes up-days heavier. This row often disagrees with "Buying vs selling volume," and **that disagreement is a real signal**: frequent-but-light buying is weaker than the raw ratio suggests.
**Money flow — day to day** — the running direction of net volume (an OBV-style read). Rising or falling.
**Money flow — closing strength** — money flow weighted by *where price closes within each day's range* (an A/D-style read). Here's the useful part: when "day to day" is **rising** but "closing strength" is **falling**, it means buyers are active during the day but sellers are hitting the close. That split is a common, meaningful tell that a rally is being sold into.
**Where price closes in its range** — over the window, are closes landing near the highs (bullish) or the lows (bearish)?
**Heavy selling days (last 25)** — a count of institutional-style down days (a notable drop on above-average volume). Reads "Calm," "Elevated," or "Warning." Five or more is a classic topping caution.
**Scheduled-event day?** — the row that keeps the tool honest. Explained next.
**Flip bands** — shows whether the tool is auto-calibrated to this symbol or using manual bands, and the resolved numbers.
---
## Scheduled-event days (the feature most tools skip)
On certain days, volume is **mechanical plumbing, not sentiment**:
- **Ex-dividend days** — the stock opens lower by the dividend amount automatically. It looks like a red day but means nothing about buying or selling pressure.
- **Options expiration** (every third Friday) and **quarterly witching** (Mar/Jun/Sep/Dec) — volume balloons for structural reasons unrelated to conviction.
- **Index rebalancing** (late June) — one of the highest-volume, least-meaningful days of the year.
The tool detects these days, flags them ("YES — ignore today's numbers"), marks them with a small dot, and **automatically excludes them from every calculation**. This is why a scary-looking ex-dividend candle won't fool it — the math already knows to look away.
*(Ex-dividend detection depends on the data feed carrying dividend info for that symbol; not every symbol provides it.)*
---
## Auto-calibration — why it works on any stock
A sleepy utility and a volatile biotech have completely different normal volume behavior. A fixed threshold that fits one will misread the other.
With **Auto-calibrate** on (the default), the tool measures each stock's *own* buy/sell ratio over a long lookback and sets the flip points relative to that stock's normal range. Load it on any US stock and the bands retune themselves. The "Flip bands" row shows you what it settled on, e.g. "Auto — tuned to KO."
You can turn auto-calibration off and set the bands manually if you prefer a fixed standard across everything.
---
## How to use it — a simple workflow
1. **Use it on the daily chart.** That's where the logic is designed to work. Lower timeframes reinterpret "20 sessions" as "20 bars," which changes the meaning.
2. **Read the regime first** (background + top line), then read the rows for texture. The two "money flow" rows and "up days heavier?" often show the tape improving or weakening *before* the background flips — that's your early read.
3. **Watch for disagreement between the rows and the paint.** Rows leaning green under a red background = accumulation may be quietly building ahead of the flip. Rows leaning red under a green background = control may be slipping. The gap is where the early information lives.
4. **Always combine it with price levels.** This is a volume-context tool, not a standalone system. It tells you *who's winning the volume war*; your own support, resistance, and moving averages tell you *where to act*. When a regime flip lines up with a meaningful price level, that's a far stronger read than either alone.
5. **Respect the scheduled-event flag.** On flagged days, ignore the day's fresh numbers — the tool already discounts them, and you should too.
---
## Honest limitations — please read before trusting it
- **It lags at turns by design.** Expect roughly 2–4 weeks late confirming a major bottom or top. Not a bug — the price of a signal that doesn't whipsaw.
- **It produces false signals.** On a trending stock, expect on the order of one fake regime flip per year — a color change that reverses within weeks. No volume tool is immune. **Your price levels are what protect you when it's wrong.**
- **The finer thresholds were tuned on one stock's history.** The flip bands auto-adapt per symbol, but the row-level cutoffs (what counts as a "heavy selling day," etc.) are sensible defaults, not universally validated constants. Adjust and test on what you trade.
- **Volume analysis describes; it does not predict.** Treat every reading as evidence to weigh, never as an order to follow.
- **US equities only.** The scheduled-event calendar is built for US stocks. Don't rely on it for crypto or futures.
---
## The one-sentence summary
**Green means buyers have controlled the last month, red means sellers have — read it late, pair it with your price levels, ignore the scheduled-event days, and never mistake a description of the past for a prediction of the future.**
*This is a reading aid, not financial advice. It reports on volume; it does not know what happens next. Trade your own plan.*
Note di rilascio
Update — accuracy passThis is a reliability update. The tool works the same way; it's just more
honest and more accurate now. What changed:
• No more mid-day flicker. The background color and the accumulation/
distribution signals now lock in only when the bar closes. What you see
won't quietly change on you later.
• Calendar noise is fully filtered out. Days when volume is just mechanics
— options expiration, quarterly witching, the June index rebalance, and
ex-dividend days — are now ignored across every reading, not just some of
them. Those days no longer skew the evidence.
• Quiet stretches aren't mistaken for selling. Low-volume windows with no
real activity used to sometimes flash as "distribution." Fixed.
• "Today's volume vs normal" is measured cleanly. The normal-volume baseline
no longer counts the current day against itself, so spikes read correctly.
• Auto-calibrated bands are steadier. They now tune to each symbol using a
method that shrugs off one-off outlier days instead of being pulled by them.
• More dependable on thin symbols. Added safeguards so it behaves on low-
volume, illiquid, or newly listed tickers.
How this was built: written with Claude Code (Anthropic), then independently
reviewed by OpenAI's Codex — two different AI models checking each other's
work to catch mistakes before release.
Script open-source
Nello spirito di TradingView, l'autore di questo script lo ha reso open source, in modo che i trader possano esaminarne e verificarne la funzionalità. Complimenti all'autore! Sebbene sia possibile utilizzarlo gratuitamente, ricordiamo che la ripubblicazione del codice è soggetta al nostro Regolamento.

Declinazione di responsabilità
Le informazioni e le pubblicazioni non sono intese come, e non costituiscono, consulenza o raccomandazioni finanziarie, di investimento, di trading o di altro tipo fornite o approvate da TradingView. Per ulteriori informazioni, consultare i Termini di utilizzo.
Script open-source
Nello spirito di TradingView, l'autore di questo script lo ha reso open source, in modo che i trader possano esaminarne e verificarne la funzionalità. Complimenti all'autore! Sebbene sia possibile utilizzarlo gratuitamente, ricordiamo che la ripubblicazione del codice è soggetta al nostro Regolamento.
Declinazione di responsabilità
Le informazioni e le pubblicazioni non sono intese come, e non costituiscono, consulenza o raccomandazioni finanziarie, di investimento, di trading o di altro tipo fornite o approvate da TradingView. Per ulteriori informazioni, consultare i Termini di utilizzo.