Aggiornato
Aquile Reali Debt Scenario
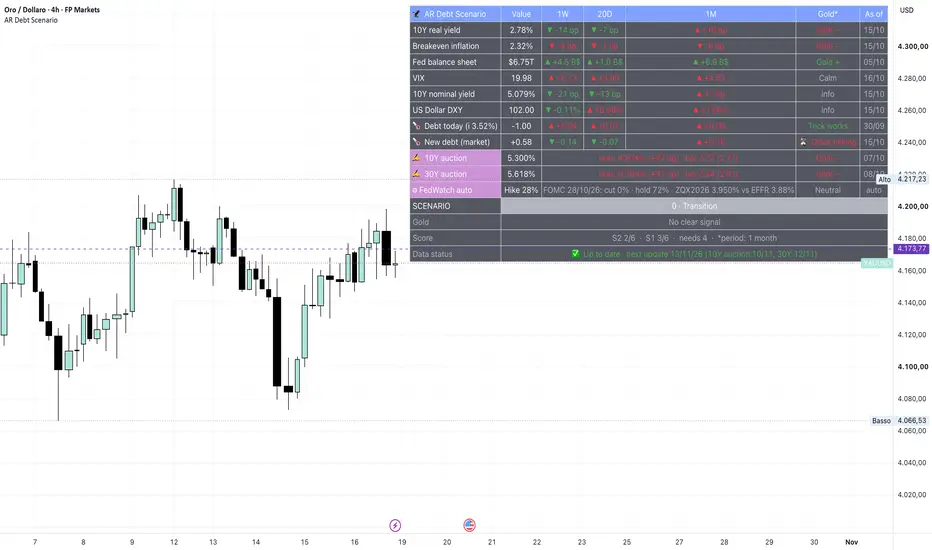
🦅 AQUILE REALI — DEBT SCENARIO
Can the United States inflate its debt away? And what does it mean for gold?
This indicator answers one question in a single table: which "debt regime" is the market in right now — and how gold has historically behaved in it.
━━━━━━━━━━━━━━━━━━━━━━━━━━━━━━━━━━
THE IDEA IN ONE MINUTE
━━━━━━━━━━━━━━━━━━━━━━━━━━━━━━━━━━
Imagine you owe the bank 100,000 on a fixed-rate mortgage, and you earn 2,000 a month. Then strong inflation hits: prices double, and so does your salary — now 4,000. But your debt is still 100,000. The number on the contract never changes.
Before, your debt was worth 50 months of salary. Now it is worth 25. You repaid nothing, yet your debt has been cut in half. Who paid for it? The bank: it gets back money that buys half as much.
A government can do exactly the same. With debt above 100% of GDP, letting inflation run makes the debt shrink on its own — as long as the interest rate it pays stays BELOW inflation. Economists call this "financial repression". It is a hidden tax on savers and bondholders.
It has been done before:
• United States after World War II — debt above 100% of GDP. Until 1951 the Fed kept Treasury yields capped, inflation did the rest, and within roughly 25 years debt fell to around a quarter of GDP.
• Italy in the 1970s — double-digit inflation, and the central bank bought the Treasury bills the market didn't want. When that arrangement ended in 1981, real rates turned positive and high, and the debt exploded during the 1980s.
The lesson: the trick works... until the market notices. Lenders are not stupid. If they expect inflation, they stop lending at 1% and ask for 5%, 6%, 8%. And since a government must constantly roll over its maturing debt, it has to pay those higher rates — and the trick breaks.
That tug-of-war between the State and the bond market is exactly what this indicator measures.
━━━━━━━━━━━━━━━━━━━━━━━━━━━━━━━━━━
THE 3 SCENARIOS
━━━━━━━━━━━━━━━━━━━━━━━━━━━━━━━━━━
🔴 SCENARIO 1 · THE MARKET WINS
Investors refuse to be "inflated away". They demand higher yields at Treasury auctions, real yields climb, the Fed stays tight to fight inflation. The US pays a lot of interest, but inflation slowly cools.
Like the bank that says: "I'll lend to you again — but at 8%."
→ Gold: held back. Rising real yields and a strong dollar are its two classic headwinds.
What you see: real yield rising, breakeven inflation flat or falling, Fed balance sheet flat or shrinking, auction yields higher than last time, FedWatch leaning towards hikes.
🟢 SCENARIO 2 · FINANCIAL REPRESSION
The burden becomes too heavy and the State forces the market's hand. The Fed buys bonds to keep rates down, the Treasury shifts to short-term issuance, pressure builds to keep yields low while inflation stays high. The trick works: debt shrinks in real terms, savers pay the bill.
Like the post-war US or 1970s Italy.
→ Gold: the best environment of all. When bonds pay less than inflation, money flees bonds and cash and looks for something that cannot be printed.
What you see: real yield falling, breakeven inflation rising, Fed balance sheet growing again, auction yields easing, FedWatch leaning towards cuts.
🟠 SCENARIO 3 · SOMETHING BREAKS
Rates rise so far that something cracks — stocks, banks, real estate, a funding market. Volatility explodes and the Fed is forced to cut in a hurry to save the system.
→ Gold: often falls first (everything is sold to raise cash, gold included), then usually rallies hard once the Fed starts easing.
What you see: VIX above the threshold (default 25). This overrides every other signal.
⚪ SCENARIO 0 · TRANSITION
Mixed signals, no clear regime. Often the moment when one scenario is ending and the next has not yet taken over.
━━━━━━━━━━━━━━━━━━━━━━━━━━━━━━━━━━
WHAT THE INDICATOR READS — AUTOMATICALLY
━━━━━━━━━━━━━━━━━━━━━━━━━━━━━━━━━━
• 10Y real yield (FRED DFII10) — the real cost of money after inflation. The single most important driver of gold.
• 10Y breakeven inflation (FRED T10YIE) — the inflation the bond market expects.
• Fed balance sheet (FRED WALCL, weekly, released Thursdays) — is the Fed buying debt again?
• VIX — the market's fear gauge.
• 10Y nominal yield and DXY — context: what the US pays to borrow, and the dollar.
• FedWatch-style probabilities for the next FOMC meeting, calculated from CBOT 30-Day Fed Funds futures (ZQ) and the effective fed funds rate (FRED EFFR). Same logic as the CME tool; results may differ by a few points.
• FOMC calendar built in (2026 and the Fed's tentative 2027 dates). The indicator finds the next meeting by itself.
━━━━━━━━━━━━━━━━━━━━━━━━━━━━━━━━━━
WHAT YOU UPDATE — ONCE A MONTH (2 MINUTES)
━━━━━━━━━━━━━━━━━━━━━━━━━━━━━━━━━━
Pine Script cannot read websites, so the US Treasury auction results are entered by hand. They are the best real-time proof of whether the market is "accepting" the debt or pushing back.
1. Open the indicator Settings → section "Manual data".
2. The day after the monthly 30-year auction, enter for both the 10-year note and the 30-year bond: auction date, high yield, previous auction yield, bid-to-cover.
3. Where to find them: the US Treasury auction results (TreasuryDirect), or any economic calendar listing "10-Year Note Auction" and "30-Year Bond Auction".
You never have to remember the date. The official US Treasury auction calendar is built in: the "Data status" row shows the exact day of the next update (for example: "next update 13/11/26 — 10Y auction 10/11, 30Y 12/11") and turns to ⚠ UPDATE NEEDED as soon as a new result is out. An optional alert reminds you once a day until you do it.
How to read an auction: a yield higher than the previous auction means investors demanded more to lend → the market is pushing back (scenario 1). Bid-to-cover is the number of bids for every bond sold: when it falls, demand is weakening.
The script is updated after each auction month with the new default values.
━━━━━━━━━━━━━━━━━━━━━━━━━━━━━━━━━━
HOW THE SCORE WORKS
━━━━━━━━━━━━━━━━━━━━━━━━━━━━━━━━━━
Six signals, one point each, to scenario 1 or scenario 2:
1. Real yield direction
2. Breakeven inflation direction
3. Fed balance sheet direction
4. Real yield vs threshold (default 2.80%)
5. Auction yields vs previous auction
6. FedWatch: hike more likely than cut, or the opposite
4 points out of 6 decide the scenario (3 out of 4 if you switch the manual data off). VIX above its threshold overrides everything → scenario 3.
The comparison period is selectable: 1 week, 20 days or 1 month (default).
━━━━━━━━━━━━━━━━━━━━━━━━━━━━━━━━━━
TABLE VERSIONS
━━━━━━━━━━━━━━━━━━━━━━━━━━━━━━━━━━
• Weekly — value and 1-week change for every asset, auctions and FedWatch included (default)
• Full — every asset across 3 periods, date of each data point, optional "meaning" column
• Minimal — only the 4 assets that drive the scenario
• Survival — scenario and gold impact only, for a clean trading chart
Classic, Dark and Light themes · 9 positions · 5 text sizes · English / Italiano.
━━━━━━━━━━━━━━━━━━━━━━━━━━━━━━━━━━
ALERTS
━━━━━━━━━━━━━━━━━━━━━━━━━━━━━━━━━━
Create alert → Condition "AR Debt Scenario" → "Any alert() function call".
You will be notified when the scenario changes (with all the values in the message) and when the manual data needs updating. Separate alert conditions are also available for entering each scenario.
━━━━━━━━━━━━━━━━━━━━━━━━━━━━━━━━━━
NOTES
━━━━━━━━━━━━━━━━━━━━━━━━━━━━━━━━━━
• FRED series are published with about one business day of delay; the "As of" column in the Full table shows the date of each value.
• This is a macro context tool for the bigger picture, not an entry signal. Nobody knows the timing: a regime can last months or years.
Personal opinion, not financial advice.
Aquile Reali
Nate per volare, nate per osare · Be Stable. Be Strong. 🦅
Can the United States inflate its debt away? And what does it mean for gold?
This indicator answers one question in a single table: which "debt regime" is the market in right now — and how gold has historically behaved in it.
━━━━━━━━━━━━━━━━━━━━━━━━━━━━━━━━━━
THE IDEA IN ONE MINUTE
━━━━━━━━━━━━━━━━━━━━━━━━━━━━━━━━━━
Imagine you owe the bank 100,000 on a fixed-rate mortgage, and you earn 2,000 a month. Then strong inflation hits: prices double, and so does your salary — now 4,000. But your debt is still 100,000. The number on the contract never changes.
Before, your debt was worth 50 months of salary. Now it is worth 25. You repaid nothing, yet your debt has been cut in half. Who paid for it? The bank: it gets back money that buys half as much.
A government can do exactly the same. With debt above 100% of GDP, letting inflation run makes the debt shrink on its own — as long as the interest rate it pays stays BELOW inflation. Economists call this "financial repression". It is a hidden tax on savers and bondholders.
It has been done before:
• United States after World War II — debt above 100% of GDP. Until 1951 the Fed kept Treasury yields capped, inflation did the rest, and within roughly 25 years debt fell to around a quarter of GDP.
• Italy in the 1970s — double-digit inflation, and the central bank bought the Treasury bills the market didn't want. When that arrangement ended in 1981, real rates turned positive and high, and the debt exploded during the 1980s.
The lesson: the trick works... until the market notices. Lenders are not stupid. If they expect inflation, they stop lending at 1% and ask for 5%, 6%, 8%. And since a government must constantly roll over its maturing debt, it has to pay those higher rates — and the trick breaks.
That tug-of-war between the State and the bond market is exactly what this indicator measures.
━━━━━━━━━━━━━━━━━━━━━━━━━━━━━━━━━━
THE 3 SCENARIOS
━━━━━━━━━━━━━━━━━━━━━━━━━━━━━━━━━━
🔴 SCENARIO 1 · THE MARKET WINS
Investors refuse to be "inflated away". They demand higher yields at Treasury auctions, real yields climb, the Fed stays tight to fight inflation. The US pays a lot of interest, but inflation slowly cools.
Like the bank that says: "I'll lend to you again — but at 8%."
→ Gold: held back. Rising real yields and a strong dollar are its two classic headwinds.
What you see: real yield rising, breakeven inflation flat or falling, Fed balance sheet flat or shrinking, auction yields higher than last time, FedWatch leaning towards hikes.
🟢 SCENARIO 2 · FINANCIAL REPRESSION
The burden becomes too heavy and the State forces the market's hand. The Fed buys bonds to keep rates down, the Treasury shifts to short-term issuance, pressure builds to keep yields low while inflation stays high. The trick works: debt shrinks in real terms, savers pay the bill.
Like the post-war US or 1970s Italy.
→ Gold: the best environment of all. When bonds pay less than inflation, money flees bonds and cash and looks for something that cannot be printed.
What you see: real yield falling, breakeven inflation rising, Fed balance sheet growing again, auction yields easing, FedWatch leaning towards cuts.
🟠 SCENARIO 3 · SOMETHING BREAKS
Rates rise so far that something cracks — stocks, banks, real estate, a funding market. Volatility explodes and the Fed is forced to cut in a hurry to save the system.
→ Gold: often falls first (everything is sold to raise cash, gold included), then usually rallies hard once the Fed starts easing.
What you see: VIX above the threshold (default 25). This overrides every other signal.
⚪ SCENARIO 0 · TRANSITION
Mixed signals, no clear regime. Often the moment when one scenario is ending and the next has not yet taken over.
━━━━━━━━━━━━━━━━━━━━━━━━━━━━━━━━━━
WHAT THE INDICATOR READS — AUTOMATICALLY
━━━━━━━━━━━━━━━━━━━━━━━━━━━━━━━━━━
• 10Y real yield (FRED DFII10) — the real cost of money after inflation. The single most important driver of gold.
• 10Y breakeven inflation (FRED T10YIE) — the inflation the bond market expects.
• Fed balance sheet (FRED WALCL, weekly, released Thursdays) — is the Fed buying debt again?
• VIX — the market's fear gauge.
• 10Y nominal yield and DXY — context: what the US pays to borrow, and the dollar.
• FedWatch-style probabilities for the next FOMC meeting, calculated from CBOT 30-Day Fed Funds futures (ZQ) and the effective fed funds rate (FRED EFFR). Same logic as the CME tool; results may differ by a few points.
• FOMC calendar built in (2026 and the Fed's tentative 2027 dates). The indicator finds the next meeting by itself.
━━━━━━━━━━━━━━━━━━━━━━━━━━━━━━━━━━
WHAT YOU UPDATE — ONCE A MONTH (2 MINUTES)
━━━━━━━━━━━━━━━━━━━━━━━━━━━━━━━━━━
Pine Script cannot read websites, so the US Treasury auction results are entered by hand. They are the best real-time proof of whether the market is "accepting" the debt or pushing back.
1. Open the indicator Settings → section "Manual data".
2. The day after the monthly 30-year auction, enter for both the 10-year note and the 30-year bond: auction date, high yield, previous auction yield, bid-to-cover.
3. Where to find them: the US Treasury auction results (TreasuryDirect), or any economic calendar listing "10-Year Note Auction" and "30-Year Bond Auction".
You never have to remember the date. The official US Treasury auction calendar is built in: the "Data status" row shows the exact day of the next update (for example: "next update 13/11/26 — 10Y auction 10/11, 30Y 12/11") and turns to ⚠ UPDATE NEEDED as soon as a new result is out. An optional alert reminds you once a day until you do it.
How to read an auction: a yield higher than the previous auction means investors demanded more to lend → the market is pushing back (scenario 1). Bid-to-cover is the number of bids for every bond sold: when it falls, demand is weakening.
The script is updated after each auction month with the new default values.
━━━━━━━━━━━━━━━━━━━━━━━━━━━━━━━━━━
HOW THE SCORE WORKS
━━━━━━━━━━━━━━━━━━━━━━━━━━━━━━━━━━
Six signals, one point each, to scenario 1 or scenario 2:
1. Real yield direction
2. Breakeven inflation direction
3. Fed balance sheet direction
4. Real yield vs threshold (default 2.80%)
5. Auction yields vs previous auction
6. FedWatch: hike more likely than cut, or the opposite
4 points out of 6 decide the scenario (3 out of 4 if you switch the manual data off). VIX above its threshold overrides everything → scenario 3.
The comparison period is selectable: 1 week, 20 days or 1 month (default).
━━━━━━━━━━━━━━━━━━━━━━━━━━━━━━━━━━
TABLE VERSIONS
━━━━━━━━━━━━━━━━━━━━━━━━━━━━━━━━━━
• Weekly — value and 1-week change for every asset, auctions and FedWatch included (default)
• Full — every asset across 3 periods, date of each data point, optional "meaning" column
• Minimal — only the 4 assets that drive the scenario
• Survival — scenario and gold impact only, for a clean trading chart
Classic, Dark and Light themes · 9 positions · 5 text sizes · English / Italiano.
━━━━━━━━━━━━━━━━━━━━━━━━━━━━━━━━━━
ALERTS
━━━━━━━━━━━━━━━━━━━━━━━━━━━━━━━━━━
Create alert → Condition "AR Debt Scenario" → "Any alert() function call".
You will be notified when the scenario changes (with all the values in the message) and when the manual data needs updating. Separate alert conditions are also available for entering each scenario.
━━━━━━━━━━━━━━━━━━━━━━━━━━━━━━━━━━
NOTES
━━━━━━━━━━━━━━━━━━━━━━━━━━━━━━━━━━
• FRED series are published with about one business day of delay; the "As of" column in the Full table shows the date of each value.
• This is a macro context tool for the bigger picture, not an entry signal. Nobody knows the timing: a regime can last months or years.
Personal opinion, not financial advice.
Aquile Reali
Nate per volare, nate per osare · Be Stable. Be Strong. 🦅
Note di rilascio
v2.2 — Debt thermometer, auction calendar, FedWatch fixNEW
- Debt thermometer, 2 new rows: (i − π − g)
– "Debt today": average interest rate on all US marketable debt − breakeven inflation − real GDP growth.
Below 0 = debt is shrinking relative to the economy ("Trick works"); above 0 = "Debt grows".
– "New debt (market)": 10Y real yield − real GDP growth. Shows where debt costs go as old bonds roll over
(~6 years). If today is below 0 but new debt is above 0 → "Clock ticking".
- Real GDP growth read automatically (FRED A191RL1Q225SBEA, average of the last 4 quarters),
with an optional manual override.
- New manual input: average interest rate on US marketable debt (once a month, start of month),
with its own "⚠" warning when older than 45 days.
- Official US Treasury auction calendar built in. The "Data status" row now shows the exact
next update date and the next 10Y/30Y auction dates, and turns to "⚠ UPDATE NEEDED" as soon as
a new auction result is out (no longer only after N days; N days is now just a fallback).
- Previous bid-to-cover input for both auctions, shown next to the current one.
- FedWatch row shows the futures contract used, its implied rate and the effective fed funds rate,
so you can check the math (can be turned off).
- FOMC calendar extended through December 2027.
- New "Classic" theme, alongside Dark and Light.
FIXED
- FedWatch could show a false hike probability (e.g. 90% instead of ~15–25%). The script read the
continuous Fed Funds contracts (ZQ1!/ZQ2!), which on TradingView roll to the next month before
expiry, so a later contract pricing a future meeting could be assigned to the next FOMC.
Now it reads the exact contract month (e.g. CBOT:ZQX2026 for the October meeting) and switches
automatically after each meeting.
CHANGED
- FedWatch scoring: counts against gold only if a hike is above 50%, for gold only if a cut is
above 50%, otherwise Neutral. Before, any hike probability above the cut probability
(even 5% vs 0%) added a point to scenario 1.
- Default display: Classic theme, Normal text size, 15% background transparency.

AQUILE REALI – Educational tools by giua64
Declinazione di responsabilità
Le informazioni e le pubblicazioni non sono intese come, e non costituiscono, consulenza o raccomandazioni finanziarie, di investimento, di trading o di altro tipo fornite o approvate da TradingView. Per ulteriori informazioni, consultare i Termini di utilizzo.
AQUILE REALI – Educational tools by giua64
Declinazione di responsabilità
Le informazioni e le pubblicazioni non sono intese come, e non costituiscono, consulenza o raccomandazioni finanziarie, di investimento, di trading o di altro tipo fornite o approvate da TradingView. Per ulteriori informazioni, consultare i Termini di utilizzo.