Breakout Radar (TechnoBlooms)
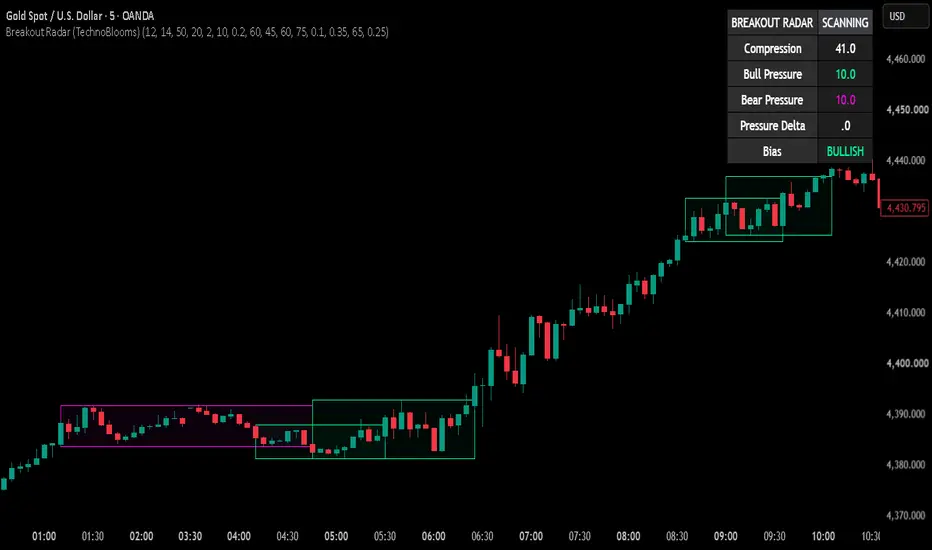
Breakout Radar (TechnoBlooms)
Compression • Pressure • Bias • Breakout Confirmation
A structure-first breakout analysis tool designed to identify when quiet price action is building toward a directional move.
Overview
Breakout Radar is a price-compression and breakout-pressure indicator developed by TechnoBlooms. Instead of simply marking every new high or low as a breakout, it first looks for a compressed market structure, measures the pressure developing inside that structure, identifies directional bias, and then waits for price to confirm a break beyond the locked range.
The objective is simple: help traders distinguish between ordinary sideways movement and a consolidation that may be preparing for expansion. The indicator is designed as a decision-support tool, not as an automatic buy/sell system.
What Makes Breakout Radar Different?
Compression first: The system searches for contraction in volatility and price structure before considering a breakout.
Locked structure boxes: Once a qualifying compression is detected, its boundaries are locked instead of continuously following price like a conventional range filter.
Bull vs Bear Pressure: The indicator evaluates how price is behaving near the upper and lower boundaries and converts that behaviour into separate Bull Pressure and Bear Pressure readings.
Pressure Delta and Bias: The difference between bullish and bearish pressure helps identify whether the structure is leaning BULLISH, BEARISH or remains NEUTRAL.
Progressive radar states: The setup develops through SCANNING, BUILDING, WATCH and ARMED states rather than jumping immediately to a signal.
Confirmed breakout: A breakout requires price to close beyond the locked structure with an ATR-based confirmation buffer.
Signal validity buffer: After confirmation, the latest breakout signal can remain valid through a normal retest and is removed only when its stored invalidation level is breached or a newer breakout replaces it.
Clean historical context: Completed compression structures remain faintly visible so traders can study how earlier consolidations resolved, while overlap filtering reduces unnecessary nested boxes.
How to Read the Dashboard
Dashboard Item Interpretation
Compression Measures how strongly the current market is contracting. Higher values indicate tighter compression relative to recent conditions.
Bull Pressure Measures bullish pressure developing inside the active structure.
Bear Pressure Measures bearish pressure developing inside the active structure.
Pressure Delta Bull Pressure minus Bear Pressure. A positive value favours bulls; a negative value favours bears.
Bias Summarises the current directional pressure as BULLISH, BEARISH or NEUTRAL.
Radar State SCANNING = no active setup; BUILDING = compression found; WATCH = pressure is becoming meaningful; ARMED = pressure and compression have reached stronger conditions.
Understanding the Radar States
SCANNING — The indicator is monitoring the market, but no qualifying compression structure is currently active.
BUILDING — A compression structure has been identified. Pressure is developing, but the setup is not yet strong enough to demand close attention.
WATCH — Pressure has strengthened. Traders may begin watching the box boundaries and directional bias more closely.
ARMED — Compression and directional pressure have reached stronger conditions. This does not mean a breakout has already happened; it means the structure deserves heightened attention.
How the Breakout Signal Works
A bullish breakout is considered confirmed when price closes above the locked upper boundary plus the configured ATR confirmation buffer and bullish pressure is stronger than bearish pressure. A bearish breakout uses the opposite logic below the lower boundary.
Only the latest relevant breakout arrow is retained. The arrow is intentionally small so the chart remains focused on structure rather than becoming filled with historical signal markers.
The signal is not automatically removed after a fixed number of candles. At the moment of confirmation, Breakout Radar stores an ATR-based invalidation level. This allows price to perform a normal retest without immediately cancelling the breakout. The signal disappears when the breakout is invalidated or when a newer confirmed breakout replaces it.
Example 1 — Bullish Compression Breakout
Assume a stock trades sideways between ₹980 and ₹1,000 while volatility contracts. Breakout Radar identifies the compression and locks a box around the structure. As price repeatedly tests the upper portion of the box, Bull Pressure rises from 48 to 64 and then to 78, while Bear Pressure remains near 42.
The dashboard may progress from BUILDING → WATCH → ARMED with a BULLISH bias. If price subsequently closes above the upper boundary plus the breakout confirmation buffer, a small bullish arrow appears. A minor pullback toward the breakout area does not automatically remove the signal; it remains valid until the stored bullish invalidation level is breached.
Example 2 — Bearish Compression Breakout
Imagine an index consolidating between 24,800 and 25,000. During the consolidation, repeated pressure develops near the lower boundary. Bear Pressure increases to 81 while Bull Pressure falls to 51, producing a negative Pressure Delta and a BEARISH bias.
Once price closes below the locked lower boundary with the required ATR buffer, the bearish breakout is confirmed and a small downward arrow appears. The completed compression box remains on the chart as historical context while the Radar is free to scan independently for the next compression structure.
Example 3 — Why ARMED Is Not the Same as BUY or SELL
Suppose Compression is 76, Bull Pressure is 80 and Bear Pressure is 49. The Radar can show ARMED with a BULLISH bias even though price is still inside the box. This is an early-warning condition, not a trade confirmation. If price fails to break the upper boundary and pressure weakens, the setup can remain inside the structure or change bias. The breakout arrow appears only after the actual confirmation condition is met.
Reading the Boxes
The rectangles represent detected compression structures. The active structure is used for live pressure and breakout analysis. After a breakout, the completed box can remain lightly visible to show where the expansion originated. An overlap filter is used to reduce repeated boxes representing substantially the same price structure.
How Breakout Radar Compares with Other Popular Tools
Breakout Radar shares some visual ideas with range filters, order blocks, and support/resistance tools because all of them study how price behaves around important areas. The similarity, however, is mainly in the chart structure. Breakout Radar is built for a different question: is the market compressing, which side is applying more pressure, and has that compression actually expanded into a confirmed breakout?
Tool Main Purpose Similarity Key Difference
Range Filter Smooth price noise and identify directional movement or a filtered trading range. Both may show boundaries around price and can help traders recognise a transition from sideways movement to expansion. A range filter usually moves or recalculates with price. Breakout Radar first detects compression, locks the structure, measures Bull/Bear Pressure inside it, and waits for a buffered close outside the box.
Order Block Mark price areas associated with prior institutional-style supply/demand concepts or displacement. Both can leave historical zones on the chart and both may become areas traders watch during later price interaction. Breakout Radar does not claim to identify institutional orders or actual order flow. Its boxes represent measured compression structures, not order blocks. Direction is assessed from price behaviour and pressure within the compression.
Support & Resistance Identify levels or zones where price has previously reacted, stalled, reversed, or broken. The top and bottom of a Breakout Radar box naturally act as temporary resistance and support while the compression remains active. Traditional S&R starts with reaction levels. Breakout Radar starts with volatility/structure compression and then adds pressure, bias, state progression and breakout confirmation.
Breakout Radar Identify compressed structures, measure directional pressure, and confirm expansion beyond a locked range. Uses price boundaries just as many classical technical tools do. Combines compression scoring, locked boxes, Bull/Bear Pressure, Pressure Delta, Bias, BUILDING/WATCH/ARMED states, ATR breakout confirmation and signal invalidation in one workflow.
1. Breakout Radar vs Range Filter
The closest visual comparison is a range filter because both can make consolidation and directional movement easy to see. But Breakout Radar is not designed to continuously filter price. Once a qualifying compression is found, the box is locked. The indicator then studies what is happening inside that fixed structure. A trader can therefore see whether pressure is building toward the upper boundary, the lower boundary, or neither.
Example: price may remain inside a ₹500-₹510 box while Bull Pressure rises from 52 to 79. A conventional range filter may simply continue tracking the range or trend. Breakout Radar can move from BUILDING to WATCH to ARMED while the price is still inside the box, and only confirms the bullish breakout after a close above the upper boundary plus the ATR confirmation buffer.
2. Breakout Radar vs Order Blocks
An order-block indicator normally attempts to identify a zone associated with an earlier impulsive move and treats that area as a possible future supply or demand zone. Breakout Radar does something different: the rectangle is created because the current market has compressed, not because the script is labelling an institutional order area.
The historical boxes may therefore look superficially similar to order-block zones, but their meaning is different. A green completed Breakout Radar box means a compression structure eventually resolved upward; a red completed box means it resolved downward. It should not be interpreted as proof that institutional buying or selling occurred inside that box.
3. Breakout Radar vs Support & Resistance
Support and resistance are still relevant to Breakout Radar. In fact, the lower and upper boundaries of an active compression naturally behave like short-term support and resistance. The difference is that those boundaries are only one layer of the analysis.
Breakout Radar also asks whether volatility is compressed, how frequently price is pressuring each boundary, where price is persisting inside the structure, whether the internal structure is squeezing in one direction, and whether the final candle behaviour supports that direction. These components feed the Bull Pressure, Bear Pressure, Pressure Delta and Bias readings.
Where They Can Be Used Together
These tools do not have to compete with one another. A trader may use higher-timeframe support/resistance or a separately identified order-block area for context, then use Breakout Radar on the execution timeframe to see whether price is compressing near that area and whether directional pressure is developing. Likewise, a range or trend tool can provide broader directional context while Breakout Radar focuses specifically on the compression-to-expansion phase.
A Simple Way to Remember the Difference
• Range Filter asks: Where is filtered price/trend moving?
• Order Block asks: Where is a previously significant supply/demand-style zone?
• Support & Resistance asks: Where has price reacted or may react again?
• Breakout Radar asks: Is price compressing now, which side is building pressure, and has expansion been confirmed?
This distinction is central to the TechnoBlooms concept: the box itself is not the signal. The information comes from the evolution of compression, pressure, bias and eventual breakout confirmation.
Suggested Workflow
1. Look for an active compression box rather than chasing price after an extended move.
2. Check whether the Radar is BUILDING, WATCH or ARMED.
3. Compare Bull Pressure and Bear Pressure, then confirm the Pressure Delta and Bias.
4. Treat ARMED as preparation, not confirmation.
5. Wait for a confirmed close beyond the relevant box boundary and confirmation buffer.
6. Use the breakout invalidation level together with your own risk-management process.
7. Confirm higher-timeframe structure, liquidity, market context and event risk before acting.
Important Notes
Breakout Radar does not predict that every compression will produce a successful breakout. Markets can generate false breaks, gaps, news-driven moves and rapid reversals. Pressure readings are analytical measurements derived from price behaviour; they are not exchange order-flow data.
The indicator does not provide profit targets or broker execution. This is intentional: Breakout Radar focuses on identifying compression, directional pressure, breakout confirmation and subsequent validity.
Recommended Markets & Timeframes
The concept can be applied to liquid equities, indices, futures, forex, commodities and crypto. Because volatility characteristics differ by instrument and timeframe, users should validate the default settings on the market they trade. Lower timeframes generally produce more setups and more noise; higher timeframes generally produce fewer but broader structures.
Alerts
Breakout Radar supports alert conditions for bullish ARMED, bearish ARMED, bullish breakout confirmation and bearish breakout confirmation. For live use, traders should configure TradingView alerts according to their preferred symbol, timeframe and confirmation workflow.
TradingView-Ready Short Description
Breakout Radar (TechnoBlooms) is a structure-first compression and breakout-pressure indicator designed to identify when a quiet market may be preparing for expansion. It combines volatility compression, locked price structures, Bull/Bear Pressure, Pressure Delta and directional Bias with progressive SCANNING → BUILDING → WATCH → ARMED states. Breakouts are confirmed only after price closes beyond the locked structure with an ATR-based buffer. The latest breakout signal remains visible while structurally valid, while completed compression boxes provide clean historical context. Breakout Radar is designed as a decision-support and market-structure tool rather than a standalone buy/sell system.
Disclaimer
For educational and analytical purposes only. This indicator does not constitute investment advice, a recommendation, or a guarantee of future performance. Trading and investing involve risk. Users should perform their own analysis and apply appropriate risk management before making trading decisions.
Compression • Pressure • Bias • Breakout Confirmation
A structure-first breakout analysis tool designed to identify when quiet price action is building toward a directional move.
Overview
Breakout Radar is a price-compression and breakout-pressure indicator developed by TechnoBlooms. Instead of simply marking every new high or low as a breakout, it first looks for a compressed market structure, measures the pressure developing inside that structure, identifies directional bias, and then waits for price to confirm a break beyond the locked range.
The objective is simple: help traders distinguish between ordinary sideways movement and a consolidation that may be preparing for expansion. The indicator is designed as a decision-support tool, not as an automatic buy/sell system.
What Makes Breakout Radar Different?
Compression first: The system searches for contraction in volatility and price structure before considering a breakout.
Locked structure boxes: Once a qualifying compression is detected, its boundaries are locked instead of continuously following price like a conventional range filter.
Bull vs Bear Pressure: The indicator evaluates how price is behaving near the upper and lower boundaries and converts that behaviour into separate Bull Pressure and Bear Pressure readings.
Pressure Delta and Bias: The difference between bullish and bearish pressure helps identify whether the structure is leaning BULLISH, BEARISH or remains NEUTRAL.
Progressive radar states: The setup develops through SCANNING, BUILDING, WATCH and ARMED states rather than jumping immediately to a signal.
Confirmed breakout: A breakout requires price to close beyond the locked structure with an ATR-based confirmation buffer.
Signal validity buffer: After confirmation, the latest breakout signal can remain valid through a normal retest and is removed only when its stored invalidation level is breached or a newer breakout replaces it.
Clean historical context: Completed compression structures remain faintly visible so traders can study how earlier consolidations resolved, while overlap filtering reduces unnecessary nested boxes.
How to Read the Dashboard
Dashboard Item Interpretation
Compression Measures how strongly the current market is contracting. Higher values indicate tighter compression relative to recent conditions.
Bull Pressure Measures bullish pressure developing inside the active structure.
Bear Pressure Measures bearish pressure developing inside the active structure.
Pressure Delta Bull Pressure minus Bear Pressure. A positive value favours bulls; a negative value favours bears.
Bias Summarises the current directional pressure as BULLISH, BEARISH or NEUTRAL.
Radar State SCANNING = no active setup; BUILDING = compression found; WATCH = pressure is becoming meaningful; ARMED = pressure and compression have reached stronger conditions.
Understanding the Radar States
SCANNING — The indicator is monitoring the market, but no qualifying compression structure is currently active.
BUILDING — A compression structure has been identified. Pressure is developing, but the setup is not yet strong enough to demand close attention.
WATCH — Pressure has strengthened. Traders may begin watching the box boundaries and directional bias more closely.
ARMED — Compression and directional pressure have reached stronger conditions. This does not mean a breakout has already happened; it means the structure deserves heightened attention.
How the Breakout Signal Works
A bullish breakout is considered confirmed when price closes above the locked upper boundary plus the configured ATR confirmation buffer and bullish pressure is stronger than bearish pressure. A bearish breakout uses the opposite logic below the lower boundary.
Only the latest relevant breakout arrow is retained. The arrow is intentionally small so the chart remains focused on structure rather than becoming filled with historical signal markers.
The signal is not automatically removed after a fixed number of candles. At the moment of confirmation, Breakout Radar stores an ATR-based invalidation level. This allows price to perform a normal retest without immediately cancelling the breakout. The signal disappears when the breakout is invalidated or when a newer confirmed breakout replaces it.
Example 1 — Bullish Compression Breakout
Assume a stock trades sideways between ₹980 and ₹1,000 while volatility contracts. Breakout Radar identifies the compression and locks a box around the structure. As price repeatedly tests the upper portion of the box, Bull Pressure rises from 48 to 64 and then to 78, while Bear Pressure remains near 42.
The dashboard may progress from BUILDING → WATCH → ARMED with a BULLISH bias. If price subsequently closes above the upper boundary plus the breakout confirmation buffer, a small bullish arrow appears. A minor pullback toward the breakout area does not automatically remove the signal; it remains valid until the stored bullish invalidation level is breached.
Example 2 — Bearish Compression Breakout
Imagine an index consolidating between 24,800 and 25,000. During the consolidation, repeated pressure develops near the lower boundary. Bear Pressure increases to 81 while Bull Pressure falls to 51, producing a negative Pressure Delta and a BEARISH bias.
Once price closes below the locked lower boundary with the required ATR buffer, the bearish breakout is confirmed and a small downward arrow appears. The completed compression box remains on the chart as historical context while the Radar is free to scan independently for the next compression structure.
Example 3 — Why ARMED Is Not the Same as BUY or SELL
Suppose Compression is 76, Bull Pressure is 80 and Bear Pressure is 49. The Radar can show ARMED with a BULLISH bias even though price is still inside the box. This is an early-warning condition, not a trade confirmation. If price fails to break the upper boundary and pressure weakens, the setup can remain inside the structure or change bias. The breakout arrow appears only after the actual confirmation condition is met.
Reading the Boxes
The rectangles represent detected compression structures. The active structure is used for live pressure and breakout analysis. After a breakout, the completed box can remain lightly visible to show where the expansion originated. An overlap filter is used to reduce repeated boxes representing substantially the same price structure.
How Breakout Radar Compares with Other Popular Tools
Breakout Radar shares some visual ideas with range filters, order blocks, and support/resistance tools because all of them study how price behaves around important areas. The similarity, however, is mainly in the chart structure. Breakout Radar is built for a different question: is the market compressing, which side is applying more pressure, and has that compression actually expanded into a confirmed breakout?
Tool Main Purpose Similarity Key Difference
Range Filter Smooth price noise and identify directional movement or a filtered trading range. Both may show boundaries around price and can help traders recognise a transition from sideways movement to expansion. A range filter usually moves or recalculates with price. Breakout Radar first detects compression, locks the structure, measures Bull/Bear Pressure inside it, and waits for a buffered close outside the box.
Order Block Mark price areas associated with prior institutional-style supply/demand concepts or displacement. Both can leave historical zones on the chart and both may become areas traders watch during later price interaction. Breakout Radar does not claim to identify institutional orders or actual order flow. Its boxes represent measured compression structures, not order blocks. Direction is assessed from price behaviour and pressure within the compression.
Support & Resistance Identify levels or zones where price has previously reacted, stalled, reversed, or broken. The top and bottom of a Breakout Radar box naturally act as temporary resistance and support while the compression remains active. Traditional S&R starts with reaction levels. Breakout Radar starts with volatility/structure compression and then adds pressure, bias, state progression and breakout confirmation.
Breakout Radar Identify compressed structures, measure directional pressure, and confirm expansion beyond a locked range. Uses price boundaries just as many classical technical tools do. Combines compression scoring, locked boxes, Bull/Bear Pressure, Pressure Delta, Bias, BUILDING/WATCH/ARMED states, ATR breakout confirmation and signal invalidation in one workflow.
1. Breakout Radar vs Range Filter
The closest visual comparison is a range filter because both can make consolidation and directional movement easy to see. But Breakout Radar is not designed to continuously filter price. Once a qualifying compression is found, the box is locked. The indicator then studies what is happening inside that fixed structure. A trader can therefore see whether pressure is building toward the upper boundary, the lower boundary, or neither.
Example: price may remain inside a ₹500-₹510 box while Bull Pressure rises from 52 to 79. A conventional range filter may simply continue tracking the range or trend. Breakout Radar can move from BUILDING to WATCH to ARMED while the price is still inside the box, and only confirms the bullish breakout after a close above the upper boundary plus the ATR confirmation buffer.
2. Breakout Radar vs Order Blocks
An order-block indicator normally attempts to identify a zone associated with an earlier impulsive move and treats that area as a possible future supply or demand zone. Breakout Radar does something different: the rectangle is created because the current market has compressed, not because the script is labelling an institutional order area.
The historical boxes may therefore look superficially similar to order-block zones, but their meaning is different. A green completed Breakout Radar box means a compression structure eventually resolved upward; a red completed box means it resolved downward. It should not be interpreted as proof that institutional buying or selling occurred inside that box.
3. Breakout Radar vs Support & Resistance
Support and resistance are still relevant to Breakout Radar. In fact, the lower and upper boundaries of an active compression naturally behave like short-term support and resistance. The difference is that those boundaries are only one layer of the analysis.
Breakout Radar also asks whether volatility is compressed, how frequently price is pressuring each boundary, where price is persisting inside the structure, whether the internal structure is squeezing in one direction, and whether the final candle behaviour supports that direction. These components feed the Bull Pressure, Bear Pressure, Pressure Delta and Bias readings.
Where They Can Be Used Together
These tools do not have to compete with one another. A trader may use higher-timeframe support/resistance or a separately identified order-block area for context, then use Breakout Radar on the execution timeframe to see whether price is compressing near that area and whether directional pressure is developing. Likewise, a range or trend tool can provide broader directional context while Breakout Radar focuses specifically on the compression-to-expansion phase.
A Simple Way to Remember the Difference
• Range Filter asks: Where is filtered price/trend moving?
• Order Block asks: Where is a previously significant supply/demand-style zone?
• Support & Resistance asks: Where has price reacted or may react again?
• Breakout Radar asks: Is price compressing now, which side is building pressure, and has expansion been confirmed?
This distinction is central to the TechnoBlooms concept: the box itself is not the signal. The information comes from the evolution of compression, pressure, bias and eventual breakout confirmation.
Suggested Workflow
1. Look for an active compression box rather than chasing price after an extended move.
2. Check whether the Radar is BUILDING, WATCH or ARMED.
3. Compare Bull Pressure and Bear Pressure, then confirm the Pressure Delta and Bias.
4. Treat ARMED as preparation, not confirmation.
5. Wait for a confirmed close beyond the relevant box boundary and confirmation buffer.
6. Use the breakout invalidation level together with your own risk-management process.
7. Confirm higher-timeframe structure, liquidity, market context and event risk before acting.
Important Notes
Breakout Radar does not predict that every compression will produce a successful breakout. Markets can generate false breaks, gaps, news-driven moves and rapid reversals. Pressure readings are analytical measurements derived from price behaviour; they are not exchange order-flow data.
The indicator does not provide profit targets or broker execution. This is intentional: Breakout Radar focuses on identifying compression, directional pressure, breakout confirmation and subsequent validity.
Recommended Markets & Timeframes
The concept can be applied to liquid equities, indices, futures, forex, commodities and crypto. Because volatility characteristics differ by instrument and timeframe, users should validate the default settings on the market they trade. Lower timeframes generally produce more setups and more noise; higher timeframes generally produce fewer but broader structures.
Alerts
Breakout Radar supports alert conditions for bullish ARMED, bearish ARMED, bullish breakout confirmation and bearish breakout confirmation. For live use, traders should configure TradingView alerts according to their preferred symbol, timeframe and confirmation workflow.
TradingView-Ready Short Description
Breakout Radar (TechnoBlooms) is a structure-first compression and breakout-pressure indicator designed to identify when a quiet market may be preparing for expansion. It combines volatility compression, locked price structures, Bull/Bear Pressure, Pressure Delta and directional Bias with progressive SCANNING → BUILDING → WATCH → ARMED states. Breakouts are confirmed only after price closes beyond the locked structure with an ATR-based buffer. The latest breakout signal remains visible while structurally valid, while completed compression boxes provide clean historical context. Breakout Radar is designed as a decision-support and market-structure tool rather than a standalone buy/sell system.
Disclaimer
For educational and analytical purposes only. This indicator does not constitute investment advice, a recommendation, or a guarantee of future performance. Trading and investing involve risk. Users should perform their own analysis and apply appropriate risk management before making trading decisions.

Declinazione di responsabilità
Le informazioni e le pubblicazioni non sono intese come, e non costituiscono, consulenza o raccomandazioni finanziarie, di investimento, di trading o di altro tipo fornite o approvate da TradingView. Per ulteriori informazioni, consultare i Termini di utilizzo.
Declinazione di responsabilità
Le informazioni e le pubblicazioni non sono intese come, e non costituiscono, consulenza o raccomandazioni finanziarie, di investimento, di trading o di altro tipo fornite o approvate da TradingView. Per ulteriori informazioni, consultare i Termini di utilizzo.