IV Rank and Base Breakout Screener for Covered Calls [tfox2791]
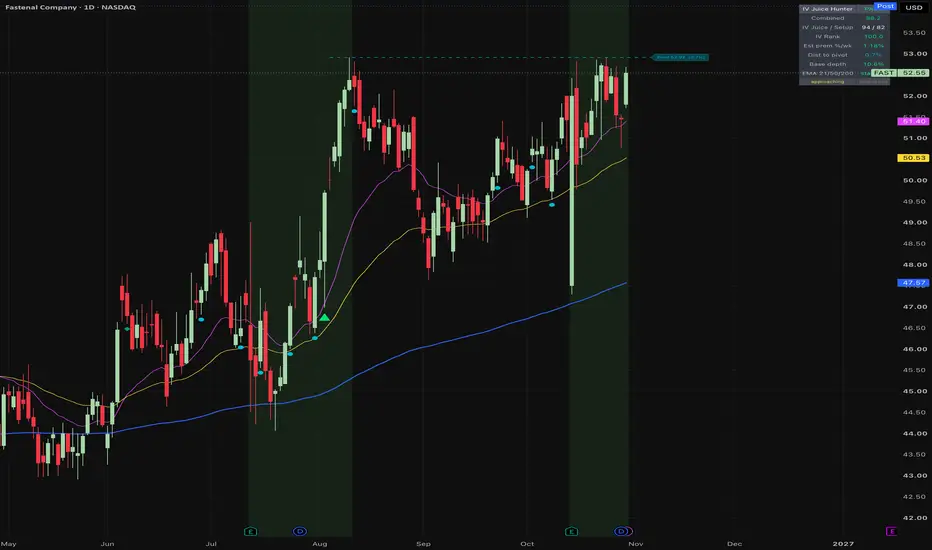
WHAT THIS IS
A screener and chart overlay for covered-call and short-premium writers. It looks for one specific coincidence: a stock whose option premium is rich relative to its own history, that is simultaneously sitting in a constructive base near a breakout pivot, and that is actually tradeable - liquid enough, priced high enough, and with weekly contracts available.
It is built for the Pine Screener on a Daily chart, and it also draws its reasoning on the chart so you can check a name by eye before you trust the row.
WHY NOT JUST SORT A LIST BY IMPLIED VOLATILITY
Two reasons, and they are the reason this script exists rather than being a one-line IV sort.
First, raw IV leaders are adverse selection. A name sits at the top of a raw-IV list because something binary is scheduled or already going wrong: earnings, a trial result, a deal, or a collapse. Selling premium into that is selling a lottery ticket for its fair price while keeping the tail.
Second, and more concretely: at a fixed delta, premium and risk scale together. Both the Black-Scholes premium and the 1-sigma expected move are proportional to sigma * sqrt(T), so their ratio is scale-invariant. In this script's own output the "Prem/risk ratio" column sits at roughly 0.18 at 0.30 delta whether the stock's volatility is 30% or 90%. Hunting higher volatility at a fixed delta buys you more income per dollar of capital deployed - it does not buy a better trade.
That is a mathematical property, not a market opinion, and it is what the ranking is designed around. The script therefore ranks on IV RANK (how rich volatility is versus its own trailing year, which mean-reverts) combined with chart structure, rather than on the raw volatility level.
HOW IT WORKS
There is no implied volatility available in Pine Script, so the volatility side is built from realized volatility and stated as a proxy throughout. The pipeline:
REALIZED VOLATILITY from raw log returns, annualized. Four estimators are selectable. The default is Yang-Zhang because it is the only common one of the four that incorporates the overnight gap term, and in single stocks a large share of the actual variance arrives between the close and the next open. Parkinson (high-low), Garman-Klass (high-low-open-close) and simple close-to-close are also available. The Garman-Klass mean is clamped at zero before the square root because the estimator can return a slightly negative variance on quiet bars.
AN IV PROXY, formed by scaling realized volatility by a user multiplier. This stands in for the variance risk premium: options habitually trade above realized volatility, and 1.10 to 1.25 is a typical range for liquid names. The product is what every volatility column reports.
Worth knowing before you tune it: this multiplier does not move IV Rank at all. A positive constant cancels out of (x - min) / (max - min). Use it to calibrate the premium estimates in dollars and percent; it will not shift your IV Rank filter by a basis point.
IV RANK and IV PERCENTILE of that proxy against its own trailing window (252 bars by default, one trading year). Rank is where today sits between the window's low and high. Percentile is the share of the window spent below today. They answer different questions, and percentile is less distorted by a single historic volatility spike, so both are reported.
A PREMIUM ESTIMATE via Black-Scholes, with the normal CDF and inverse normal CDF implemented natively in Pine (Abramowitz and Stegun 7.1.26 for the error function; Beasley-Springer-Moro central region for the inverse). Interest rate and dividend yield are both set to zero, which is immaterial at the 7-day default and is a real approximation at longer expiries on a high-yield name.
Rather than asking you for a strike, the script inverts your target delta to get the strike the market would assign that delta, then prices the call at it. So you set "0.30 delta, 7 days" and read back an estimated premium as a percent of spot, as dollars per 100-share contract, and how far out of the money that strike sits.
For orientation, the formula's output at 7 days, 0.30 delta and a 1.15 multiplier: about 1.0% of spot at 35% volatility, about 1.5% at 50%, and about 2.0% at 70%. Those are deterministic outputs of the pricing formula applied to a realized-volatility proxy. They are not a forecast of income, and they are not a quote.
TREND STRUCTURE. Three EMAs, 21 / 50 / 200 by default. The script reports the stack (21 > 50 > 200) as a state, how many bars it has held, and the spread from fast to slow, since a widening stack is a trending one. Separately it enforces a hard price gate you choose: above the 50, above the 200, above either, above both, or off. It also flags the configuration a premium writer most needs to avoid - price below the 50 with the 50 below the 200, labelled "Falling knife".
BASE AND PIVOT, in IBD vocabulary. The pivot is the highest high of the base lookback EXCLUDING the current bar, so a breakout reads as price crossing a level that was fixed before the bar began. Base depth is measured pivot to low; the usual rough guides are 15% or less for a flat base and 33% or less for a cup, on the reasoning that a deeper hole is repaired damage rather than accumulation. Distance to the pivot is the headline number: how far below the breakout price the stock is now. Three states are flagged - approaching (inside your window below the pivot), in the buy zone (0 to 5% past it), and broken out on the current bar.
TIGHTNESS AND VOLUME. Recent range as a percent of price, where contraction ahead of a breakout is the conventional supply-drying-up tell, and current volume as a multiple of its average, where roughly 1.4x is the usual guideline for a breakout bar.
HARD SCREENS, which are the practical tradeability filters: minimum share price (default 15), minimum average daily share volume (default 1,000,000), a minimum IV Rank, the trend gate, no falling knife, no earnings inside a window you set, and weekly contracts available. "All screens pass" folds every one of those into a single flag.
WEEKLY CONTRACTS - READ THIS ONE
Pine Script has no access to options metadata. It cannot know which symbols have weekly expiries. There is no way around that, so the check is explicit about which method you have chosen:
"Off" assumes you curated the watchlist yourself. The Pine Screener runs on a watchlist, so building one from the published weeklies list solves the problem exactly, once, with no script logic. This is the accurate option.
"Ticker list" matches against symbols you paste into a text input (commas, spaces or newlines all work). Also exact, for whatever you paste. The list is comma-fenced before matching so a substring cannot hit a partial ticker. The seed list shipped in the input is obvious large caps only and is meant to be replaced.
"Dollar volume proxy" is the default because it needs no maintenance. It assumes weekly contracts track institutional dollar volume, which they broadly do. It is an approximation and it will produce both false positives and false negatives at the edges.
SCORING
Two scores, kept separate so you can see which half of the thesis is carrying a row, plus a blend.
IV JUICE (0-100) = 40 points IV Rank + 30 points premium versus your weekly target (capped at 1.5x target) + 15 points dollar liquidity + 15 points trend.
SETUP (0-100) = 30 points EMA stack + 25 points proximity to pivot + 20 points base quality + 15 points tightness + 10 points volume surge.
COMBINED SCORE blends them at a weight you set, defaulting to 55% IV / 45% setup. Sort descending on Combined Score; that is the ranked answer.
These weights are a disclosed judgement about what matters, not an optimised or backtested fit. They are exposed in the source and the blend weight is an input so you can disagree with them. A worked consequence of the design: a clean base at IV Rank 65 scores above a collapsing stock at IV Rank 95, which is the intended behaviour and the whole point of not ranking on raw volatility.
HOW TO USE IT IN THE PINE SCREENER
Add the script to your favourites, then open the Screener and switch to the Pine tab and select it.
Choose a watchlist and the Daily timeframe.
Sort descending on "Combined Score".
Filter. The quickest version is "All screens pass" = 1. To build it up yourself, the gate columns are "Price OK", "Liquidity OK", "Weeklies OK", "IV rank OK", "Funds target", "EMA gate OK", with "Falling knife" = 0 and "Earnings soon" = 0.
For the setup hunt specifically: "Approaching pivot" = 1 for names coiled under the pivot, "In buy zone" = 1 for actionable ones, "Breakout today" = 1 for the event itself, "EMA stacked" = 1 for the strict trend configuration.
Then stack quality with the numeric columns: "Dist to pivot %" between 0 and 5, lower "Base depth %", lower "Tightness %", "Vol surge x" at 1.4 or above on a breakout bar, higher "Avg $ vol (M)" for tighter spreads in the real chain.
INPUTS
Volatility engine
Realized vol estimator: Yang-Zhang (default), Parkinson, Garman-Klass, Close-to-Close.
Vol lookback (bars), default 21: the window the estimator measures over.
IV premium multiplier, default 1.15: the variance risk premium scale factor. Does not affect IV Rank.
IV Rank / Percentile window (bars), default 252: one trading year.
Option pricing
Days to expiry (calendar), default 7.
Target call delta, default 0.30: 0.50 is at the money. Clamped to 0.10-0.50, which keeps the inverse normal CDF inside its valid central region.
Weekly premium target (%), default 1.0: the bar the premium estimate is scored against, and the threshold behind "Funds target".
Trend structure
EMA fast / mid / slow, defaults 21 / 50 / 200.
Price gate, default "Above either 50 or 200": the hard trend requirement folded into "All screens pass". Other choices are above both, above 50 only, above 200 only, or off.
Also require EMAs stacked, default off: makes 21 > 50 > 200 a gate rather than just a ranking input. Strict.
Base and breakout
Base lookback (bars), default 60: about a 12-week base on Daily. Sets the pivot.
Max base depth (%), default 33: the pivot-to-low limit behind "Base OK".
Approaching pivot window (%), default 5: how far under the pivot still counts as coiled.
Buy zone above pivot (%), default 5: the actionable range past the pivot.
Tightness lookback (bars), default 10.
Breakout volume surge (x avg), default 1.4.
Hard screens
Min share price ($), default 15.
Min avg daily volume (shares), default 1,000,000.
Volume average length, default 50.
Min IV Rank, default 50.
Earnings warning window (days), default 7.
Weekly contracts
Weekly-options check: Dollar volume proxy (default), Ticker list, or Off.
Proxy minimum average dollar volume (MM/DAY), default 50.
Weekly-options ticker list: used only in Ticker list mode.
Scoring
IV weight in Combined Score (%), default 55. The remainder goes to Setup.
Display
Independent toggles for the EMAs, the pivot line and label, the breakout and buy-zone markers, the readout table, and the pass highlight.
READING THE CHART
Three EMAs: 21 in fuchsia, 50 in yellow, 200 in blue and thicker.
A dashed horizontal line at the pivot with a label giving the pivot price and the current distance to it. It is grey normally, aqua when the stock is inside the approach window, and lime when it is in the buy zone.
Markers below the bar, by shape: a lime triangle up for a breakout on that bar, a small aqua circle on the bar the stock entered the approach window, a teal diamond on the bar the EMA stack formed.
A faint green background on bars where every screen passes.
A readout table in the top right: pass state, Combined score, the IV and Setup scores side by side, IV Rank, estimated weekly premium percent, distance to pivot, base depth, the EMA configuration in words, and a status line reading in buy zone, breakout, approaching, or watch. Cells are coloured lime, yellow or red against the relevant threshold, and grey when the value is unavailable.
DATA WINDOW COLUMNS
All 1/0 flags and numeric readouts are plotted to the Data Window rather than the price scale, so they stay available to the Screener without distorting the chart.
Gate flags: All screens pass, Price OK, Liquidity OK, Weeklies OK, IV rank OK, Funds target, EMA gate OK, EMA stacked, Above 50 EMA, Above 200 EMA, Falling knife, Earnings soon.
Setup flags: Breakout today, In buy zone, Approaching pivot, Base OK, Vol surge OK.
Ranking: Combined Score, IV Juice Score, Setup Score.
Volatility and premium: IV Rank, IV Percentile, IV proxy %, Realized vol %, Est prem % (delta), Est prem % (ATM), Prem $/contract, Strike % OTM, 1-sigma move %, Prem/risk ratio, Vol ratio fast/slow (10-bar versus the main lookback - above 1 means volatility is picking up).
Setup numerics: Dist to pivot % (positive means below the pivot), Pivot price, Base depth %, Bars since high, Tightness %, Vol surge x, Stack gap %, Stack age (bars), Ext vs 21EMA %, Avg $ vol (M).
ALERTS
Two conditions, both gated on a confirmed bar so they do not fire intrabar: "coiled under pivot" (all screens pass and approaching) and "breakout today" (all screens pass and the pivot was crossed).
REPAINTING
Stated plainly:
HISTORICAL BARS DO NOT REPAINT. No request.security() is used anywhere, so there is no higher-timeframe lookahead. The pivot is taken from the previous bar's highest high, so it is fixed before the current bar opens.
THE LIVE, UNCLOSED BAR DOES UPDATE. Every close-based value - the breakout flag, the buy-zone flag, the premium estimates, both scores - recalculates tick by tick until the bar closes, which is normal for close-based logic. Judge a signal on the closed bar.
Both alert conditions require barstate.isconfirmed, so alerts only fire on closed bars.
The pivot line, label and table are redrawn on the last bar only.
LIMITATIONS
THERE IS NO IMPLIED VOLATILITY IN PINE. Every volatility column here is realized volatility scaled by a constant. It is a reasonable ranking signal and a poor quote. Confirm the real chain and the real IV before placing anything.
THERE IS NO OPTIONS METADATA IN PINE EITHER. See the weeklies section - two of the three modes are exact only because you supply the list.
Realized volatility is backward-looking by construction. It understates volatility going into a scheduled event and overstates it coming out. That is what the earnings column is for.
"Earnings soon" is blank, not zero, when the data feed supplies no upcoming earnings date. Blank means unknown, not safe. It reflects the currently known schedule, so treat it as a live screening aid rather than a historical field.
Base detection is a highest-high pivot, not pattern recognition. It cannot tell a cup with handle from a flat base from a messy consolidation. Depth, age and tightness are reported so you can make that judgement on the chart yourself. Treat the output as a shortlist, not a verdict.
DATA DEPTH. IV Rank needs roughly 273 daily bars (252 rank window plus the 21-bar volatility lookback) and the 200 EMA needs 200. These columns are structurally blank on young listings and on low timeframes. Run this on Daily.
Black-Scholes here uses r = 0 and q = 0. Negligible at 7 days, a real approximation at 60 days on a high-dividend name.
The error function approximation is accurate to about 7e-8. The inverse normal CDF is a central-region approximation, which is why the delta input is clamped to 0.10-0.50 rather than allowing deep out-of-the-money deltas.
The scoring weights are a disclosed judgement, not an optimised fit.
WHY THIS IS NOT A MASHUP
The components are individually standard. What is not standard is the specific question they are combined to answer, and the combination is not arbitrary - each piece exists to fix a defect in the piece before it.
A volatility estimator alone gives you a number with no reference point, so IV Rank puts it against its own history. IV Rank alone cannot tell you whether the premium is worth the capital, so Black-Scholes at a target delta converts volatility into a comparable percent-of-spot figure against a weekly income target. A premium figure alone ranks falling knives at the top, because collapsing stocks have the richest volatility, so the trend and base structure exist specifically to exclude them. And all of that is useless on a name you cannot actually trade, which is what the price, share-volume and weekly-contract screens are for.
The scale-invariance result described above is the specific reason the ranking is built on IV Rank plus structure rather than on the volatility level, which is what a straightforward combination of these indicators would have done.
Delta-inverted strike selection, a natively implemented normal and inverse normal CDF, and an explicit disclosure that the volatility input is a realized-vol proxy rather than quoted IV are the parts I have not seen packaged together as a screener.
NOT ADVICE
This is an analysis tool. It does not quote options, it does not price your fills, and nothing in it is a recommendation or a prediction. Verify every number against the real chain before you trade.
A screener and chart overlay for covered-call and short-premium writers. It looks for one specific coincidence: a stock whose option premium is rich relative to its own history, that is simultaneously sitting in a constructive base near a breakout pivot, and that is actually tradeable - liquid enough, priced high enough, and with weekly contracts available.
It is built for the Pine Screener on a Daily chart, and it also draws its reasoning on the chart so you can check a name by eye before you trust the row.
WHY NOT JUST SORT A LIST BY IMPLIED VOLATILITY
Two reasons, and they are the reason this script exists rather than being a one-line IV sort.
First, raw IV leaders are adverse selection. A name sits at the top of a raw-IV list because something binary is scheduled or already going wrong: earnings, a trial result, a deal, or a collapse. Selling premium into that is selling a lottery ticket for its fair price while keeping the tail.
Second, and more concretely: at a fixed delta, premium and risk scale together. Both the Black-Scholes premium and the 1-sigma expected move are proportional to sigma * sqrt(T), so their ratio is scale-invariant. In this script's own output the "Prem/risk ratio" column sits at roughly 0.18 at 0.30 delta whether the stock's volatility is 30% or 90%. Hunting higher volatility at a fixed delta buys you more income per dollar of capital deployed - it does not buy a better trade.
That is a mathematical property, not a market opinion, and it is what the ranking is designed around. The script therefore ranks on IV RANK (how rich volatility is versus its own trailing year, which mean-reverts) combined with chart structure, rather than on the raw volatility level.
HOW IT WORKS
There is no implied volatility available in Pine Script, so the volatility side is built from realized volatility and stated as a proxy throughout. The pipeline:
REALIZED VOLATILITY from raw log returns, annualized. Four estimators are selectable. The default is Yang-Zhang because it is the only common one of the four that incorporates the overnight gap term, and in single stocks a large share of the actual variance arrives between the close and the next open. Parkinson (high-low), Garman-Klass (high-low-open-close) and simple close-to-close are also available. The Garman-Klass mean is clamped at zero before the square root because the estimator can return a slightly negative variance on quiet bars.
AN IV PROXY, formed by scaling realized volatility by a user multiplier. This stands in for the variance risk premium: options habitually trade above realized volatility, and 1.10 to 1.25 is a typical range for liquid names. The product is what every volatility column reports.
Worth knowing before you tune it: this multiplier does not move IV Rank at all. A positive constant cancels out of (x - min) / (max - min). Use it to calibrate the premium estimates in dollars and percent; it will not shift your IV Rank filter by a basis point.
IV RANK and IV PERCENTILE of that proxy against its own trailing window (252 bars by default, one trading year). Rank is where today sits between the window's low and high. Percentile is the share of the window spent below today. They answer different questions, and percentile is less distorted by a single historic volatility spike, so both are reported.
A PREMIUM ESTIMATE via Black-Scholes, with the normal CDF and inverse normal CDF implemented natively in Pine (Abramowitz and Stegun 7.1.26 for the error function; Beasley-Springer-Moro central region for the inverse). Interest rate and dividend yield are both set to zero, which is immaterial at the 7-day default and is a real approximation at longer expiries on a high-yield name.
Rather than asking you for a strike, the script inverts your target delta to get the strike the market would assign that delta, then prices the call at it. So you set "0.30 delta, 7 days" and read back an estimated premium as a percent of spot, as dollars per 100-share contract, and how far out of the money that strike sits.
For orientation, the formula's output at 7 days, 0.30 delta and a 1.15 multiplier: about 1.0% of spot at 35% volatility, about 1.5% at 50%, and about 2.0% at 70%. Those are deterministic outputs of the pricing formula applied to a realized-volatility proxy. They are not a forecast of income, and they are not a quote.
TREND STRUCTURE. Three EMAs, 21 / 50 / 200 by default. The script reports the stack (21 > 50 > 200) as a state, how many bars it has held, and the spread from fast to slow, since a widening stack is a trending one. Separately it enforces a hard price gate you choose: above the 50, above the 200, above either, above both, or off. It also flags the configuration a premium writer most needs to avoid - price below the 50 with the 50 below the 200, labelled "Falling knife".
BASE AND PIVOT, in IBD vocabulary. The pivot is the highest high of the base lookback EXCLUDING the current bar, so a breakout reads as price crossing a level that was fixed before the bar began. Base depth is measured pivot to low; the usual rough guides are 15% or less for a flat base and 33% or less for a cup, on the reasoning that a deeper hole is repaired damage rather than accumulation. Distance to the pivot is the headline number: how far below the breakout price the stock is now. Three states are flagged - approaching (inside your window below the pivot), in the buy zone (0 to 5% past it), and broken out on the current bar.
TIGHTNESS AND VOLUME. Recent range as a percent of price, where contraction ahead of a breakout is the conventional supply-drying-up tell, and current volume as a multiple of its average, where roughly 1.4x is the usual guideline for a breakout bar.
HARD SCREENS, which are the practical tradeability filters: minimum share price (default 15), minimum average daily share volume (default 1,000,000), a minimum IV Rank, the trend gate, no falling knife, no earnings inside a window you set, and weekly contracts available. "All screens pass" folds every one of those into a single flag.
WEEKLY CONTRACTS - READ THIS ONE
Pine Script has no access to options metadata. It cannot know which symbols have weekly expiries. There is no way around that, so the check is explicit about which method you have chosen:
"Off" assumes you curated the watchlist yourself. The Pine Screener runs on a watchlist, so building one from the published weeklies list solves the problem exactly, once, with no script logic. This is the accurate option.
"Ticker list" matches against symbols you paste into a text input (commas, spaces or newlines all work). Also exact, for whatever you paste. The list is comma-fenced before matching so a substring cannot hit a partial ticker. The seed list shipped in the input is obvious large caps only and is meant to be replaced.
"Dollar volume proxy" is the default because it needs no maintenance. It assumes weekly contracts track institutional dollar volume, which they broadly do. It is an approximation and it will produce both false positives and false negatives at the edges.
SCORING
Two scores, kept separate so you can see which half of the thesis is carrying a row, plus a blend.
IV JUICE (0-100) = 40 points IV Rank + 30 points premium versus your weekly target (capped at 1.5x target) + 15 points dollar liquidity + 15 points trend.
SETUP (0-100) = 30 points EMA stack + 25 points proximity to pivot + 20 points base quality + 15 points tightness + 10 points volume surge.
COMBINED SCORE blends them at a weight you set, defaulting to 55% IV / 45% setup. Sort descending on Combined Score; that is the ranked answer.
These weights are a disclosed judgement about what matters, not an optimised or backtested fit. They are exposed in the source and the blend weight is an input so you can disagree with them. A worked consequence of the design: a clean base at IV Rank 65 scores above a collapsing stock at IV Rank 95, which is the intended behaviour and the whole point of not ranking on raw volatility.
HOW TO USE IT IN THE PINE SCREENER
Add the script to your favourites, then open the Screener and switch to the Pine tab and select it.
Choose a watchlist and the Daily timeframe.
Sort descending on "Combined Score".
Filter. The quickest version is "All screens pass" = 1. To build it up yourself, the gate columns are "Price OK", "Liquidity OK", "Weeklies OK", "IV rank OK", "Funds target", "EMA gate OK", with "Falling knife" = 0 and "Earnings soon" = 0.
For the setup hunt specifically: "Approaching pivot" = 1 for names coiled under the pivot, "In buy zone" = 1 for actionable ones, "Breakout today" = 1 for the event itself, "EMA stacked" = 1 for the strict trend configuration.
Then stack quality with the numeric columns: "Dist to pivot %" between 0 and 5, lower "Base depth %", lower "Tightness %", "Vol surge x" at 1.4 or above on a breakout bar, higher "Avg $ vol (M)" for tighter spreads in the real chain.
INPUTS
Volatility engine
Realized vol estimator: Yang-Zhang (default), Parkinson, Garman-Klass, Close-to-Close.
Vol lookback (bars), default 21: the window the estimator measures over.
IV premium multiplier, default 1.15: the variance risk premium scale factor. Does not affect IV Rank.
IV Rank / Percentile window (bars), default 252: one trading year.
Option pricing
Days to expiry (calendar), default 7.
Target call delta, default 0.30: 0.50 is at the money. Clamped to 0.10-0.50, which keeps the inverse normal CDF inside its valid central region.
Weekly premium target (%), default 1.0: the bar the premium estimate is scored against, and the threshold behind "Funds target".
Trend structure
EMA fast / mid / slow, defaults 21 / 50 / 200.
Price gate, default "Above either 50 or 200": the hard trend requirement folded into "All screens pass". Other choices are above both, above 50 only, above 200 only, or off.
Also require EMAs stacked, default off: makes 21 > 50 > 200 a gate rather than just a ranking input. Strict.
Base and breakout
Base lookback (bars), default 60: about a 12-week base on Daily. Sets the pivot.
Max base depth (%), default 33: the pivot-to-low limit behind "Base OK".
Approaching pivot window (%), default 5: how far under the pivot still counts as coiled.
Buy zone above pivot (%), default 5: the actionable range past the pivot.
Tightness lookback (bars), default 10.
Breakout volume surge (x avg), default 1.4.
Hard screens
Min share price ($), default 15.
Min avg daily volume (shares), default 1,000,000.
Volume average length, default 50.
Min IV Rank, default 50.
Earnings warning window (days), default 7.
Weekly contracts
Weekly-options check: Dollar volume proxy (default), Ticker list, or Off.
Proxy minimum average dollar volume (MM/DAY), default 50.
Weekly-options ticker list: used only in Ticker list mode.
Scoring
IV weight in Combined Score (%), default 55. The remainder goes to Setup.
Display
Independent toggles for the EMAs, the pivot line and label, the breakout and buy-zone markers, the readout table, and the pass highlight.
READING THE CHART
Three EMAs: 21 in fuchsia, 50 in yellow, 200 in blue and thicker.
A dashed horizontal line at the pivot with a label giving the pivot price and the current distance to it. It is grey normally, aqua when the stock is inside the approach window, and lime when it is in the buy zone.
Markers below the bar, by shape: a lime triangle up for a breakout on that bar, a small aqua circle on the bar the stock entered the approach window, a teal diamond on the bar the EMA stack formed.
A faint green background on bars where every screen passes.
A readout table in the top right: pass state, Combined score, the IV and Setup scores side by side, IV Rank, estimated weekly premium percent, distance to pivot, base depth, the EMA configuration in words, and a status line reading in buy zone, breakout, approaching, or watch. Cells are coloured lime, yellow or red against the relevant threshold, and grey when the value is unavailable.
DATA WINDOW COLUMNS
All 1/0 flags and numeric readouts are plotted to the Data Window rather than the price scale, so they stay available to the Screener without distorting the chart.
Gate flags: All screens pass, Price OK, Liquidity OK, Weeklies OK, IV rank OK, Funds target, EMA gate OK, EMA stacked, Above 50 EMA, Above 200 EMA, Falling knife, Earnings soon.
Setup flags: Breakout today, In buy zone, Approaching pivot, Base OK, Vol surge OK.
Ranking: Combined Score, IV Juice Score, Setup Score.
Volatility and premium: IV Rank, IV Percentile, IV proxy %, Realized vol %, Est prem % (delta), Est prem % (ATM), Prem $/contract, Strike % OTM, 1-sigma move %, Prem/risk ratio, Vol ratio fast/slow (10-bar versus the main lookback - above 1 means volatility is picking up).
Setup numerics: Dist to pivot % (positive means below the pivot), Pivot price, Base depth %, Bars since high, Tightness %, Vol surge x, Stack gap %, Stack age (bars), Ext vs 21EMA %, Avg $ vol (M).
ALERTS
Two conditions, both gated on a confirmed bar so they do not fire intrabar: "coiled under pivot" (all screens pass and approaching) and "breakout today" (all screens pass and the pivot was crossed).
REPAINTING
Stated plainly:
HISTORICAL BARS DO NOT REPAINT. No request.security() is used anywhere, so there is no higher-timeframe lookahead. The pivot is taken from the previous bar's highest high, so it is fixed before the current bar opens.
THE LIVE, UNCLOSED BAR DOES UPDATE. Every close-based value - the breakout flag, the buy-zone flag, the premium estimates, both scores - recalculates tick by tick until the bar closes, which is normal for close-based logic. Judge a signal on the closed bar.
Both alert conditions require barstate.isconfirmed, so alerts only fire on closed bars.
The pivot line, label and table are redrawn on the last bar only.
LIMITATIONS
THERE IS NO IMPLIED VOLATILITY IN PINE. Every volatility column here is realized volatility scaled by a constant. It is a reasonable ranking signal and a poor quote. Confirm the real chain and the real IV before placing anything.
THERE IS NO OPTIONS METADATA IN PINE EITHER. See the weeklies section - two of the three modes are exact only because you supply the list.
Realized volatility is backward-looking by construction. It understates volatility going into a scheduled event and overstates it coming out. That is what the earnings column is for.
"Earnings soon" is blank, not zero, when the data feed supplies no upcoming earnings date. Blank means unknown, not safe. It reflects the currently known schedule, so treat it as a live screening aid rather than a historical field.
Base detection is a highest-high pivot, not pattern recognition. It cannot tell a cup with handle from a flat base from a messy consolidation. Depth, age and tightness are reported so you can make that judgement on the chart yourself. Treat the output as a shortlist, not a verdict.
DATA DEPTH. IV Rank needs roughly 273 daily bars (252 rank window plus the 21-bar volatility lookback) and the 200 EMA needs 200. These columns are structurally blank on young listings and on low timeframes. Run this on Daily.
Black-Scholes here uses r = 0 and q = 0. Negligible at 7 days, a real approximation at 60 days on a high-dividend name.
The error function approximation is accurate to about 7e-8. The inverse normal CDF is a central-region approximation, which is why the delta input is clamped to 0.10-0.50 rather than allowing deep out-of-the-money deltas.
The scoring weights are a disclosed judgement, not an optimised fit.
WHY THIS IS NOT A MASHUP
The components are individually standard. What is not standard is the specific question they are combined to answer, and the combination is not arbitrary - each piece exists to fix a defect in the piece before it.
A volatility estimator alone gives you a number with no reference point, so IV Rank puts it against its own history. IV Rank alone cannot tell you whether the premium is worth the capital, so Black-Scholes at a target delta converts volatility into a comparable percent-of-spot figure against a weekly income target. A premium figure alone ranks falling knives at the top, because collapsing stocks have the richest volatility, so the trend and base structure exist specifically to exclude them. And all of that is useless on a name you cannot actually trade, which is what the price, share-volume and weekly-contract screens are for.
The scale-invariance result described above is the specific reason the ranking is built on IV Rank plus structure rather than on the volatility level, which is what a straightforward combination of these indicators would have done.
Delta-inverted strike selection, a natively implemented normal and inverse normal CDF, and an explicit disclosure that the volatility input is a realized-vol proxy rather than quoted IV are the parts I have not seen packaged together as a screener.
NOT ADVICE
This is an analysis tool. It does not quote options, it does not price your fills, and nothing in it is a recommendation or a prediction. Verify every number against the real chain before you trade.

Declinazione di responsabilità
Le informazioni e le pubblicazioni non sono intese come, e non costituiscono, consulenza o raccomandazioni finanziarie, di investimento, di trading o di altro tipo fornite o approvate da TradingView. Per ulteriori informazioni, consultare i Termini di utilizzo.
Declinazione di responsabilità
Le informazioni e le pubblicazioni non sono intese come, e non costituiscono, consulenza o raccomandazioni finanziarie, di investimento, di trading o di altro tipo fornite o approvate da TradingView. Per ulteriori informazioni, consultare i Termini di utilizzo.