Aggiornato
[blackcat] L3 Emotion Line
**I. Overview**
The Emotion Line is an innovative technical indicator designed to capture market sentiment by analyzing price dynamics. This indicator calculates the average of opening, high, low, and closing prices over the past three days and combines the concepts of Dynamic Moving Average (DMA) and Exponential Moving Average (EMA) to generate a value reflecting market sentiment. The Emotion Line is implemented in Pine Script on the TradingView platform, providing users with an intuitive tool for market sentiment analysis.
**II. Calculation Method**
1. **Ray**: Calculate the average of the past three days' prices, i.e., (2 * C + H + L) / 4, where C represents the closing price, H the highest price, and L the lowest price. Then, take the Simple Moving Average (SMA) of this average over 3 days with a smoothing factor of 2.
2. **CL (Close Line)**: Assign the value of Ray to CL as the basis for subsequent calculations.
3. **DIR1 (Directional Change)**: Calculate the absolute difference between CL and the CL of the previous two days, indicating the magnitude of price movement.
4. **VIR1 (Volume in Range)**: Calculate the sum of the absolute differences between CL and the previous day's CL over the past two days, measuring the accumulation of price fluctuations.
5. **ER1 (Efficiency Ratio)**: The ratio of DIR1 to VIR1, measuring the efficiency of price movement.
6. **CS1 (Cumulative Strength)**: Apply a weighted process to ER1 to obtain CS1.
7. **CQ1 (Cumulative Quotient)**: The square of CS1, further strengthening the cumulative effect of price movement.
8. **AMA5 (Adjusted Moving Average)**: Calculate the Dynamic Moving Average (DMA) of CL with the dynamic factor CQ1, then apply a 2-day Exponential Moving Average (EMA) to the result.
9. **Cost**: Calculate the 7-day Simple Moving Average (SMA) of AMA5.
10. **CLX (Composite Line)**: Calculate the average of AMA5 and Cost to obtain CLX.
11. **Emotion Line**: Calculate the proportion of CLX increasing continuously for N days, with N defaulting to 7 days. Multiply the result by 100 to get the Emotion Line value.
12. **MA_emotionLine (Moving Average Emotion Line)**: Calculate the M-day moving average of the Emotion Line, with M defaulting to 6 days.
**III. Market Logic**
By analyzing the cumulative effect and efficiency of price movement, the Emotion Line attempts to reveal the strength of market sentiment. When the Emotion Line rises, it indicates a positive market sentiment, and investors may have an optimistic attitude towards the stock; a falling Emotion Line may signal a weakening market sentiment. The absolute value and trend changes of the Emotion Line can provide investors with references for buying, holding, or selling.
**IV. Usage**
1. **Attention Signal**: When the Emotion Line exceeds 20%, the market sentiment may begin to be positive, and investors should pay attention to related stocks.
2. **Entry Signal**: When the Emotion Line exceeds 40%, the market sentiment is relatively strong, and investors may consider entering the market.
3. **Reduce Position Signal**: When the Emotion Line exceeds 80%, the market may be overly optimistic, and investors should consider reducing their positions to avoid risk.
4. **Exit Signal**: When the Emotion Line breaks below its M-day moving average, it may signal a shift in market sentiment, and investors should consider exiting the market.
**V. Notes**
- The Emotion Line is an auxiliary tool, and investors should make comprehensive judgments based on other technical analysis and fundamental analysis.
- Market sentiment is influenced by various factors, and the Emotion Line may have lag, so investors should use it cautiously.
- Investors should adjust the parameters of the Emotion Line according to their risk tolerance and investment strategy.
**VI. Conclusion**
The Emotion Line is an intuitive indicator that reflects market sentiment through quantitative methods, providing a new perspective for investors to observe market dynamics. However, no technical indicator is foolproof, and investors should remain cautious when using it, combining their personal experience and market conditions to make decisions. Through the TradingView platform, investors can easily add the Emotion Line indicator to their charts to assist in their trading decision-making process.
The Emotion Line is an innovative technical indicator designed to capture market sentiment by analyzing price dynamics. This indicator calculates the average of opening, high, low, and closing prices over the past three days and combines the concepts of Dynamic Moving Average (DMA) and Exponential Moving Average (EMA) to generate a value reflecting market sentiment. The Emotion Line is implemented in Pine Script on the TradingView platform, providing users with an intuitive tool for market sentiment analysis.
**II. Calculation Method**
1. **Ray**: Calculate the average of the past three days' prices, i.e., (2 * C + H + L) / 4, where C represents the closing price, H the highest price, and L the lowest price. Then, take the Simple Moving Average (SMA) of this average over 3 days with a smoothing factor of 2.
2. **CL (Close Line)**: Assign the value of Ray to CL as the basis for subsequent calculations.
3. **DIR1 (Directional Change)**: Calculate the absolute difference between CL and the CL of the previous two days, indicating the magnitude of price movement.
4. **VIR1 (Volume in Range)**: Calculate the sum of the absolute differences between CL and the previous day's CL over the past two days, measuring the accumulation of price fluctuations.
5. **ER1 (Efficiency Ratio)**: The ratio of DIR1 to VIR1, measuring the efficiency of price movement.
6. **CS1 (Cumulative Strength)**: Apply a weighted process to ER1 to obtain CS1.
7. **CQ1 (Cumulative Quotient)**: The square of CS1, further strengthening the cumulative effect of price movement.
8. **AMA5 (Adjusted Moving Average)**: Calculate the Dynamic Moving Average (DMA) of CL with the dynamic factor CQ1, then apply a 2-day Exponential Moving Average (EMA) to the result.
9. **Cost**: Calculate the 7-day Simple Moving Average (SMA) of AMA5.
10. **CLX (Composite Line)**: Calculate the average of AMA5 and Cost to obtain CLX.
11. **Emotion Line**: Calculate the proportion of CLX increasing continuously for N days, with N defaulting to 7 days. Multiply the result by 100 to get the Emotion Line value.
12. **MA_emotionLine (Moving Average Emotion Line)**: Calculate the M-day moving average of the Emotion Line, with M defaulting to 6 days.
**III. Market Logic**
By analyzing the cumulative effect and efficiency of price movement, the Emotion Line attempts to reveal the strength of market sentiment. When the Emotion Line rises, it indicates a positive market sentiment, and investors may have an optimistic attitude towards the stock; a falling Emotion Line may signal a weakening market sentiment. The absolute value and trend changes of the Emotion Line can provide investors with references for buying, holding, or selling.
**IV. Usage**
1. **Attention Signal**: When the Emotion Line exceeds 20%, the market sentiment may begin to be positive, and investors should pay attention to related stocks.
2. **Entry Signal**: When the Emotion Line exceeds 40%, the market sentiment is relatively strong, and investors may consider entering the market.
3. **Reduce Position Signal**: When the Emotion Line exceeds 80%, the market may be overly optimistic, and investors should consider reducing their positions to avoid risk.
4. **Exit Signal**: When the Emotion Line breaks below its M-day moving average, it may signal a shift in market sentiment, and investors should consider exiting the market.
**V. Notes**
- The Emotion Line is an auxiliary tool, and investors should make comprehensive judgments based on other technical analysis and fundamental analysis.
- Market sentiment is influenced by various factors, and the Emotion Line may have lag, so investors should use it cautiously.
- Investors should adjust the parameters of the Emotion Line according to their risk tolerance and investment strategy.
**VI. Conclusion**
The Emotion Line is an intuitive indicator that reflects market sentiment through quantitative methods, providing a new perspective for investors to observe market dynamics. However, no technical indicator is foolproof, and investors should remain cautious when using it, combining their personal experience and market conditions to make decisions. Through the TradingView platform, investors can easily add the Emotion Line indicator to their charts to assist in their trading decision-making process.
Note di rilascio
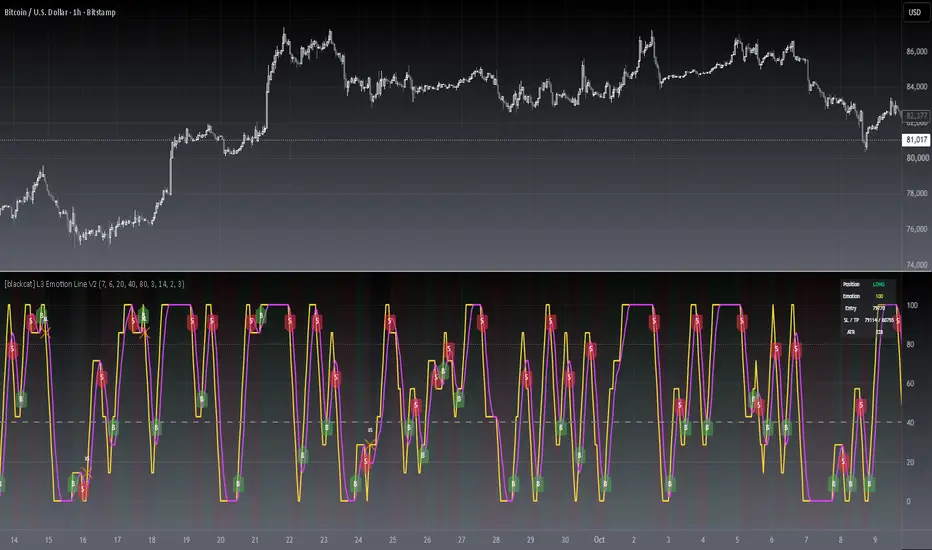
█ OVERVIEWL3 Emotion Line V2 condenses market sentiment into a single 0-100 oscillator that measures how consistently an adaptive price line has been rising over recent bars. It now ships as a complete trading loop: Buy/Sell labels, opposite-signal exits, ATR-based stop and target levels, a position dashboard, and close-confirmed alerts.
█ CONCEPTS
The emotion score is built in three layers:
• Adaptive price line: a weighted typical price is smoothed by an adaptive moving average whose speed reacts to trend efficiency — it hugs price in trends and flattens in chop.
• Emotion score: for the last Lookback Length bars, the script counts how many closed with the adaptive line rising and scales the count to 0-100. High readings mean persistent upward pressure, low readings persistent downward pressure.
• Signal line: a simple moving average of the score. Crosses between the two lines define the trade triggers.
█ HOW TO USE
1 — Add the script to your chart; it opens in its own pane below price.
2 — Tune Lookback Length (default 7) and Smooth Length (default 6) to your market and timeframe; larger values mean smoother lines and fewer signals.
3 — Read the labels and background to follow the current position state, and set alerts from the four provided alert conditions or the dynamic alert messages.
Input Parameters
• Lookback Length — bars counted for the emotion score (default 7)
• Smooth Length — signal line length (default 6)
• Lower / Middle / Upper Band — reference levels drawn at 20 / 40 / 80
• Same-bar Entry/Exit Priority — gives exits priority when both trigger together (on)
• Cooldown Bars — minimum bars between two signals, 0 restores raw crosses (default 3)
• Show TP/SL Levels — plots ATR-based stop and target while a position is open (on)
• ATR Length / Stop Loss (xATR) / Take Profit (xATR) — risk model, defaults 14 / 2.0 / 3.0
• Position Background, Status Dashboard — visual toggles (on)
█ FEATURES
• Complete trade loop: entries, signal exits, stop and target reference levels
• Signal governance: a position state machine suppresses duplicate entries, honors exit priority, and enforces a configurable cooldown
• ATR-adaptive risk levels that scale with volatility instead of fixed percentages
• Status dashboard: position state, live emotion value, entry price, SL/TP, ATR
• Four named alert conditions plus dynamic bar-close-confirmed alerts
█ SIGNALS
• B — green label: emotion line crossed above its signal line, long entry
• S — red label: emotion line crossed below its signal line, short entry
• XL / XS — orange crosses: the opposite cross closed the long / short trade
• Green / red background: long / short position is active
• Yellow line — emotion score; fuchsia line — signal line; dotted bands — 20 / 40 / 80
█ IMPLEMENTATION NOTES
Open source under Mozilla Public License 2.0. Signals use edge detection via ta.crossover / ta.crossunder and are evaluated on confirmed bars only (alert.freq_once_per_bar_close), so alerts do not repaint intra-bar. Stop and target levels derive from ta.atr anchored at the signal-bar close and plot as stepped reference lines. This version adds state-machine governance, exits, risk levels, a dashboard, and named alert conditions on top of the original V1 emotion engine; the core calculation is unchanged.
█ LIMITATIONS
• Ranging markets still produce whipsaws; raise Cooldown Bars to filter them
• SL/TP lines are reference levels computed from signal-bar closes, not broker orders
• The score is price-based only; volume is not considered
• Designed for bar-close evaluation; not intended for sub-minute scalping
█ NOTES
• Original emotion engine and V1 by blackcat1402, licensed Mozilla Public License 2.0
• V2 focuses on tradability: governance, exits, risk levels, dashboard, alerts
• Test on your symbol and timeframe with defaults before tuning
════════════════════════════════════════════════════════════════════════
For questions or feedback, please use the comments section below.
Feel free to use and modify — attribution appreciated.

Don't miss out! The first and most important thing to do is to join my Discord chat now! Click here to start your adventure: discord.com/invite/ZTGpQJq My new github for more pine development soon: github.com/wxt-coder
Declinazione di responsabilità
Le informazioni e le pubblicazioni non sono intese come, e non costituiscono, consulenza o raccomandazioni finanziarie, di investimento, di trading o di altro tipo fornite o approvate da TradingView. Per ulteriori informazioni, consultare i Termini di utilizzo.
Don't miss out! The first and most important thing to do is to join my Discord chat now! Click here to start your adventure: discord.com/invite/ZTGpQJq My new github for more pine development soon: github.com/wxt-coder
Declinazione di responsabilità
Le informazioni e le pubblicazioni non sono intese come, e non costituiscono, consulenza o raccomandazioni finanziarie, di investimento, di trading o di altro tipo fornite o approvate da TradingView. Per ulteriori informazioni, consultare i Termini di utilizzo.