OPEN-SOURCE SCRIPT
Aggiornato Confirmed Close MTPI ETH/BTC
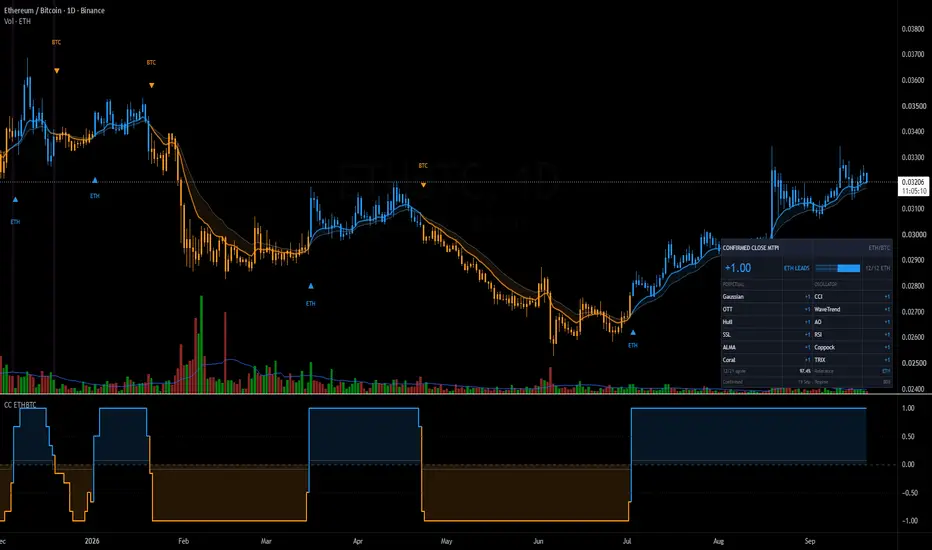
WHAT THIS IS
This is a trend indicator for the ETH/BTC ratio. It answers one question: which of the two majors is leading right now, ether or bitcoin?
The chart it runs on is a ratio, not a price. When the line rises, ether is gaining on bitcoin. When it falls, bitcoin is gaining on ether. Both can be going up or down in dollars at the time. The ratio only cares which one is winning.
It answers that by running twelve separate trend indicators at once and taking a vote. Each of the twelve looks at the chart in its own way and says either up or down. The score is the average of those votes. All twelve for ether gives +1.00, all twelve for bitcoin gives -1.00, and a six against six split gives 0.00.
Because twelve votes average out, the score can only land on thirteen values, one sixth apart: -1.00, -0.83, -0.67 and so on up to +1.00.
This approach is usually called a Trend Probability Indicator, or TPI. The point is that no single indicator is reliable on its own. Any one of them will whipsaw you. What holds up is the question of how much of the group agrees, and that is what the score measures.
WHY "CONFIRMED CLOSE"
A lot of indicators change their mind while the current candle is still forming, then change back before it closes. That is called repainting and it makes an indicator untradeable, because the signal you acted on may not be there an hour later.
This one does not do that. While today's candle is still open, the indicator shows you yesterday's confirmed reading. The state only changes when a daily candle actually closes. What you see is what you could have traded.
HOW TO READ IT
Blue is ether, orange is bitcoin. That pair was chosen on purpose: it stays readable for the most common forms of colour blindness, where green and red do not. There is a green and red palette in the settings if you prefer it.
On the price chart:
- Candles are painted blue while ether leads and orange while bitcoin leads. This is the state, at a glance.
- A blue triangle marked ETH below the candles is the bar where the score turned in ether's favour. An orange triangle marked BTC above them is the turn to bitcoin. These are the moments that matter.
- Two moving averages, a 12 period and a 21 period EMA, are drawn as a reference. They are a crude version of the same question and they are there so you can see how much smoother the twelve indicator version is.
- Bars are tinted purple where the twelve indicator score and the simple 12/21 cross disagree. Those are the bars where the crude version would have put you in the wrong coin.
In the separate pane below:
- The stepped line is the score, from -1.00 to +1.00, filled to the zero line and coloured by state.
- Dotted lines at +0.5 and -0.5 give you a sense of how strong the agreement is. A score of +1.00 is twelve out of twelve. A score of +0.17 is seven against five, which is a lead barely holding together.
The dashboard, bottom right by default:
- The big number is the current score, with ETH LEADS or BTC LEADS next to it.
- The bar beside it is a gauge. It fills outward from the middle, right and blue for ether, left and orange for bitcoin.
- The twelve indicators are listed in two columns, the six trend-following ones on the left and the six oscillators on the right, each showing its own vote. This is where you see WHY the score is what it is.
- "12/21 agree" is the share of days where the twelve indicator score and the simple EMA cross pointed the same way, measured across all the history your chart has loaded. Read it as a rough measure of how often the crude version would have agreed with the careful one. It is measured against the raw cross with no filtering, so treat it as an indication rather than a precise statistic.
- "Regime" is how many days the current state has lasted. It turns amber below eight days, because a lead that has not lasted eight days has a habit of being noise.
HOW TO USE IT
The simplest use is the one it was built for. It does not tell you whether to be in crypto at all. It tells you which major to hold once you have decided to be. Positive and the base holding is ether. Negative and it is bitcoin.
You act on the close, and you execute on the open of the next candle. Anything earlier is acting on a candle that has not finished forming.
Set an alert if you do not want to watch it. The script exposes two alert conditions, one for the turn to ether and one for the turn to bitcoin, and both fire only on a confirmed daily close.
Read the twelve rows when the score is near zero. A score of +0.17 that is being held up by two oscillators is a very different situation from a +0.17 where the trend-following group is turning. The individual votes tell you which one you are in.
THE WIDER SYSTEM THIS BELONGS TO
This indicator is one rung of a ladder. The idea is that you are always holding the strongest available thing, and that the decision is made in steps rather than all at once.
Step one. A TPI on the total crypto market cap excluding stablecoins. If it is positive, you stay in crypto and you go to step two. If it is negative, you leave crypto and go to step three.
Step two, and this is where this indicator sits. ETH/BTC decides which major leads. Positive means ether is outperforming and ether is the base holding. Negative means bitcoin. A further layer of ratio TPIs then compares mid caps against whichever major won, and the ones that are outperforming take a share of the book.
Step three, when crypto is bearish. A gold TPI. If gold is trending up, that is where the money sits.
Step four, when gold is not working either. An index TPI on the S&P 500. If equities are trending, that is the holding.
Step five, when nothing is trending. Cash, and a EUR/USD TPI decides whether that cash is better held in euros or in dollars.
Each rung is its own TPI, built the same way: twelve indicators, one vote each, tuned separately for that market. The ladder simply asks them in order.
A SET, NOT A SINGLE SCRIPT
This is the second published piece of that set, after the one on the total crypto market cap. The other rungs are built and running and will follow as separate publications, each one an indicator for its own market, all reading the same way so you only have to learn the layout once.
ABOUT THE SETTINGS
The twelve indicators and their periods are visible in the settings and in the source. They were tuned for this specific ratio against a cleaned 12/21 EMA reference on daily data from January 2023 onward, with regimes shorter than eight days treated as noise and removed before the tuning was scored. The symbol has daily history back to 2017 if you want to look further back.
A ratio is choppier than a single market, so the agreement ceiling is lower here than it is on the total market cap version. That is the honest answer and it is why the twelve are not the same twelve. Two components differ from the market cap script: Coral Trend replaces the Follow Line, and TRIX replaces the Fisher Transform.
Those numbers are right for ETH/BTC. They are not automatically right for anything else. If you put this on another symbol, expect to retune. That is why each market in the set gets its own publication rather than one script with a symbol dropdown.
Three of the twelve are read on a smoothed line rather than the raw one, which is deliberate: the CCI is scored on its EMA 5 smoothing and the RSI on its EMA 12. The Awesome Oscillator is scored on its raw line, not its signal line. Those choices are in the code and commented.
HOW FAITHFUL THE REBUILD IS
Because seven of the twelve are rewritten from other people's published formulas rather than called directly, the obvious question is whether they behave the same. They do, and you can check it yourself: put the twelve original indicators on this chart with the settings listed in the source and compare.
That is what was done here. Three thousand three hundred daily bars were loaded, back to 2017, and every one of the twelve votes was compared bar by bar against the original indicator running on the same chart. Zero disagreements on any of the twelve, and the combined score matched on every single bar.
The score also reproduces the daily record of the live system this belongs to, exactly, for 626 consecutive days. That part you cannot verify from here, so take it for what it is worth. The bar by bar check above is the one that stands on its own.
That check is worth repeating if you change a setting, and it is why each vote is exposed as a hidden plot in the script rather than kept internal.
CREDIT WHERE IT IS DUE
Seven of the twelve components are reimplementations of open-source community scripts, written from their published formulas so they could all live in one indicator and be scored consistently. Full credit to the original authors:
- Gaussian Channel by DonovanWall
- Optimized Trend Tracker by KivancOzbilgic
- Awesome Oscillator v2 by KivancOzbilgic
- Hull Suite by InSilico
- SSL Channel by ErwinBeckers
- Coral Trend Indicator by LazyBear
- WaveTrend by LazyBear
The remaining five are standard: ALMA, CCI, RSI, Coppock Curve and TRIX.
What is added here is the aggregation into a single score, the confirmed close behaviour, the per indicator breakdown, the agreement measurement against the reference, and the ladder logic this is built to serve.
LIMITATIONS AND A PLAIN WARNING
This is a trend indicator. It is late by design. It will not catch the exact turn in the ratio, and it is not supposed to. It will be wrong when the two majors trade in line with each other for weeks, which is what the eight day regime warning is there to tell you.
It also says nothing about the direction of crypto itself. A +1.00 reading here means ether is beating bitcoin. Both of them can still be falling. That is what the first rung of the ladder is for.
Nothing here is financial advice. It is a tool for reading a chart. Past behaviour of any indicator tells you nothing reliable about the future. Do your own work and size your positions so that being wrong is survivable.
Note di rilascio
Chart snapshot replaced. The first one still carried reference drawings from my own chart layout, the green and red vertical lines, which are not part of the indicator and only confused the picture. Two comment lines added about the palette. No change to the logic or the settings.Script open-source
Nello spirito di TradingView, l'autore di questo script lo ha reso open source, in modo che i trader possano esaminarne e verificarne la funzionalità. Complimenti all'autore! Sebbene sia possibile utilizzarlo gratuitamente, ricordiamo che la ripubblicazione del codice è soggetta al nostro Regolamento.

The Rotation Ladder: a five step trend system that decides what to hold, crypto, the leading major, gold, equities or cash. Method, backtest and the live signal, free and in the open. confirmedclose.com
Declinazione di responsabilità
Le informazioni e le pubblicazioni non sono intese come, e non costituiscono, consulenza o raccomandazioni finanziarie, di investimento, di trading o di altro tipo fornite o approvate da TradingView. Per ulteriori informazioni, consultare i Termini di utilizzo.
Script open-source
Nello spirito di TradingView, l'autore di questo script lo ha reso open source, in modo che i trader possano esaminarne e verificarne la funzionalità. Complimenti all'autore! Sebbene sia possibile utilizzarlo gratuitamente, ricordiamo che la ripubblicazione del codice è soggetta al nostro Regolamento.
The Rotation Ladder: a five step trend system that decides what to hold, crypto, the leading major, gold, equities or cash. Method, backtest and the live signal, free and in the open. confirmedclose.com
Declinazione di responsabilità
Le informazioni e le pubblicazioni non sono intese come, e non costituiscono, consulenza o raccomandazioni finanziarie, di investimento, di trading o di altro tipo fornite o approvate da TradingView. Per ulteriori informazioni, consultare i Termini di utilizzo.