Aggiornato
Options Vision
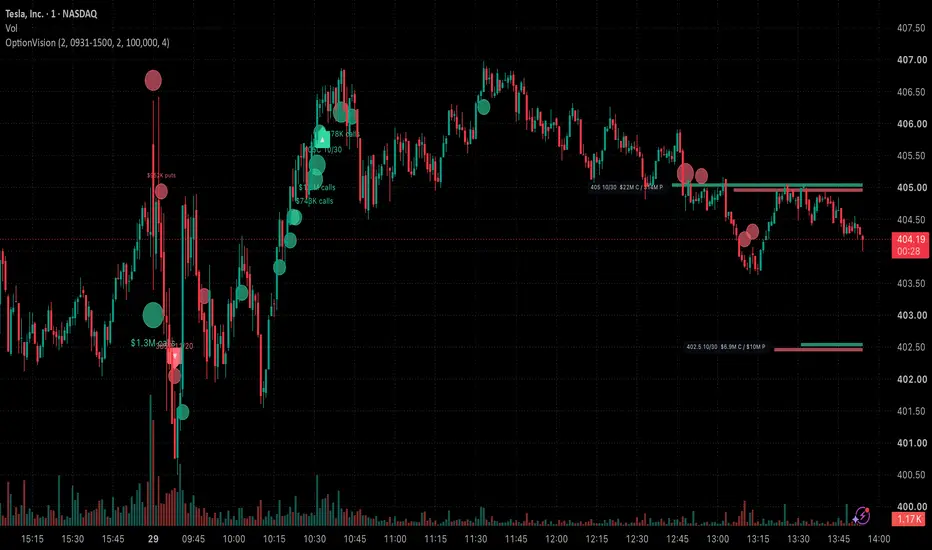
Options Vision puts intraday option activity on the stock chart, using only TradingView's own OPRA option data. It draws three things: premium high-of-day (HOD) break signals on the at-the-money weekly call and put, option flow bubbles, and the session levels intraday traders watch (VWAP, EMAs, prior-day and premarket levels, HOD).
WHY IT IS DIFFERENT
Most breakout tools look at the stock's price. This script tracks the option's own premium: it builds the ticker of the ATM call and put each morning, requests their 1-minute prices, and counts how many times the premium makes a new intraday high. Breakout traders often wait for the second or third push instead of the first, and that count is what the signal is built on.
HOW IT WORKS
1. Contract selection. At the 09:30 ET open the script picks the ATM strike (grid: $1 for SPY/QQQ, $2.50 under $500, $5 otherwise) and this week's Friday expiry, then builds the OPRA tickers for the call and the put.
2. Premium HOD breaks. On each confirmed 1-minute close, a break is a new premium high that follows a minute that was not a high. When the call or put reaches break number N (default 2) inside the entry window (default 09:35-16:00 ET), a label is drawn: green below the bar for calls, red above the bar for puts. Each side fires at most once per day.
3. SPY gate (optional, on by default). Calls fire only while SPY's last 1-minute close is at or above its average close since 09:30; puts only while it is below. This keeps signals in line with the broad market's direction.
4. Signal tooltip. Hover a label to see the contract, entry premium, the prior high it broke, the stock and SPY context, and how the premium moved after the signal (last, best and worst, with times). These figures use last-trade prices and are for review only; they are not achievable fills.
5. Flow bubbles (latest session). Each minute, premium traded (volume x last price x 100) is summed on the 5 strikes around the money for calls and puts. Strike-minutes above a threshold (a $ floor, or a multiple of the session's average strike-minute, whichever is higher) are drawn as bubbles: calls below the bar, puts above. The 5 largest show their dollar amount.
6. Levels. VWAP and EMA 9/20 on regular-hours bars, plus prior-day close/high/low, premarket high/low and today's HOD. Only levels inside the visible candle range are drawn, so the price scale is not stretched.
HOW TO USE IT
Use a 1-minute chart of a US stock or ETF with listed weekly options (for example SPY, QQQ, TSLA, NVDA). The option signals and bubbles only run on the 1-minute timeframe; on other timeframes only VWAP, EMAs and levels are shown, along with a note. Treat a signal as a prompt to look at the option, not as an order.
LIMITATIONS
- TradingView gives scripts option last-trade prices, not bid/ask. A break needs a printed trade, and the premium at the signal is not what you would pay; real fills are usually worse, especially on fast moves.
- Option data is delayed unless you have a real-time OPRA subscription. With delayed data, signals appear late.
- Flow bubbles cannot tell whether trades were bought or sold, and one minute's total can be many smaller trades.
- Each option contract is one data request, and TradingView limits requests per script, so only the ATM pair and 5 strikes are tracked.
- Strikes on the grid above may not exist for every symbol; missing contracts are skipped.
- This is an analysis tool, not a trading system. Nothing here predicts future results.
WHY IT IS DIFFERENT
Most breakout tools look at the stock's price. This script tracks the option's own premium: it builds the ticker of the ATM call and put each morning, requests their 1-minute prices, and counts how many times the premium makes a new intraday high. Breakout traders often wait for the second or third push instead of the first, and that count is what the signal is built on.
HOW IT WORKS
1. Contract selection. At the 09:30 ET open the script picks the ATM strike (grid: $1 for SPY/QQQ, $2.50 under $500, $5 otherwise) and this week's Friday expiry, then builds the OPRA tickers for the call and the put.
2. Premium HOD breaks. On each confirmed 1-minute close, a break is a new premium high that follows a minute that was not a high. When the call or put reaches break number N (default 2) inside the entry window (default 09:35-16:00 ET), a label is drawn: green below the bar for calls, red above the bar for puts. Each side fires at most once per day.
3. SPY gate (optional, on by default). Calls fire only while SPY's last 1-minute close is at or above its average close since 09:30; puts only while it is below. This keeps signals in line with the broad market's direction.
4. Signal tooltip. Hover a label to see the contract, entry premium, the prior high it broke, the stock and SPY context, and how the premium moved after the signal (last, best and worst, with times). These figures use last-trade prices and are for review only; they are not achievable fills.
5. Flow bubbles (latest session). Each minute, premium traded (volume x last price x 100) is summed on the 5 strikes around the money for calls and puts. Strike-minutes above a threshold (a $ floor, or a multiple of the session's average strike-minute, whichever is higher) are drawn as bubbles: calls below the bar, puts above. The 5 largest show their dollar amount.
6. Levels. VWAP and EMA 9/20 on regular-hours bars, plus prior-day close/high/low, premarket high/low and today's HOD. Only levels inside the visible candle range are drawn, so the price scale is not stretched.
HOW TO USE IT
Use a 1-minute chart of a US stock or ETF with listed weekly options (for example SPY, QQQ, TSLA, NVDA). The option signals and bubbles only run on the 1-minute timeframe; on other timeframes only VWAP, EMAs and levels are shown, along with a note. Treat a signal as a prompt to look at the option, not as an order.
LIMITATIONS
- TradingView gives scripts option last-trade prices, not bid/ask. A break needs a printed trade, and the premium at the signal is not what you would pay; real fills are usually worse, especially on fast moves.
- Option data is delayed unless you have a real-time OPRA subscription. With delayed data, signals appear late.
- Flow bubbles cannot tell whether trades were bought or sold, and one minute's total can be many smaller trades.
- Each option contract is one data request, and TradingView limits requests per script, so only the ATM pair and 5 strikes are tracked.
- Strikes on the grid above may not exist for every symbol; missing contracts are skipped.
- This is an analysis tool, not a trading system. Nothing here predicts future results.
Note di rilascio
Rebuilt. Options Vision now shows: big option orders as circles on the candle where they traded (top 5 labelled with $), strike bars with the premium traded today at each strike, and signal arrows from 4 rules (ATM weekly, 3 strikes OTM weekly, straddle-sized offset weekly and monthly) when an option's premium makes its 2nd high-of-day break. The expiry date is shown next to every option. VWAP, EMAs and prior-day / premarket levels are no longer drawn. Runs on the 1-minute chart.Note di rilascio
Fix: "requested historical offset beyond the buffer limit" runtime error when the chart was zoomed far out or scrolled far back. The strike bars now stay within TradingView's bar buffer.
Declinazione di responsabilità
Le informazioni e le pubblicazioni non sono intese come, e non costituiscono, consulenza o raccomandazioni finanziarie, di investimento, di trading o di altro tipo fornite o approvate da TradingView. Per ulteriori informazioni, consultare i Termini di utilizzo.
Declinazione di responsabilità
Le informazioni e le pubblicazioni non sono intese come, e non costituiscono, consulenza o raccomandazioni finanziarie, di investimento, di trading o di altro tipo fornite o approvate da TradingView. Per ulteriori informazioni, consultare i Termini di utilizzo.