DC Trading - MTF Liquidity Raid
DC Trading - MTF Liquidity Raid
OVERVIEW
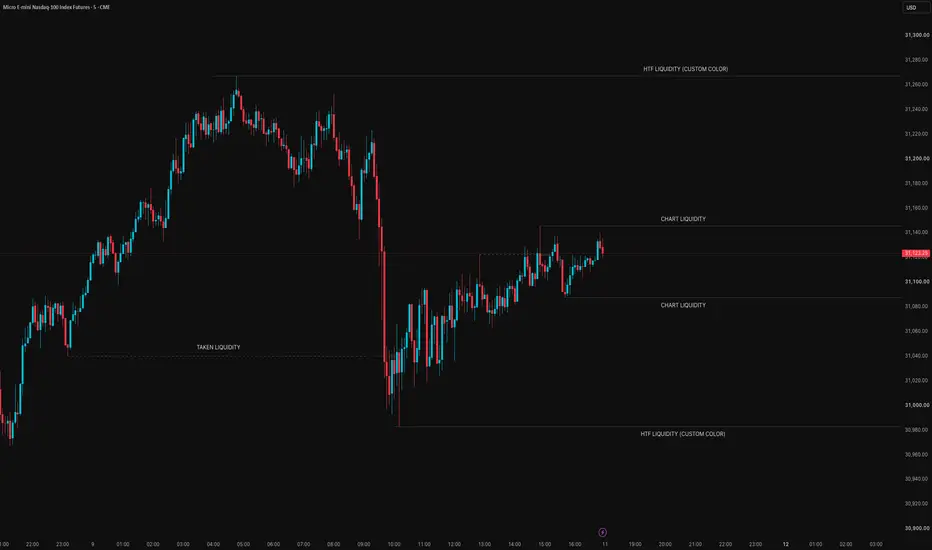
MTF Liquidity Raid maps buyside and sellside liquidity on two timeframes at once: the chart timeframe and a higher timeframe of your choice. It tracks where resting liquidity sits, marks when it gets taken, and labels the moments where price sweeps a level and closes back inside — the classic liquidity raid used in ICT / Smart Money Concepts.
HOW IT WORKS
- Chart Liquidity: swing highs (buyside) and swing lows (sellside) are detected with a configurable swing length and drawn as dotted levels that extend to the right until price reaches them.
- Nearest Levels Only: the indicator keeps every valid level in memory but only displays the ones closest to current price (set by "Active Levels per Side"), keeping the chart clean.
- HTF Liquidity: swing levels from a higher timeframe (default 1H) are plotted in their own color. HTF levels are only drawn once the HTF swing is confirmed, so they do not repaint.
- Equal Highs / Lows: when two swings form at nearly the same price, they are merged into one level and labeled EQH (above) or EQL (below). The tolerance is based on ATR, so it adapts to any market.
- Taken Liquidity: when price trades through a level, the line stops, turns gray and dashed, and extends a few bars so the label stays clear of the candles.
- Sweeps: if price takes a level with a wick but closes back on the other side, the level is labeled "sweep" (or "EQH sweep", "EQL sweep", "HTF sweep").
SETTINGS
- Swing Length – sensitivity of swing detection.
- Max Level Age – how many bars a chart level stays valid.
- Active Levels per Side – how many levels are shown above and below price.
- Taken Levels to Keep per Side – how many taken levels stay visible.
- Extend Taken Line – bars the taken line extends after being hit.
- EQ Tolerance (x ATR) – how close two swings must be to count as equal.
- HTF Timeframe / HTF Swing Length / HTF Active Levels – higher timeframe settings.
- Fully customizable colors for each liquidity type.
ALERTS
Create an alert with the condition "Any alert() function call" to be notified of every sweep, including EQH/EQL and HTF sweeps.
HOW TO USE IT
Use HTF levels as the draw on liquidity — where price is likely heading. Use chart-timeframe levels and sweeps to time entries. A sweep that happens at or near an HTF level carries more weight than one in the middle of the range.
DISCLAIMER
This indicator is a visual tool for studying liquidity and market structure. It does not give buy or sell signals and does not guarantee any result. Always use your own analysis and risk management.
OVERVIEW
MTF Liquidity Raid maps buyside and sellside liquidity on two timeframes at once: the chart timeframe and a higher timeframe of your choice. It tracks where resting liquidity sits, marks when it gets taken, and labels the moments where price sweeps a level and closes back inside — the classic liquidity raid used in ICT / Smart Money Concepts.
HOW IT WORKS
- Chart Liquidity: swing highs (buyside) and swing lows (sellside) are detected with a configurable swing length and drawn as dotted levels that extend to the right until price reaches them.
- Nearest Levels Only: the indicator keeps every valid level in memory but only displays the ones closest to current price (set by "Active Levels per Side"), keeping the chart clean.
- HTF Liquidity: swing levels from a higher timeframe (default 1H) are plotted in their own color. HTF levels are only drawn once the HTF swing is confirmed, so they do not repaint.
- Equal Highs / Lows: when two swings form at nearly the same price, they are merged into one level and labeled EQH (above) or EQL (below). The tolerance is based on ATR, so it adapts to any market.
- Taken Liquidity: when price trades through a level, the line stops, turns gray and dashed, and extends a few bars so the label stays clear of the candles.
- Sweeps: if price takes a level with a wick but closes back on the other side, the level is labeled "sweep" (or "EQH sweep", "EQL sweep", "HTF sweep").
SETTINGS
- Swing Length – sensitivity of swing detection.
- Max Level Age – how many bars a chart level stays valid.
- Active Levels per Side – how many levels are shown above and below price.
- Taken Levels to Keep per Side – how many taken levels stay visible.
- Extend Taken Line – bars the taken line extends after being hit.
- EQ Tolerance (x ATR) – how close two swings must be to count as equal.
- HTF Timeframe / HTF Swing Length / HTF Active Levels – higher timeframe settings.
- Fully customizable colors for each liquidity type.
ALERTS
Create an alert with the condition "Any alert() function call" to be notified of every sweep, including EQH/EQL and HTF sweeps.
HOW TO USE IT
Use HTF levels as the draw on liquidity — where price is likely heading. Use chart-timeframe levels and sweeps to time entries. A sweep that happens at or near an HTF level carries more weight than one in the middle of the range.
DISCLAIMER
This indicator is a visual tool for studying liquidity and market structure. It does not give buy or sell signals and does not guarantee any result. Always use your own analysis and risk management.

Declinazione di responsabilità
Le informazioni e le pubblicazioni non sono intese come, e non costituiscono, consulenza o raccomandazioni finanziarie, di investimento, di trading o di altro tipo fornite o approvate da TradingView. Per ulteriori informazioni, consultare i Termini di utilizzo.
Declinazione di responsabilità
Le informazioni e le pubblicazioni non sono intese come, e non costituiscono, consulenza o raccomandazioni finanziarie, di investimento, di trading o di altro tipo fornite o approvate da TradingView. Per ulteriori informazioni, consultare i Termini di utilizzo.