Ichimoku Cloud Pro [AxeAlgo]
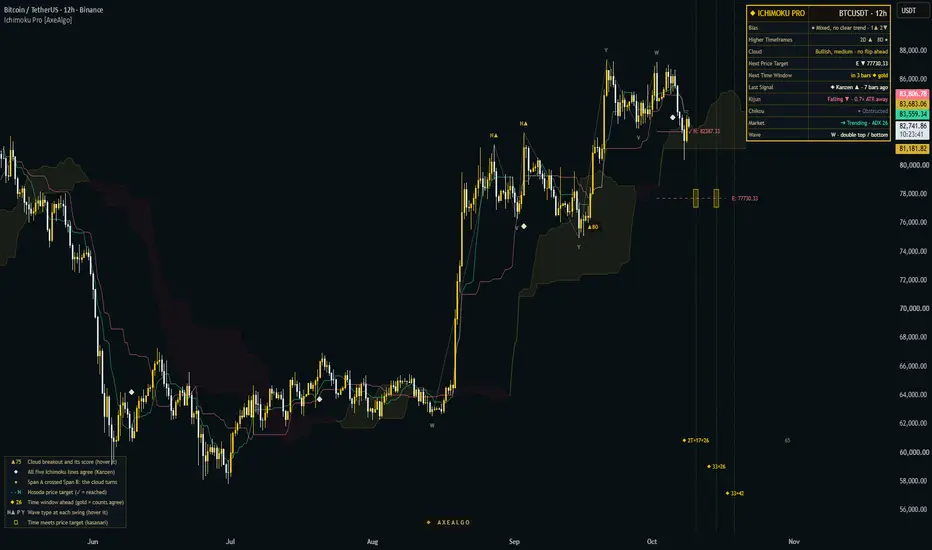
Ichimoku Cloud Pro is a complete Ichimoku Kinko Hyo workspace. Alongside the classic five lines it shows what the cloud will do next, scores cloud breakouts with a transparent checklist, draws Hosoda's wave, price and time theories, reads two higher timeframes, and sums it all up in a plain-language panel.
Every signal is decided at bar close and never repaints. Projections ahead of price (Hosoda target lines, time windows) update as new swings confirm.
WHAT IT SHOWS
- The cloud ahead: Senkou Span A and B are calculated before they are drawn, so the future cloud is already known. A small dot marks the candle on which Span A crosses Span B (the moment the cloud turns), and the panel counts the bars until the drawn cloud changes colour ("flips ▲ in 24 bars").
- Cloud breakouts with a score: a breakout is a close through the whole cloud (coming from the other side, not a dip into the cloud and back). Each one gets a 0-100 checklist score: cloud thickness crossed, Chikou clear, Tenkan/Kijun alignment, close-through margin, higher-timeframe agreement, relative volume and RSI, with a chop filter. Breakouts above your minimum score get a badge; hover it for the full breakdown. "CT" marks a breakout against every higher timeframe, "CH" one in choppy conditions.
- Hosoda's three theories, built from confirmed swings:
- Wave theory: each swing is labelled with its wave type: I (one leg), V (reversal), N (continuation), P (narrowing), Y (widening) or W (double top / bottom). Hover a letter for its meaning.
- Price theory: when a pullback C confirms between A and B, the V, N, E, NT, 2E and 3E targets are projected. A target turns solid with ✓ when reached; if price closes beyond C first, it is removed.
- Time theory: future time windows from Hosoda's basic numbers (Kihon Sūchi: 9, 17, 26, 33, 42, 65, 76, 129, 172, 200, 226, 257) counted from the last one to three swings, plus Taito Sūchi (the last leg's length repeated). Windows where two or more counts agree are gold, with a dotted line; their numbers (for example "◆ 33+26") show which counts agree.
- Kasanari: a small gold box where the next gold time windows meet the nearest open price target.
- Perfect alignment (Kanzen, ◆): price, Tenkan, Kijun, the cloud and Chikou all in order.
- Optional marks: Kijun bounces, Tenkan/Kijun crosses, flat Span B levels, Chikou "open air" (clear of the cloud and of the candles it is about to move through), price far from Kijun and Kijun stop dots.
A small chart key (bottom left, can be turned off) explains every mark on the chart.
THE PANEL
Simple mode (default), in plain words:
- Bias: five classic Ichimoku checks (price vs. cloud, Tenkan vs. Kijun, Chikou, the cloud ahead, Kijun slope) summed into Bullish, Leaning bullish, Mixed, Leaning bearish or Bearish, with how many checks point each way (for example 3▲ 1▼). Hover it to see each check.
- Higher timeframes: the Ichimoku regime on two higher timeframes (chosen automatically, 4× and 16× the chart, or set manually), read from their last closed bar, with ✓ when the chart and both agree.
- Cloud: bullish or bearish, thin, medium or thick, and how many bars until it flips colour.
- Next price target: the nearest open Hosoda target of the latest wave, among the targets you chose to draw.
- Next time window: bars to the next Hosoda time window, and to the next gold one.
- Last signal: the latest breakout, Kanzen, Kijun bounce or cloud turn shown on the chart, and how many bars ago.
Detailed mode adds Kijun slope and distance, Chikou state (obstructed, clear, open air), trending or choppy market, and the latest wave type in words.
HOW TO USE IT
- Read the Bias and Cloud rows first: they tell you which side the Ichimoku structure favours, whether the higher timeframes agree, and whether the cloud is about to turn.
- Treat breakout badges, Kanzen, Hosoda targets and time windows as structure to plan around (bias, levels, timing), combined with your own entry, risk and exit rules.
- Alerts: tick the events you want in the settings and create one "Any alert() function call" alert to receive them all, with score, price and targets in the message. Single events are also available as separate alert conditions.
SETTINGS
The everyday settings come first; fine-tuning sits in two Advanced sections at the bottom.
- Ichimoku: line lengths (Traditional, Crypto 24/7, Forex 5-day, Fast, Futures intraday or Custom), which lines to show, candle colouring.
- Signals on the chart: one switch each for cloud breakouts (with the minimum score), perfect alignment, cloud colour changes, Kijun bounces, Tenkan/Kijun crosses, Chikou open air, price far from Kijun, flat Span B levels and Kijun stop dots.
- Hosoda theories: wave structure, price targets (which to draw), time windows, time × price boxes and swing size.
- Panel & chart key: Simple or Detailed panel, position, text sizes, chart key, higher timeframes (auto or manual).
- Alerts.
- Colours.
- Advanced · Breakout score: full-cloud rule, weights of each check, choppy-market handling.
- Advanced · Fine tuning: spacing between marks, double-top tolerance, time-window anchors, flat Span B rules and the far-from-Kijun threshold.
Works on any symbol and timeframe. It is designed for liquid markets such as gold, forex, indices and crypto on intraday to daily charts.
LIMITATIONS
- No proven edge. In our own checks (XAUUSD 5m, 1h and 4h, EURUSD 1h, BTCUSDT 1h), breakouts, Kijun bounces and Kanzen signals each reached +1 ATR before −1 ATR about half the time. Breakouts scoring 75+ did slightly better than lower-scoring ones (about 53% vs 50%), but on too few cases to rely on. The score is a checklist of classic Ichimoku confirmations, not a probability.
- Hosoda's theories did not beat chance in our checks either: N and E targets were reached about as often as plain levels at the same distance, and swings formed on time windows only about 2 points more often than chance. Hosoda targets, time windows and kasanari are classical reference points, not forecasts.
- Swings are confirmed a set number of bars after they form, and a more extreme swing of the same kind confirming before the opposite one replaces the last swing (its wave label moves with it); price targets already projected do not change. Open targets expire after 500 bars.
- Cloud colour change dots are filtered (a minimum spacing and a minimum speed of Span A / B convergence, set under Advanced · Fine tuning), so small back-and-forth crosses in flat markets are not marked.
- Ichimoku works best in trending markets; in ranges, breakouts and cloud twists come and go often.
- Higher-timeframe values come from the last closed higher-timeframe bar, so they update only when that bar closes.
DISCLAIMER
Ichimoku Cloud Pro is an analysis and charting tool for educational purposes. It does not give financial advice, buy or sell signals, or any guarantee of results. Past behaviour does not ensure future results. Trading involves substantial risk of loss. Always use your own judgement and risk management.
Every signal is decided at bar close and never repaints. Projections ahead of price (Hosoda target lines, time windows) update as new swings confirm.
WHAT IT SHOWS
- The cloud ahead: Senkou Span A and B are calculated before they are drawn, so the future cloud is already known. A small dot marks the candle on which Span A crosses Span B (the moment the cloud turns), and the panel counts the bars until the drawn cloud changes colour ("flips ▲ in 24 bars").
- Cloud breakouts with a score: a breakout is a close through the whole cloud (coming from the other side, not a dip into the cloud and back). Each one gets a 0-100 checklist score: cloud thickness crossed, Chikou clear, Tenkan/Kijun alignment, close-through margin, higher-timeframe agreement, relative volume and RSI, with a chop filter. Breakouts above your minimum score get a badge; hover it for the full breakdown. "CT" marks a breakout against every higher timeframe, "CH" one in choppy conditions.
- Hosoda's three theories, built from confirmed swings:
- Wave theory: each swing is labelled with its wave type: I (one leg), V (reversal), N (continuation), P (narrowing), Y (widening) or W (double top / bottom). Hover a letter for its meaning.
- Price theory: when a pullback C confirms between A and B, the V, N, E, NT, 2E and 3E targets are projected. A target turns solid with ✓ when reached; if price closes beyond C first, it is removed.
- Time theory: future time windows from Hosoda's basic numbers (Kihon Sūchi: 9, 17, 26, 33, 42, 65, 76, 129, 172, 200, 226, 257) counted from the last one to three swings, plus Taito Sūchi (the last leg's length repeated). Windows where two or more counts agree are gold, with a dotted line; their numbers (for example "◆ 33+26") show which counts agree.
- Kasanari: a small gold box where the next gold time windows meet the nearest open price target.
- Perfect alignment (Kanzen, ◆): price, Tenkan, Kijun, the cloud and Chikou all in order.
- Optional marks: Kijun bounces, Tenkan/Kijun crosses, flat Span B levels, Chikou "open air" (clear of the cloud and of the candles it is about to move through), price far from Kijun and Kijun stop dots.
A small chart key (bottom left, can be turned off) explains every mark on the chart.
THE PANEL
Simple mode (default), in plain words:
- Bias: five classic Ichimoku checks (price vs. cloud, Tenkan vs. Kijun, Chikou, the cloud ahead, Kijun slope) summed into Bullish, Leaning bullish, Mixed, Leaning bearish or Bearish, with how many checks point each way (for example 3▲ 1▼). Hover it to see each check.
- Higher timeframes: the Ichimoku regime on two higher timeframes (chosen automatically, 4× and 16× the chart, or set manually), read from their last closed bar, with ✓ when the chart and both agree.
- Cloud: bullish or bearish, thin, medium or thick, and how many bars until it flips colour.
- Next price target: the nearest open Hosoda target of the latest wave, among the targets you chose to draw.
- Next time window: bars to the next Hosoda time window, and to the next gold one.
- Last signal: the latest breakout, Kanzen, Kijun bounce or cloud turn shown on the chart, and how many bars ago.
Detailed mode adds Kijun slope and distance, Chikou state (obstructed, clear, open air), trending or choppy market, and the latest wave type in words.
HOW TO USE IT
- Read the Bias and Cloud rows first: they tell you which side the Ichimoku structure favours, whether the higher timeframes agree, and whether the cloud is about to turn.
- Treat breakout badges, Kanzen, Hosoda targets and time windows as structure to plan around (bias, levels, timing), combined with your own entry, risk and exit rules.
- Alerts: tick the events you want in the settings and create one "Any alert() function call" alert to receive them all, with score, price and targets in the message. Single events are also available as separate alert conditions.
SETTINGS
The everyday settings come first; fine-tuning sits in two Advanced sections at the bottom.
- Ichimoku: line lengths (Traditional, Crypto 24/7, Forex 5-day, Fast, Futures intraday or Custom), which lines to show, candle colouring.
- Signals on the chart: one switch each for cloud breakouts (with the minimum score), perfect alignment, cloud colour changes, Kijun bounces, Tenkan/Kijun crosses, Chikou open air, price far from Kijun, flat Span B levels and Kijun stop dots.
- Hosoda theories: wave structure, price targets (which to draw), time windows, time × price boxes and swing size.
- Panel & chart key: Simple or Detailed panel, position, text sizes, chart key, higher timeframes (auto or manual).
- Alerts.
- Colours.
- Advanced · Breakout score: full-cloud rule, weights of each check, choppy-market handling.
- Advanced · Fine tuning: spacing between marks, double-top tolerance, time-window anchors, flat Span B rules and the far-from-Kijun threshold.
Works on any symbol and timeframe. It is designed for liquid markets such as gold, forex, indices and crypto on intraday to daily charts.
LIMITATIONS
- No proven edge. In our own checks (XAUUSD 5m, 1h and 4h, EURUSD 1h, BTCUSDT 1h), breakouts, Kijun bounces and Kanzen signals each reached +1 ATR before −1 ATR about half the time. Breakouts scoring 75+ did slightly better than lower-scoring ones (about 53% vs 50%), but on too few cases to rely on. The score is a checklist of classic Ichimoku confirmations, not a probability.
- Hosoda's theories did not beat chance in our checks either: N and E targets were reached about as often as plain levels at the same distance, and swings formed on time windows only about 2 points more often than chance. Hosoda targets, time windows and kasanari are classical reference points, not forecasts.
- Swings are confirmed a set number of bars after they form, and a more extreme swing of the same kind confirming before the opposite one replaces the last swing (its wave label moves with it); price targets already projected do not change. Open targets expire after 500 bars.
- Cloud colour change dots are filtered (a minimum spacing and a minimum speed of Span A / B convergence, set under Advanced · Fine tuning), so small back-and-forth crosses in flat markets are not marked.
- Ichimoku works best in trending markets; in ranges, breakouts and cloud twists come and go often.
- Higher-timeframe values come from the last closed higher-timeframe bar, so they update only when that bar closes.
DISCLAIMER
Ichimoku Cloud Pro is an analysis and charting tool for educational purposes. It does not give financial advice, buy or sell signals, or any guarantee of results. Past behaviour does not ensure future results. Trading involves substantial risk of loss. Always use your own judgement and risk management.

◆ AxeAlgo | axealgo.com
6 years building Pine Script indicators & strategies
6 years building Pine Script indicators & strategies
Declinazione di responsabilità
Le informazioni e le pubblicazioni non sono intese come, e non costituiscono, consulenza o raccomandazioni finanziarie, di investimento, di trading o di altro tipo fornite o approvate da TradingView. Per ulteriori informazioni, consultare i Termini di utilizzo.
◆ AxeAlgo | axealgo.com
6 years building Pine Script indicators & strategies
6 years building Pine Script indicators & strategies
Declinazione di responsabilità
Le informazioni e le pubblicazioni non sono intese come, e non costituiscono, consulenza o raccomandazioni finanziarie, di investimento, di trading o di altro tipo fornite o approvate da TradingView. Per ulteriori informazioni, consultare i Termini di utilizzo.