Heartbeat Rhythm Detector [forexobroker]
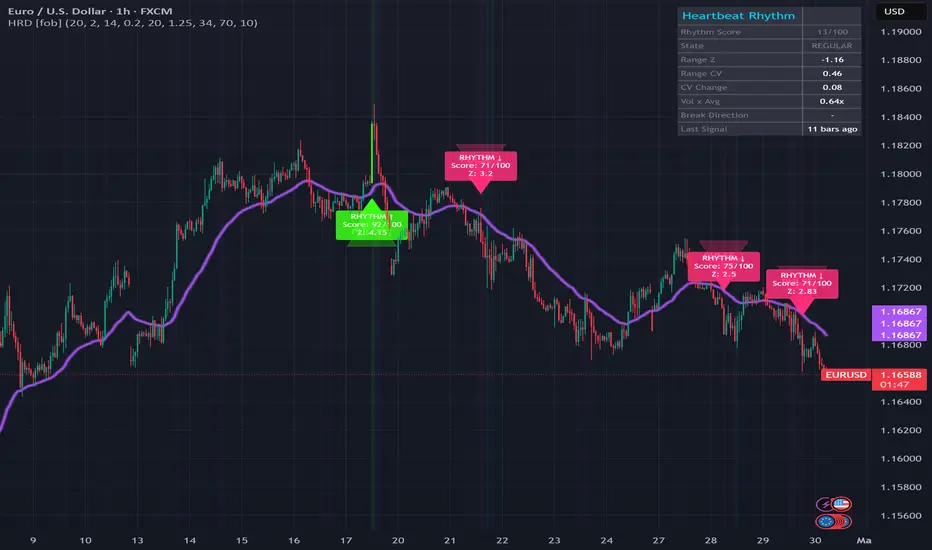
Heartbeat Rhythm Detector tracks the rhythm of bar ranges over a rolling window and fires when the rhythm breaks -- when a single bar's range becomes a statistical outlier (high z-score) with directional close and volume confirmation. A healthy market has a regular heartbeat of similar-sized bars; a broken rhythm marks a real shift.
Built for traders who want to enter when the market's normal volatility cadence abruptly changes, usually at the onset of a new trend leg.
🔶 CONCEPTS
Rhythm is regularity. If the last 20 bars all have similar ranges, the range distribution is tight, and the z-score of any given bar is small. When a single bar prints a range that is two or more standard deviations above the rolling mean, the rhythm has broken -- something out of the ordinary has happened. If the close confirms a direction and volume supports it, the rhythm break is real and tradable. Rising coefficient of variation adds an extra confirm: irregularity was building before the break itself.
🔶 HOW IT WORKS
- Measures current bar range (high - low)
- Computes rolling mean and standard deviation of range over the Rhythm Window
- Calculates range z-score
- Computes coefficient of variation (stddev / mean) of ranges and its change over the window
- Confirms volume exceeds average by the volume multiplier
- Combines z-score magnitude, CV rise, volume excess, and EMA slope into a 0-100 Rhythm Score
- Classifies state as REGULAR, IRREGULAR, SPIKE, or ARRHYTHMIA
- Fires signal on rhythm-break bar with matching directional close and bias
🔶 HOW TO USE
1. Add the indicator -- background tints by rhythm state
2. Watch the dashboard (top-right) for live range z-score, CV, CV change, volume ratio, and break direction
3. Green BUY triangles with "PULSE ↑" label fire on bullish rhythm breaks; pink SELL triangles on bearish
4. The Bias EMA plotted with glow gates signals to macro direction
5. Raise Rhythm Break Z-Score for only extreme outliers; lower it for more frequent signals
🔶 FEATURES
- Non-repainting signals (barstate.isconfirmed)
- Works on all timeframes and instruments
- 9 alert conditions with JSON webhook support
- Statistical outlier detection in bar ranges (not just ATR expansion)
- Coefficient-of-variation context that confirms increasing irregularity
🔶 SETTINGS GUIDE
- Rhythm Window -- Bars used to measure range mean, stddev, and CV
- Rhythm Break Z-Score -- Required range z-score to qualify as a rhythm break
- ATR Length -- ATR period (used for label offsets)
- Rising CV Floor -- Minimum CV increase over the window to count as rhythm shift
- Volume Average Length / Volume Multiplier -- Volume confirmation criterion
- Bias EMA Length -- Macro EMA used to gate signals
- Rhythm Score Threshold -- Minimum 0-100 score required at fire
- Signal Cooldown Bars -- Minimum bars between consecutive signals
🔶 ALERTS
- HRD Buy Pulse -- Bullish rhythm break confirmed
- HRD Sell Pulse -- Bearish rhythm break confirmed
- HRD Any Signal -- Any rhythm signal
- HRD Arrhythmia -- Rhythm score reaches 85+
- HRD Up Break -- Bullish rhythm break event
- HRD Down Break -- Bearish rhythm break event
- HRD Range Z-Spike -- Range z-score above threshold (informational)
- HRD Rising CV -- Range coefficient of variation increasing
- HRD Webhook JSON -- Generic webhook payload for external automation
🔶 LIMITATIONS & DISCLAIMER
- This is a technical analysis tool, not financial advice. Always use proper risk management.
- Z-score normalization adapts to recent rhythm; regime shifts can temporarily mis-scale thresholds.
- News-driven spikes can cause rhythm breaks unrelated to structural change.
- The Rhythm Score is a composite heuristic, not a calibrated probability.
Built for traders who want to enter when the market's normal volatility cadence abruptly changes, usually at the onset of a new trend leg.
🔶 CONCEPTS
Rhythm is regularity. If the last 20 bars all have similar ranges, the range distribution is tight, and the z-score of any given bar is small. When a single bar prints a range that is two or more standard deviations above the rolling mean, the rhythm has broken -- something out of the ordinary has happened. If the close confirms a direction and volume supports it, the rhythm break is real and tradable. Rising coefficient of variation adds an extra confirm: irregularity was building before the break itself.
🔶 HOW IT WORKS
- Measures current bar range (high - low)
- Computes rolling mean and standard deviation of range over the Rhythm Window
- Calculates range z-score
- Computes coefficient of variation (stddev / mean) of ranges and its change over the window
- Confirms volume exceeds average by the volume multiplier
- Combines z-score magnitude, CV rise, volume excess, and EMA slope into a 0-100 Rhythm Score
- Classifies state as REGULAR, IRREGULAR, SPIKE, or ARRHYTHMIA
- Fires signal on rhythm-break bar with matching directional close and bias
🔶 HOW TO USE
1. Add the indicator -- background tints by rhythm state
2. Watch the dashboard (top-right) for live range z-score, CV, CV change, volume ratio, and break direction
3. Green BUY triangles with "PULSE ↑" label fire on bullish rhythm breaks; pink SELL triangles on bearish
4. The Bias EMA plotted with glow gates signals to macro direction
5. Raise Rhythm Break Z-Score for only extreme outliers; lower it for more frequent signals
🔶 FEATURES
- Non-repainting signals (barstate.isconfirmed)
- Works on all timeframes and instruments
- 9 alert conditions with JSON webhook support
- Statistical outlier detection in bar ranges (not just ATR expansion)
- Coefficient-of-variation context that confirms increasing irregularity
🔶 SETTINGS GUIDE
- Rhythm Window -- Bars used to measure range mean, stddev, and CV
- Rhythm Break Z-Score -- Required range z-score to qualify as a rhythm break
- ATR Length -- ATR period (used for label offsets)
- Rising CV Floor -- Minimum CV increase over the window to count as rhythm shift
- Volume Average Length / Volume Multiplier -- Volume confirmation criterion
- Bias EMA Length -- Macro EMA used to gate signals
- Rhythm Score Threshold -- Minimum 0-100 score required at fire
- Signal Cooldown Bars -- Minimum bars between consecutive signals
🔶 ALERTS
- HRD Buy Pulse -- Bullish rhythm break confirmed
- HRD Sell Pulse -- Bearish rhythm break confirmed
- HRD Any Signal -- Any rhythm signal
- HRD Arrhythmia -- Rhythm score reaches 85+
- HRD Up Break -- Bullish rhythm break event
- HRD Down Break -- Bearish rhythm break event
- HRD Range Z-Spike -- Range z-score above threshold (informational)
- HRD Rising CV -- Range coefficient of variation increasing
- HRD Webhook JSON -- Generic webhook payload for external automation
🔶 LIMITATIONS & DISCLAIMER
- This is a technical analysis tool, not financial advice. Always use proper risk management.
- Z-score normalization adapts to recent rhythm; regime shifts can temporarily mis-scale thresholds.
- News-driven spikes can cause rhythm breaks unrelated to structural change.
- The Rhythm Score is a composite heuristic, not a calibrated probability.

🔵Gain access to our powerful tools : kestutisbalciunas.com/tradingview/
🔵Join our free telegram for updates : t.me/algotradingedge
All scripts & content provided by Forexobroker are for informational & educational purposes only.
🔵Join our free telegram for updates : t.me/algotradingedge
All scripts & content provided by Forexobroker are for informational & educational purposes only.
Declinazione di responsabilità
Le informazioni e le pubblicazioni non sono intese come, e non costituiscono, consulenza o raccomandazioni finanziarie, di investimento, di trading o di altro tipo fornite o approvate da TradingView. Per ulteriori informazioni, consultare i Termini di utilizzo.
🔵Gain access to our powerful tools : kestutisbalciunas.com/tradingview/
🔵Join our free telegram for updates : t.me/algotradingedge
All scripts & content provided by Forexobroker are for informational & educational purposes only.
🔵Join our free telegram for updates : t.me/algotradingedge
All scripts & content provided by Forexobroker are for informational & educational purposes only.
Declinazione di responsabilità
Le informazioni e le pubblicazioni non sono intese come, e non costituiscono, consulenza o raccomandazioni finanziarie, di investimento, di trading o di altro tipo fornite o approvate da TradingView. Per ulteriori informazioni, consultare i Termini di utilizzo.