Aggiornato
CTZ Hash Ribbons Pro
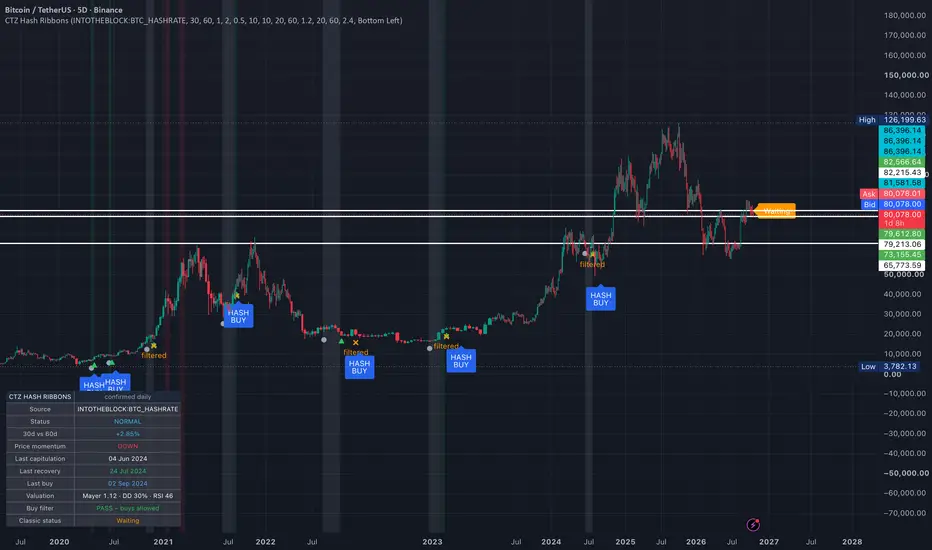
CTZ Hash Ribbons Pro
OVERVIEW
An upgraded Hash Ribbons indicator for Bitcoin. It tracks miner capitulation and recovery using the Bitcoin hash rate, and gives a buy signal when miners recover and price momentum turns up – now with an overbought filter so signals don't fire near cycle tops. Everything is drawn directly on the price chart.
Hash Ribbons concept originally created by Charles Edwards (Capriole Investments). This version rebuilds it in Pine Script v6 with non-repainting data, daily-only calculations, noise filters and a valuation filter.
HOW IT WORKS
1. Miner capitulation
When the 30-day SMA of the hash rate falls below the 60-day SMA, miners are switching off machines – usually because mining has become unprofitable. This is a capitulation phase (grey background).
2. Recovery
When the 30-day SMA rises back inside the capitulation, the hash rate is recovering (green background). When it crosses back above the 60-day SMA, the capitulation is over (▲ recovery marker).
3. Buy signal
After a recovery, a HASH BUY prints the first time price momentum turns up (10-day SMA above 20-day SMA), provided the overbought filter passes. One buy per recovery, and it must trigger within 60 days or it expires.
UPGRADES OVER THE CLASSIC VERSION
• Non-repainting – uses confirmed daily values only. Historical signals show exactly what you would have seen in real time.
• Daily calculations – hash rate and price SMAs are calculated on daily data, so signals are identical on any chart timeframe.
• Data source with fallbacks – the old Quandl feed is retired. The script uses INTOTHEBLOCK:BTC_HASHRATE, then BTC_HASHRATE, then QUANDL:BCHAIN/HRATE, and shows which is active.
• Noise filters – a cross threshold (%) and a minimum capitulation length remove the false 1–2 day crosses.
• Overbought / oversold filter – blocks buys when the market is stretched.
OVERBOUGHT FILTER
Each enabled check must pass for a buy:
• Mayer Multiple (price / 200-day SMA) at or below 1.2 – cycle bottoms usually print below ~1.1, tops 1.4 to 2.4+
• Price at least 20% below its 365-day high – no buys just under the highs
• Daily RSI(14) at or below 60 – no buys when price is already stretched
If momentum turns up but the market is overbought, the buy is blocked and marked with an orange "filtered" cross. By default the script keeps waiting inside the buy window, so if price pulls back and passes the filter the buy can still fire.
OVERHEATED ZONE
When the Mayer Multiple reaches 2.4 or above (historically top territory), the chart is shaded red and no buys are possible.
WHAT YOU SEE ON THE CHART
• Grey background – miner capitulation
• Green background – hash rate recovering
• Red background – overheated (Mayer Multiple ≥ 2.4)
• ● – capitulation start
• ▲ – recovery (capitulation over)
• HASH BUY – buy signal
• ✕ filtered – buy blocked by the overbought filter
Hash rate SMA values and the 30d vs 60d % are available in the Data Window.
DASHBOARD
• Data source in use
• Status – Capitulation (day count), Recovering, Recovered – waiting for momentum, or Normal
• 30d vs 60d hash rate difference %
• Price momentum (up / down)
• Dates of the last capitulation, recovery and buy
• Valuation – Mayer Multiple, drawdown from 1-year high, daily RSI
• Buy filter – PASS, BLOCKED or OVERHEATED
HOW TO USE IT
• Hash Ribbon buys have historically appeared near major Bitcoin cycle bottoms – best used on the daily chart for long-term positioning, not short-term trading.
• A buy that passes the overbought filter after a long capitulation is the strongest signal.
• Combine with cycle timing, on-chain or order-flow tools for confirmation.
SETTINGS
• Hash rate symbol and auto-fallback
• Non-repainting on/off
• Short / long SMA lengths and optional pre-smoothing
• Cross threshold % and minimum capitulation length (set both to 0 for classic behaviour)
• Price momentum SMAs and buy window
• Overbought filter thresholds, each switchable on/off
• Overheated threshold, background shading, signals, dashboard position
ALERTS
• Miner capitulation started
• Hash rate recovering
• Miner capitulation ended (recovery)
• Hash Ribbon BUY
• Hash Ribbon buy filtered
• Overheated zone entered
LIMITATIONS
• Hash rate data is published daily with a delay, and non-repainting mode adds one more day – signals are slow by design.
• Data providers change symbol names; if the dashboard shows "no data", search TradingView for "hash rate" and enter the symbol in settings.
• Bitcoin only (hash rate data).
• Past signals do not guarantee future results.
This indicator is a tool for on-chain analysis and is not financial advice. Always use your own risk management.
OVERVIEW
An upgraded Hash Ribbons indicator for Bitcoin. It tracks miner capitulation and recovery using the Bitcoin hash rate, and gives a buy signal when miners recover and price momentum turns up – now with an overbought filter so signals don't fire near cycle tops. Everything is drawn directly on the price chart.
Hash Ribbons concept originally created by Charles Edwards (Capriole Investments). This version rebuilds it in Pine Script v6 with non-repainting data, daily-only calculations, noise filters and a valuation filter.
HOW IT WORKS
1. Miner capitulation
When the 30-day SMA of the hash rate falls below the 60-day SMA, miners are switching off machines – usually because mining has become unprofitable. This is a capitulation phase (grey background).
2. Recovery
When the 30-day SMA rises back inside the capitulation, the hash rate is recovering (green background). When it crosses back above the 60-day SMA, the capitulation is over (▲ recovery marker).
3. Buy signal
After a recovery, a HASH BUY prints the first time price momentum turns up (10-day SMA above 20-day SMA), provided the overbought filter passes. One buy per recovery, and it must trigger within 60 days or it expires.
UPGRADES OVER THE CLASSIC VERSION
• Non-repainting – uses confirmed daily values only. Historical signals show exactly what you would have seen in real time.
• Daily calculations – hash rate and price SMAs are calculated on daily data, so signals are identical on any chart timeframe.
• Data source with fallbacks – the old Quandl feed is retired. The script uses INTOTHEBLOCK:BTC_HASHRATE, then BTC_HASHRATE, then QUANDL:BCHAIN/HRATE, and shows which is active.
• Noise filters – a cross threshold (%) and a minimum capitulation length remove the false 1–2 day crosses.
• Overbought / oversold filter – blocks buys when the market is stretched.
OVERBOUGHT FILTER
Each enabled check must pass for a buy:
• Mayer Multiple (price / 200-day SMA) at or below 1.2 – cycle bottoms usually print below ~1.1, tops 1.4 to 2.4+
• Price at least 20% below its 365-day high – no buys just under the highs
• Daily RSI(14) at or below 60 – no buys when price is already stretched
If momentum turns up but the market is overbought, the buy is blocked and marked with an orange "filtered" cross. By default the script keeps waiting inside the buy window, so if price pulls back and passes the filter the buy can still fire.
OVERHEATED ZONE
When the Mayer Multiple reaches 2.4 or above (historically top territory), the chart is shaded red and no buys are possible.
WHAT YOU SEE ON THE CHART
• Grey background – miner capitulation
• Green background – hash rate recovering
• Red background – overheated (Mayer Multiple ≥ 2.4)
• ● – capitulation start
• ▲ – recovery (capitulation over)
• HASH BUY – buy signal
• ✕ filtered – buy blocked by the overbought filter
Hash rate SMA values and the 30d vs 60d % are available in the Data Window.
DASHBOARD
• Data source in use
• Status – Capitulation (day count), Recovering, Recovered – waiting for momentum, or Normal
• 30d vs 60d hash rate difference %
• Price momentum (up / down)
• Dates of the last capitulation, recovery and buy
• Valuation – Mayer Multiple, drawdown from 1-year high, daily RSI
• Buy filter – PASS, BLOCKED or OVERHEATED
HOW TO USE IT
• Hash Ribbon buys have historically appeared near major Bitcoin cycle bottoms – best used on the daily chart for long-term positioning, not short-term trading.
• A buy that passes the overbought filter after a long capitulation is the strongest signal.
• Combine with cycle timing, on-chain or order-flow tools for confirmation.
SETTINGS
• Hash rate symbol and auto-fallback
• Non-repainting on/off
• Short / long SMA lengths and optional pre-smoothing
• Cross threshold % and minimum capitulation length (set both to 0 for classic behaviour)
• Price momentum SMAs and buy window
• Overbought filter thresholds, each switchable on/off
• Overheated threshold, background shading, signals, dashboard position
ALERTS
• Miner capitulation started
• Hash rate recovering
• Miner capitulation ended (recovery)
• Hash Ribbon BUY
• Hash Ribbon buy filtered
• Overheated zone entered
LIMITATIONS
• Hash rate data is published daily with a delay, and non-repainting mode adds one more day – signals are slow by design.
• Data providers change symbol names; if the dashboard shows "no data", search TradingView for "hash rate" and enter the symbol in settings.
• Bitcoin only (hash rate data).
• Past signals do not guarantee future results.
This indicator is a tool for on-chain analysis and is not financial advice. Always use your own risk management.
Note di rilascio
CTZ Hash Ribbons Pro
OVERVIEW
An upgraded Hash Ribbons indicator for Bitcoin. It tracks miner capitulation and recovery from the Bitcoin hash rate and gives a buy signal when miners recover and price momentum turns up – with capitulation filters to remove noise and an overbought filter so signals don't fire near cycle tops. Everything is drawn directly on the price chart.
Hash Ribbons concept originally created by Charles Edwards (Capriole Investments). This version rebuilds it in Pine Script v6 with non-repainting data, daily-only calculations, noise filters and a valuation filter.
HOW IT WORKS
1. Miner capitulation
When the 30-day SMA of the hash rate falls below the 60-day SMA, miners are switching off machines – usually because mining has become unprofitable.
2. Recovery
When the 30-day SMA turns up inside a capitulation, the hash rate is recovering. When it crosses back above the 60-day SMA, the capitulation is over.
3. Buy signal
After a recovery, a HASH BUY prints the first time price momentum turns up (10-day SMA above 20-day SMA), provided the overbought filter passes. One buy per recovery, and it must trigger within 60 days or it expires.
CAPITULATION FILTERS
• Start threshold – the 30-day SMA must be 2% below the 60-day SMA to start a capitulation (classic version: any cross).
• Confirmation – a capitulation only counts once it has lasted 10 days. The start marker prints on the confirmation day.
• Shorter dips are ignored completely: no marker, no recovery and no buy.
• Recovery threshold – the 30-day SMA must be 0.5% above the 60-day SMA to end the capitulation.
OVERBOUGHT FILTER
Each enabled check must pass for a buy:
• Mayer Multiple (price / 200-day SMA) at or below 1.2 – cycle bottoms usually print below ~1.1, tops 1.4 to 2.4+
• Price at least 20% below its 365-day high
• Daily RSI(14) at or below 60
If momentum turns up but the market is overbought, the buy is blocked and marked "filtered". The script keeps waiting inside the buy window, so if price pulls back and passes the filter, the buy can still fire.
OVERHEATED ZONE
When the Mayer Multiple reaches 2.4 or above – historically top territory – the chart is shaded red and no buys are possible.
UPGRADES OVER THE CLASSIC VERSION
• Non-repainting – confirmed daily values only; historical signals show what you would have seen in real time.
• Daily calculations – hash rate and price SMAs use daily data, so signals are the same on any chart timeframe.
• Data source with fallbacks – the old Quandl feed is retired. Uses INTOTHEBLOCK:BTC_HASHRATE, then BTC_HASHRATE, then QUANDL:BCHAIN/HRATE, and shows which is active.
• Capitulation filters, overbought filter and overheated zone (above).
WHAT YOU SEE ON THE CHART
• ● grey dot – capitulation confirmed (started)
• Grey background – capitulation in progress
• Green background – hash rate recovering
• ▲ green triangle – capitulation over (recovery)
• HASH BUY – buy signal
• ✕ filtered – buy blocked by the overbought filter
• Red background – overheated zone
• Status label beside price – classic status: Miner Capitulation, Recovery Confirmed or Waiting
Order of events: ● → grey → green → ▲ → HASH BUY
Hash rate SMA values and the 30d vs 60d % are in the Data Window.
DASHBOARD
• Data source in use
• Status (filtered) – Possible Capitulation (day x of 10), Capitulation, Recovering, Recovered – waiting for momentum, or Normal
• 30d vs 60d hash rate difference %
• Price momentum
• Dates of the last capitulation, recovery and buy
• Valuation – Mayer Multiple, drawdown from 1-year high, daily RSI
• Buy filter – PASS, BLOCKED or OVERHEATED
• Classic status – the raw 30/60 reading with no filters, for comparison
HOW TO USE IT
• Hash Ribbon buys have historically appeared near major Bitcoin cycle bottoms – best used on the daily chart for long-term positioning.
• A buy that passes the overbought filter after a long, confirmed capitulation is the strongest signal.
• Compare the filtered Status with the Classic status: when the classic shows Miner Capitulation but the filtered status doesn't, it's a minor dip, not a real capitulation.
• Combine with cycle timing, on-chain or order-flow tools for confirmation.
SETTINGS
• Hash rate symbol, auto-fallback, non-repainting on/off
• Short / long SMA lengths and optional pre-smoothing
• Capitulation start threshold, recovery threshold and confirmation days (all 0 = classic behaviour)
• Price momentum SMAs and buy window
• Overbought filter thresholds, each switchable on/off
• Overheated threshold, shading, signals, status label, dashboard position
ALERTS
• Miner capitulation confirmed
• Hash rate recovering
• Miner capitulation ended (recovery)
• Hash Ribbon BUY
• Hash Ribbon buy filtered
• Overheated zone entered
LIMITATIONS
• Hash rate data is published daily with a delay, non-repainting mode adds one day, and capitulations confirm after 10 days – signals are slow by design.
• Data providers change symbol names; if the dashboard shows "no data", search TradingView for "hash rate" and enter the symbol in settings.
• Bitcoin only (hash rate data).
• Past signals do not guarantee future results.
This indicator is a tool for on-chain analysis and is not financial advice. Always use your own risk management.
```

Declinazione di responsabilità
Le informazioni e le pubblicazioni non sono intese come, e non costituiscono, consulenza o raccomandazioni finanziarie, di investimento, di trading o di altro tipo fornite o approvate da TradingView. Per ulteriori informazioni, consultare i Termini di utilizzo.
Declinazione di responsabilità
Le informazioni e le pubblicazioni non sono intese come, e non costituiscono, consulenza o raccomandazioni finanziarie, di investimento, di trading o di altro tipo fornite o approvate da TradingView. Per ulteriori informazioni, consultare i Termini di utilizzo.