OPEN-SOURCE SCRIPT
Aggiornato Draw On Liquidity Planner [AGPro Series]
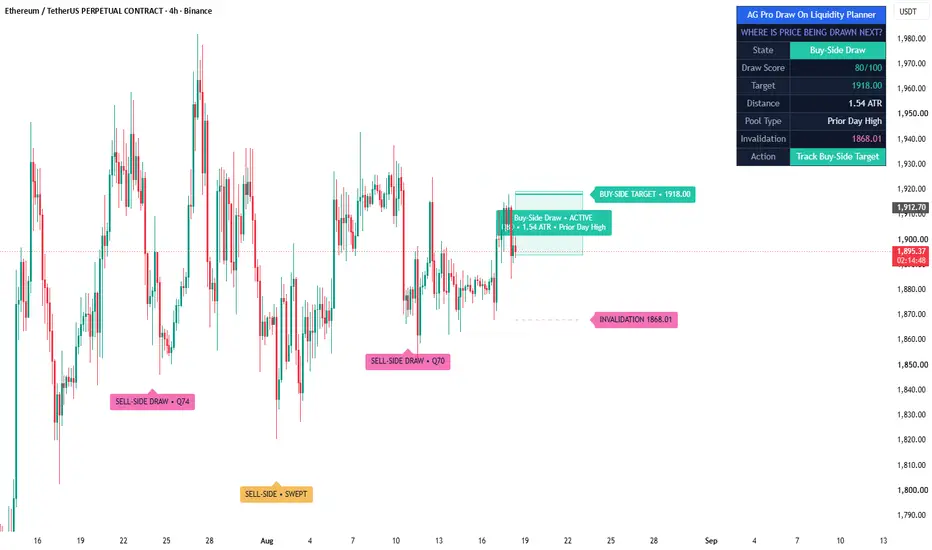
Draw On Liquidity Planner [AGPro Series]
🧠 Core Idea
Of all the liquidity resting around price, which single pool is the dominant draw right now, how strong is that draw, and what level would put it in question?
📌 Overview / What It Does
Draw On Liquidity Planner is a chart-first liquidity decision tool. Instead of drawing every high and low on the screen, it studies the untapped liquidity pools sitting on both sides of price and decides which one is acting as the dominant "draw on liquidity," then frames a complete read around it.
It maps buy-side liquidity above price and sell-side liquidity below price from three sources: clusters of equal highs and equal lows, the prior higher-timeframe high and low, and unmitigated swing points. It tracks which pools are still untapped and which have already been swept. It then scores each side from 0 to 100 and selects the single dominant draw, presenting a clear state, the target pool price, the draw distance in ATR, the pool type, a structural invalidation reference, and a plain next-action read in a clean panel.
The script does not predict price, generate buy or sell signals, or automate trades. It organizes scattered liquidity into one structured draw decision so the chart can be read with intent instead of guesswork.
🎯 Purpose & Design Philosophy
This planner was built to close a specific gap. Many liquidity tools fall into one of two traps: they map every level at once until the chart is unreadable, or they only flag a sweep after it has already happened. Neither answers the first question a liquidity-focused trader actually asks: of everything resting around price, which side is the real magnet, and how convinced should I be?
Draw On Liquidity Planner is designed for patient, context-driven traders who think in terms of where liquidity rests and where price is being pulled. It supports a planning mindset rather than a reflex: identify the dominant draw, note the target and the invalidation, gauge conviction from the score, and then wait for the market to confirm or reject that context. It is a decision-support layer, not a trigger.
⚡ Why This Script Is Different
Most liquidity tools either print a dense map of every swing high and low, or they detect a sweep only once it is complete and leave the interpretation to you.
This script does NOT flood the chart with every level, and it does NOT claim to know the next move.
Instead, it ranks both sides of liquidity into a single dominant draw with a transparent 0-100 score, shows one clean target, one structural invalidation, and a light reference map of the remaining pools, and keeps the detailed read in a premium panel so the price area stays clear. The decision layer — which side, how strong, what would invalidate it — is the product. The raw levels are just the inputs.
⚙️ Methodology
The internal logic runs in clear, rule-based steps:
1. Pool Detection
Swing highs and swing lows are detected with an adjustable swing strength and stored as candidate liquidity pools. The prior higher-timeframe high and low can be included as significant pools, and the period adapts to the chart: prior day on intraday charts, prior week on daily charts, and prior month on higher timeframes.
2. Mitigation Tracking
A buy-side pool is marked as taken once price trades through it, and a sell-side pool once price trades under it. Only untapped liquidity is treated as an active draw, so the read reflects what is still resting rather than what has already been consumed.
3. Cluster Evaluation
Nearby untapped levels are grouped using an ATR-based tolerance to recognize equal highs and equal lows. More touches at a level mean stronger resting liquidity, which contributes a higher draw quality.
4. Draw Scoring
Each side receives a 0-100 score built from four components: pool quality (cluster strength and prior-period status), proximity in ATR, directional context from a trend backbone, and pool freshness. The weighting favors quality and proximity while still respecting trend alignment and how recently the pool formed.
5. Dominant Draw Selection
The higher-scoring side becomes the active draw. When the two sides are close, the context is treated as balanced two-sided liquidity rather than forcing a single direction.
6. Visual Output
The active draw is drawn as a thin highlighted zone with a centered badge, a target line, a structural invalidation line, a light reference map of the remaining pools, a single right-edge target tag, and a complete summary panel.
🗺️ How to Read the Chart
- Draw Zone: the thin highlighted band around the dominant liquidity target, with a centered badge showing the state and the 0-100 score.
- Target Line: the solid line at the active draw pool price.
- Invalidation Line: the dashed line at the opposite-side structural reference (the nearest swing on the other side); losing that level weakens the current draw lean.
- Faint Pool Lines: dotted reference lines marking the other untapped pools on each side, as a light liquidity map.
- Target Tag: a single right-edge tag with the active draw target price.
- Event Labels: compact markers that print when the dominant draw flips side or when a liquidity pool is swept. They alternate by side and stay clear of the candles.
- Panel: state, draw score, target, distance, pool type, invalidation, and action.
Colors follow the AG Pro palette: teal for buy-side draws, pink for sell-side draws, and amber for balanced or lower-conviction context.
🚦 Signals & States
• Buy-Side Draw → untapped liquidity above is the dominant magnet
• Sell-Side Draw → untapped liquidity below is the dominant magnet
• Two-Sided → both sides are roughly balanced, with no single dominant draw
• No Draw → no qualifying untapped pool is currently in range
States describe liquidity context only. They are not trade instructions and carry no guarantee of direction.
🔔 Alerts Logic
Alerts are available for:
- Buy-Side Draw: the dominant draw establishes on the buy side with a qualifying score
- Sell-Side Draw: the dominant draw establishes on the sell side with a qualifying score
- Liquidity Pool Swept: a tracked pool is traded through
Alerts are attention markers that flag a change in liquidity context. They are not signals to enter or exit a position, and each alert should be interpreted within the broader market picture.
🧩 Confluence Logic
The draw score is itself a confluence measure. A high score means pool quality, proximity, directional context, and freshness are aligning on the same side. When the active draw also agrees with your higher-timeframe bias and the prevailing structure, the context is stronger. When they disagree, the read deserves more caution, and the score will usually reflect that with a lower value.
📊 When to Use
• Trending markets, where price tends to reach for liquidity in the direction of the trend
• Range edges, where equal highs or equal lows build obvious resting liquidity
• Charts with a clear prior-period high or low acting as a reference draw
• Planning phases, when defining a target and an invalidation before committing to a view
⚠️ When NOT to Use
• Very low-liquidity symbols or thin sessions, where swing structure is unreliable
• Extreme volatility events, where levels are torn through without reaction
• Very low timeframes dominated by noise, where pools form and break too quickly
• As a standalone entry trigger, with no regard for broader context
🎛️ Key Inputs
• Swing Strength → how strong a swing must be to become a pool
• Pool Memory → how many recent pools are retained
• Equal Level Tolerance → how loosely nearby levels merge into a cluster
• Use Prior-Period Pools → include the prior higher-timeframe high and low (day, week, or month by chart)
• Trend Backbone EMA and Slope → the directional context used in scoring
• Max Draw Distance → distance beyond which a pool is treated as too far to be an active draw
• Active Draw Score → minimum score for an emphasized, alert-eligible draw
• Two-Sided Balance Gap → score gap below which liquidity is treated as balanced
• Visual and panel settings → control zones, lines, labels, density, location, theme, and font size
🖥️ Interface & Visual Design
The interface is intentionally restrained. One dominant draw zone, one target line, one structural invalidation reference, a light pool map, and a single target tag keep the chart readable. Event labels alternate by side and point at the candle that produced them, so the chart reads as a clean sequence rather than a cluster. The panel carries the detailed read, and its first row is a single merged brand header. Panel location, theme, and font size are all adjustable, and the panel is shown by default for clarity.
🧪 Practical Usage Workflow
1. Read the panel: note the state and the draw score.
2. Locate the target: confirm the highlighted draw zone and the target line.
3. Check the invalidation: note the opposite-side structural reference.
4. Confirm context: compare with your higher-timeframe bias and structure before acting on any view.
🔍 Interpretation Guidelines
Treat the draw score as a measure of how clearly liquidity leans to one side, not as a probability of profit. A strong, aligned draw is context to plan around. A balanced or weak read is a reason to wait rather than to force a trade. Every output is meant to be interpreted inside the broader market picture, never in isolation.
🚫 What This Script Is NOT
- It is NOT a prediction engine.
- It is NOT financial advice.
- It is NOT an automated trading system.
- It does NOT generate guaranteed signals or outcomes.
⚠️ Limitations & Transparency
Liquidity context behaves differently across timeframes, symbols, and volatility regimes. Pools can be ignored, swept and reversed, or run through without reaction. Swing detection depends on the chosen settings, and prior-period references behave differently across symbols and session types. This tool organizes context and frames a decision; it does not guarantee how price will respond to any level.
🧠 Market Context Notes
Liquidity tends to rest where many participants place stops: above equal highs, below equal lows, and around prior-period extremes. Price often gravitates toward these areas, but the timing and the reaction are never certain. The structure and volatility around a pool shape how meaningful any reaction near it is likely to be, which is why the score blends proximity and trend context rather than distance alone.
🧾 Use Case Examples
• In an uptrend, the planner highlights a buy-side draw at a cluster of equal highs above price, with a recent swing low as the structural invalidation below and a score that reflects how aligned and how close that draw is.
• In a range, the planner shows two-sided liquidity, signaling that no single side is dominant and that patience is warranted until one side resolves.
• After a deep move, the prior-period high or low can become the dominant draw, giving a clear reference target while the invalidation marks where that lean would weaken.
🧱 System Philosophy
The AG Pro approach favors decision-support tools over raw indicators. Each script is built to answer a specific question, present a clean read, and respect the chart. Draw On Liquidity Planner reflects that philosophy by turning scattered liquidity into one structured draw decision with a transparent score and a defined invalidation.
🔐 Non-Promise Statement
This tool offers no guarantees and no certainty about future price movement. It is a structured way to read liquidity context and frame a plan, nothing more.
📉 Risk Disclosure
Trading involves substantial risk. This script is provided for educational and analytical purposes only and does not constitute financial advice. All trading decisions and their outcomes are solely the responsibility of the user.
📚 Educational Note
Use this planner to study how price interacts with resting liquidity over time. Watching which draws are respected, swept, or ignored on your own market and timeframe is a practical way to build liquidity-reading skill and a more structured trading process.
🧠 Core Idea
Of all the liquidity resting around price, which single pool is the dominant draw right now, how strong is that draw, and what level would put it in question?
📌 Overview / What It Does
Draw On Liquidity Planner is a chart-first liquidity decision tool. Instead of drawing every high and low on the screen, it studies the untapped liquidity pools sitting on both sides of price and decides which one is acting as the dominant "draw on liquidity," then frames a complete read around it.
It maps buy-side liquidity above price and sell-side liquidity below price from three sources: clusters of equal highs and equal lows, the prior higher-timeframe high and low, and unmitigated swing points. It tracks which pools are still untapped and which have already been swept. It then scores each side from 0 to 100 and selects the single dominant draw, presenting a clear state, the target pool price, the draw distance in ATR, the pool type, a structural invalidation reference, and a plain next-action read in a clean panel.
The script does not predict price, generate buy or sell signals, or automate trades. It organizes scattered liquidity into one structured draw decision so the chart can be read with intent instead of guesswork.
🎯 Purpose & Design Philosophy
This planner was built to close a specific gap. Many liquidity tools fall into one of two traps: they map every level at once until the chart is unreadable, or they only flag a sweep after it has already happened. Neither answers the first question a liquidity-focused trader actually asks: of everything resting around price, which side is the real magnet, and how convinced should I be?
Draw On Liquidity Planner is designed for patient, context-driven traders who think in terms of where liquidity rests and where price is being pulled. It supports a planning mindset rather than a reflex: identify the dominant draw, note the target and the invalidation, gauge conviction from the score, and then wait for the market to confirm or reject that context. It is a decision-support layer, not a trigger.
⚡ Why This Script Is Different
Most liquidity tools either print a dense map of every swing high and low, or they detect a sweep only once it is complete and leave the interpretation to you.
This script does NOT flood the chart with every level, and it does NOT claim to know the next move.
Instead, it ranks both sides of liquidity into a single dominant draw with a transparent 0-100 score, shows one clean target, one structural invalidation, and a light reference map of the remaining pools, and keeps the detailed read in a premium panel so the price area stays clear. The decision layer — which side, how strong, what would invalidate it — is the product. The raw levels are just the inputs.
⚙️ Methodology
The internal logic runs in clear, rule-based steps:
1. Pool Detection
Swing highs and swing lows are detected with an adjustable swing strength and stored as candidate liquidity pools. The prior higher-timeframe high and low can be included as significant pools, and the period adapts to the chart: prior day on intraday charts, prior week on daily charts, and prior month on higher timeframes.
2. Mitigation Tracking
A buy-side pool is marked as taken once price trades through it, and a sell-side pool once price trades under it. Only untapped liquidity is treated as an active draw, so the read reflects what is still resting rather than what has already been consumed.
3. Cluster Evaluation
Nearby untapped levels are grouped using an ATR-based tolerance to recognize equal highs and equal lows. More touches at a level mean stronger resting liquidity, which contributes a higher draw quality.
4. Draw Scoring
Each side receives a 0-100 score built from four components: pool quality (cluster strength and prior-period status), proximity in ATR, directional context from a trend backbone, and pool freshness. The weighting favors quality and proximity while still respecting trend alignment and how recently the pool formed.
5. Dominant Draw Selection
The higher-scoring side becomes the active draw. When the two sides are close, the context is treated as balanced two-sided liquidity rather than forcing a single direction.
6. Visual Output
The active draw is drawn as a thin highlighted zone with a centered badge, a target line, a structural invalidation line, a light reference map of the remaining pools, a single right-edge target tag, and a complete summary panel.
🗺️ How to Read the Chart
- Draw Zone: the thin highlighted band around the dominant liquidity target, with a centered badge showing the state and the 0-100 score.
- Target Line: the solid line at the active draw pool price.
- Invalidation Line: the dashed line at the opposite-side structural reference (the nearest swing on the other side); losing that level weakens the current draw lean.
- Faint Pool Lines: dotted reference lines marking the other untapped pools on each side, as a light liquidity map.
- Target Tag: a single right-edge tag with the active draw target price.
- Event Labels: compact markers that print when the dominant draw flips side or when a liquidity pool is swept. They alternate by side and stay clear of the candles.
- Panel: state, draw score, target, distance, pool type, invalidation, and action.
Colors follow the AG Pro palette: teal for buy-side draws, pink for sell-side draws, and amber for balanced or lower-conviction context.
🚦 Signals & States
• Buy-Side Draw → untapped liquidity above is the dominant magnet
• Sell-Side Draw → untapped liquidity below is the dominant magnet
• Two-Sided → both sides are roughly balanced, with no single dominant draw
• No Draw → no qualifying untapped pool is currently in range
States describe liquidity context only. They are not trade instructions and carry no guarantee of direction.
🔔 Alerts Logic
Alerts are available for:
- Buy-Side Draw: the dominant draw establishes on the buy side with a qualifying score
- Sell-Side Draw: the dominant draw establishes on the sell side with a qualifying score
- Liquidity Pool Swept: a tracked pool is traded through
Alerts are attention markers that flag a change in liquidity context. They are not signals to enter or exit a position, and each alert should be interpreted within the broader market picture.
🧩 Confluence Logic
The draw score is itself a confluence measure. A high score means pool quality, proximity, directional context, and freshness are aligning on the same side. When the active draw also agrees with your higher-timeframe bias and the prevailing structure, the context is stronger. When they disagree, the read deserves more caution, and the score will usually reflect that with a lower value.
📊 When to Use
• Trending markets, where price tends to reach for liquidity in the direction of the trend
• Range edges, where equal highs or equal lows build obvious resting liquidity
• Charts with a clear prior-period high or low acting as a reference draw
• Planning phases, when defining a target and an invalidation before committing to a view
⚠️ When NOT to Use
• Very low-liquidity symbols or thin sessions, where swing structure is unreliable
• Extreme volatility events, where levels are torn through without reaction
• Very low timeframes dominated by noise, where pools form and break too quickly
• As a standalone entry trigger, with no regard for broader context
🎛️ Key Inputs
• Swing Strength → how strong a swing must be to become a pool
• Pool Memory → how many recent pools are retained
• Equal Level Tolerance → how loosely nearby levels merge into a cluster
• Use Prior-Period Pools → include the prior higher-timeframe high and low (day, week, or month by chart)
• Trend Backbone EMA and Slope → the directional context used in scoring
• Max Draw Distance → distance beyond which a pool is treated as too far to be an active draw
• Active Draw Score → minimum score for an emphasized, alert-eligible draw
• Two-Sided Balance Gap → score gap below which liquidity is treated as balanced
• Visual and panel settings → control zones, lines, labels, density, location, theme, and font size
🖥️ Interface & Visual Design
The interface is intentionally restrained. One dominant draw zone, one target line, one structural invalidation reference, a light pool map, and a single target tag keep the chart readable. Event labels alternate by side and point at the candle that produced them, so the chart reads as a clean sequence rather than a cluster. The panel carries the detailed read, and its first row is a single merged brand header. Panel location, theme, and font size are all adjustable, and the panel is shown by default for clarity.
🧪 Practical Usage Workflow
1. Read the panel: note the state and the draw score.
2. Locate the target: confirm the highlighted draw zone and the target line.
3. Check the invalidation: note the opposite-side structural reference.
4. Confirm context: compare with your higher-timeframe bias and structure before acting on any view.
🔍 Interpretation Guidelines
Treat the draw score as a measure of how clearly liquidity leans to one side, not as a probability of profit. A strong, aligned draw is context to plan around. A balanced or weak read is a reason to wait rather than to force a trade. Every output is meant to be interpreted inside the broader market picture, never in isolation.
🚫 What This Script Is NOT
- It is NOT a prediction engine.
- It is NOT financial advice.
- It is NOT an automated trading system.
- It does NOT generate guaranteed signals or outcomes.
⚠️ Limitations & Transparency
Liquidity context behaves differently across timeframes, symbols, and volatility regimes. Pools can be ignored, swept and reversed, or run through without reaction. Swing detection depends on the chosen settings, and prior-period references behave differently across symbols and session types. This tool organizes context and frames a decision; it does not guarantee how price will respond to any level.
🧠 Market Context Notes
Liquidity tends to rest where many participants place stops: above equal highs, below equal lows, and around prior-period extremes. Price often gravitates toward these areas, but the timing and the reaction are never certain. The structure and volatility around a pool shape how meaningful any reaction near it is likely to be, which is why the score blends proximity and trend context rather than distance alone.
🧾 Use Case Examples
• In an uptrend, the planner highlights a buy-side draw at a cluster of equal highs above price, with a recent swing low as the structural invalidation below and a score that reflects how aligned and how close that draw is.
• In a range, the planner shows two-sided liquidity, signaling that no single side is dominant and that patience is warranted until one side resolves.
• After a deep move, the prior-period high or low can become the dominant draw, giving a clear reference target while the invalidation marks where that lean would weaken.
🧱 System Philosophy
The AG Pro approach favors decision-support tools over raw indicators. Each script is built to answer a specific question, present a clean read, and respect the chart. Draw On Liquidity Planner reflects that philosophy by turning scattered liquidity into one structured draw decision with a transparent score and a defined invalidation.
🔐 Non-Promise Statement
This tool offers no guarantees and no certainty about future price movement. It is a structured way to read liquidity context and frame a plan, nothing more.
📉 Risk Disclosure
Trading involves substantial risk. This script is provided for educational and analytical purposes only and does not constitute financial advice. All trading decisions and their outcomes are solely the responsibility of the user.
📚 Educational Note
Use this planner to study how price interacts with resting liquidity over time. Watching which draws are respected, swept, or ignored on your own market and timeframe is a practical way to build liquidity-reading skill and a more structured trading process.
Note di rilascio
UPDATE NOTES - v1.1This update focuses on making the liquidity draw itself visible on the chart.
The core purpose of the script remains unchanged. The buy-side and sell-side
pool detection, the 0-100 draw scoring, the target pool, distance, pool type and
opposite-side invalidation all behave the same way. This release improves how
the dominant draw is presented. It continues to function as an analytical and
visualization tool and does not attempt to predict price direction or guarantee
outcomes.
------------------------
What Changed
------------------------
* The draw is now shown as a runway.
Instead of a thin highlight at the target, the script shades the path from the
current price to the dominant target pool. The direction of the draw (up toward
buy-side, down toward sell-side) and how far it reaches are readable at a glance.
* Dynamic draw distance.
Because the runway is anchored to current price, it visibly shrinks as price is
drawn toward the pool, giving an immediate sense of how much of the draw remains.
* Clearer destination and risk.
The target line marks the destination pool, the runway fills the path to it, and
the opposite-side invalidation line stays on the other side as the structural
reference.
------------------------
Visual Improvements
------------------------
* Improved first-glance interpretation by shading the draw path rather than only
marking the target level.
* Centered draw badge now sits within the runway, labeling the active draw and
its score in context.
* Kept the faint liquidity-pool map and alternating event labels for context
without adding clutter.
* The runway uses a high-transparency fill so it stays subtle and works on both
dark and light chart themes.
------------------------
Interface & Usability
------------------------
* The draw-zone setting is now labeled Show Draw Runway, with an updated tooltip.
* All core engine inputs, scoring, alerts and defaults are preserved.
------------------------
Behavior Notes
------------------------
This update does not change the core analytical logic. Pool detection, draw
scoring, target, distance, pool type, invalidation and alerts are unchanged. Only
the presentation of the dominant draw was refined. Users should interpret outputs
the same way as before, now with a clearer view of the draw.
------------------------
Limitations Reminder
------------------------
The script remains a rule-based analytical tool. Market conditions such as
volatility, liquidity, strong trends and timeframe differences may affect how
pools, draws and targets appear. Swing pools confirm after the swing strength
lookback, and prior-period pools depend on the chart timeframe. Outputs should
always be interpreted within broader market context.
------------------------
Risk Reminder
------------------------
This script is for educational and analytical purposes only. It does not
provide financial advice or guaranteed trading outcomes. Users remain
responsible for their own decisions.
Note di rilascio
Version 1.2.0 – Operational Draw MapThis release preserves the liquidity-pool detection and 0–100 draw-scoring engine while making the chart map operationally honest, fully owned, and easier to interpret at first glance.
• Restricted the runway, target, invalidation, and right-edge tags to qualified one-sided draws so balanced or low-score conditions no longer force a directional plan.
• Added an ATR-based reference-pool range and nearest-first sorting, removing distant orphan rails while retaining those pools inside the scoring memory.
• Added a filled invalidation badge beside the existing target badge so both active structural rails remain visually owned.
• Replaced the repeated “Watch Above | Above” action pattern with concise state-aware instructions for active, balanced, low-score, and no-pool conditions.
• Standardized event badges to compact score-aware text, increased their default candle offset, and prioritized draw changes over simultaneous sweep labels to prevent same-bar overlap.
• Extended both panel and chart label font controls through Huge while preserving Normal as the publication default.
Note di rilascio
Version 1.3.0 – Liquidity Runway Decision HierarchyThis update focuses on active-draw clarity, historical-event spacing, and panel decision hierarchy while preserving the liquidity-pool detector, mitigation lifecycle, dominant-side scoring, target and invalidation selection, and alert behavior.
• Added a full-width analytical question beneath the merged blue title row, giving the panel an immediate decision context without widening the chart footprint.
• Rebuilt the centered runway badge as a two-line decision card that combines draw side, active state, quality score, ATR distance, and target pool type.
• Moved the runway decision card deeper into the forward projection area so it remains centered inside the zone while competing less with current candles.
• Expanded the owned target tag to identify the buy-side or sell-side destination explicitly, strengthening the relationship between the runway and its price rail.
• Increased the default event-label cooldown from 20 to 52 bars and raised the default ATR offset, reducing historical sweep clusters and keeping labels away from candle bodies.
• Standardized event-marker wording with compact premium separators while preserving the original draw and sweep events.
• Converted the panel State and Action values into contrast-safe filled decision cells, improving first-glance recognition across dark and light panel themes.
• Preserved swing and prior-period pool detection, mitigation tracking, equal-level clustering, four-component side scores, dominant-draw qualification, target and invalidation references, and all three alert conditions.
Script open-source
Nello spirito di TradingView, l'autore di questo script lo ha reso open source, in modo che i trader possano esaminarne e verificarne la funzionalità. Complimenti all'autore! Sebbene sia possibile utilizzarlo gratuitamente, ricordiamo che la ripubblicazione del codice è soggetta al nostro Regolamento.

Trading Suite | Flagship Workflow :
tradingview.com/script/XJmX3p98-Trading-Suite-AGPro-Series/
Crypto Setup Planner | Multi-Symbol Analysis :
tradingview.com/script/LgVRo7Ql-Crypto-Setup-Planner-AGPro-Series/
tradingview.com/script/XJmX3p98-Trading-Suite-AGPro-Series/
Crypto Setup Planner | Multi-Symbol Analysis :
tradingview.com/script/LgVRo7Ql-Crypto-Setup-Planner-AGPro-Series/
Declinazione di responsabilità
Le informazioni e le pubblicazioni non sono intese come, e non costituiscono, consulenza o raccomandazioni finanziarie, di investimento, di trading o di altro tipo fornite o approvate da TradingView. Per ulteriori informazioni, consultare i Termini di utilizzo.
Script open-source
Nello spirito di TradingView, l'autore di questo script lo ha reso open source, in modo che i trader possano esaminarne e verificarne la funzionalità. Complimenti all'autore! Sebbene sia possibile utilizzarlo gratuitamente, ricordiamo che la ripubblicazione del codice è soggetta al nostro Regolamento.
Trading Suite | Flagship Workflow :
tradingview.com/script/XJmX3p98-Trading-Suite-AGPro-Series/
Crypto Setup Planner | Multi-Symbol Analysis :
tradingview.com/script/LgVRo7Ql-Crypto-Setup-Planner-AGPro-Series/
tradingview.com/script/XJmX3p98-Trading-Suite-AGPro-Series/
Crypto Setup Planner | Multi-Symbol Analysis :
tradingview.com/script/LgVRo7Ql-Crypto-Setup-Planner-AGPro-Series/
Declinazione di responsabilità
Le informazioni e le pubblicazioni non sono intese come, e non costituiscono, consulenza o raccomandazioni finanziarie, di investimento, di trading o di altro tipo fornite o approvate da TradingView. Per ulteriori informazioni, consultare i Termini di utilizzo.