OPEN-SOURCE SCRIPT
AetherEdge - Pattern Probability Scanner
🖊️ Overview
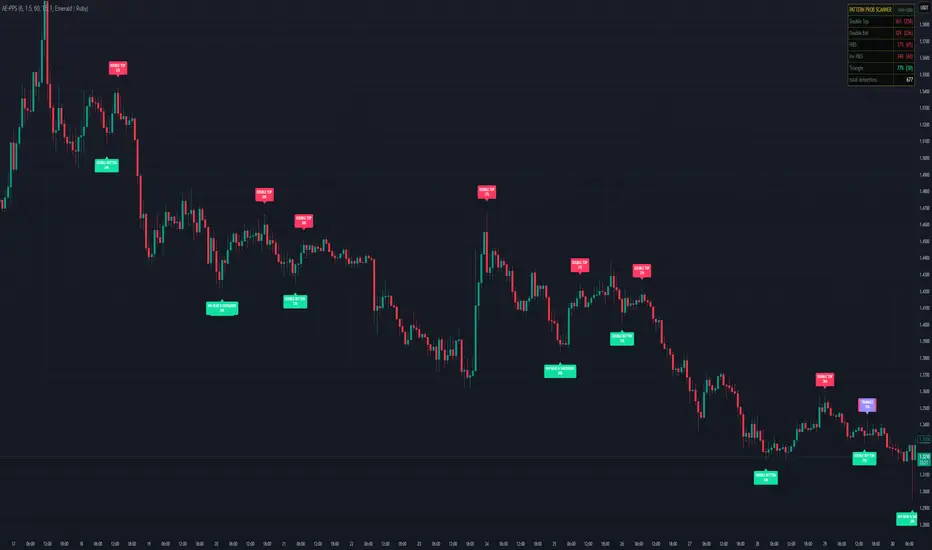
AE-PPS is a scanner that auto-detects classic chart patterns — Double Top, Double Bottom, Head & Shoulders, Inverse H&S, and Triangle — and labels each with its empirical win rate from past detections on this chart. At a glance you see "this shape historically played out as expected X% of the time," making pattern trading practical even for beginners.
🔶 Key Features
Auto-detects 5 patterns: Double Top, Double Bottom, H&S, Inverse H&S, Triangle
Pattern win-rate learning: computes empirical success rate per type and shows it on the label
Non-repainting detection: uses only confirmed swings — printed patterns never move
Pattern structure visualization: connecting lines drawn between key pivots
Per-pattern alerts
Integrated HUD listing every pattern's win rate and detection count
🧠 Technical Architecture
This tool uses rule-based geometric detection. Candidate points are harvested from confirmed swing highs/lows (ta.pivothigh/low), then matched against each pattern's geometric definition. Double Top requires "two near-equal swing highs (within the tolerance) and an intervening low"; H&S requires "three highs with the middle highest, the outer two within tolerance, and two intervening lows forming a neckline"; Triangle requires "the last three highs descending and the last three lows ascending," and so on. For win rates, each detection's context is buffered; after the outcome horizon, the result is judged by whether price moved as the pattern predicts (Double Top → fall, Triangle → breakout, etc.). The win rate is computed as wins / (wins + losses) × 100 per type and shown on each new label.
⚙️ Recommended Settings & Tuning Guide
Tuned with crypto in mind. Pivot Confirmation Bars near 6 is a starting point — larger captures only major patterns, smaller picks up finer ones. Equal-Level Tolerance (%) is how close two levels must be to count as "equal" — raise to 2.0–2.5% on highly volatile instruments to catch more. Max Pattern Span limits one pattern's bar count — 40–60 for short-term, 80–120 for swing. Outcome Horizon for win/loss judgment: 10–15 intraday, 20–30 for swing.
💡 How to Use in Practice
The most intuitive use is reading each detected pattern's labeled win rate. "DOUBLE TOP 70%" means double tops on this chart historically dropped 70% of the time. Patterns with win rates above 55% are highlighted as high-conviction (green); below 45% are highlighted as "doesn't typically play out" (red), supporting caution. Neckline breaks (H&S) and pattern-low breaks (Double Top) are classic entry points — use the HUD's win rates to decide whether to push the trade or stand aside. Combine with trend tools and support/resistance, and favor patterns where multiple pieces of evidence align.
⚠️ Important Notes
This tool is rule-based geometric detection, not full image-recognition AI pattern recognition. Detection accuracy depends on Pivot Confirmation Bars and tolerance settings; loose parameters can produce false positives. Win rates are computed from this chart's past detections — not from a global database. With few samples, "— (no data)" is shown, and win rates only become meaningful after enough detections accumulate (around 10 per pattern). A high win rate does not guarantee future results.
🚨 Disclaimer
This indicator is provided for educational and informational purposes only and does not constitute financial or investment advice. No pattern or win rate guarantees future profit, and past performance does not indicate future results. All trading decisions are made at your own risk.
AE-PPS is a scanner that auto-detects classic chart patterns — Double Top, Double Bottom, Head & Shoulders, Inverse H&S, and Triangle — and labels each with its empirical win rate from past detections on this chart. At a glance you see "this shape historically played out as expected X% of the time," making pattern trading practical even for beginners.
🔶 Key Features
Auto-detects 5 patterns: Double Top, Double Bottom, H&S, Inverse H&S, Triangle
Pattern win-rate learning: computes empirical success rate per type and shows it on the label
Non-repainting detection: uses only confirmed swings — printed patterns never move
Pattern structure visualization: connecting lines drawn between key pivots
Per-pattern alerts
Integrated HUD listing every pattern's win rate and detection count
🧠 Technical Architecture
This tool uses rule-based geometric detection. Candidate points are harvested from confirmed swing highs/lows (ta.pivothigh/low), then matched against each pattern's geometric definition. Double Top requires "two near-equal swing highs (within the tolerance) and an intervening low"; H&S requires "three highs with the middle highest, the outer two within tolerance, and two intervening lows forming a neckline"; Triangle requires "the last three highs descending and the last three lows ascending," and so on. For win rates, each detection's context is buffered; after the outcome horizon, the result is judged by whether price moved as the pattern predicts (Double Top → fall, Triangle → breakout, etc.). The win rate is computed as wins / (wins + losses) × 100 per type and shown on each new label.
⚙️ Recommended Settings & Tuning Guide
Tuned with crypto in mind. Pivot Confirmation Bars near 6 is a starting point — larger captures only major patterns, smaller picks up finer ones. Equal-Level Tolerance (%) is how close two levels must be to count as "equal" — raise to 2.0–2.5% on highly volatile instruments to catch more. Max Pattern Span limits one pattern's bar count — 40–60 for short-term, 80–120 for swing. Outcome Horizon for win/loss judgment: 10–15 intraday, 20–30 for swing.
💡 How to Use in Practice
The most intuitive use is reading each detected pattern's labeled win rate. "DOUBLE TOP 70%" means double tops on this chart historically dropped 70% of the time. Patterns with win rates above 55% are highlighted as high-conviction (green); below 45% are highlighted as "doesn't typically play out" (red), supporting caution. Neckline breaks (H&S) and pattern-low breaks (Double Top) are classic entry points — use the HUD's win rates to decide whether to push the trade or stand aside. Combine with trend tools and support/resistance, and favor patterns where multiple pieces of evidence align.
⚠️ Important Notes
This tool is rule-based geometric detection, not full image-recognition AI pattern recognition. Detection accuracy depends on Pivot Confirmation Bars and tolerance settings; loose parameters can produce false positives. Win rates are computed from this chart's past detections — not from a global database. With few samples, "— (no data)" is shown, and win rates only become meaningful after enough detections accumulate (around 10 per pattern). A high win rate does not guarantee future results.
🚨 Disclaimer
This indicator is provided for educational and informational purposes only and does not constitute financial or investment advice. No pattern or win rate guarantees future profit, and past performance does not indicate future results. All trading decisions are made at your own risk.
Script open-source
Nello spirito di TradingView, l'autore di questo script lo ha reso open source, in modo che i trader possano esaminarne e verificarne la funzionalità. Complimenti all'autore! Sebbene sia possibile utilizzarlo gratuitamente, ricordiamo che la ripubblicazione del codice è soggetta al nostro Regolamento.

Declinazione di responsabilità
Le informazioni e le pubblicazioni non sono intese come, e non costituiscono, consulenza o raccomandazioni finanziarie, di investimento, di trading o di altro tipo fornite o approvate da TradingView. Per ulteriori informazioni, consultare i Termini di utilizzo.
Script open-source
Nello spirito di TradingView, l'autore di questo script lo ha reso open source, in modo che i trader possano esaminarne e verificarne la funzionalità. Complimenti all'autore! Sebbene sia possibile utilizzarlo gratuitamente, ricordiamo che la ripubblicazione del codice è soggetta al nostro Regolamento.
Declinazione di responsabilità
Le informazioni e le pubblicazioni non sono intese come, e non costituiscono, consulenza o raccomandazioni finanziarie, di investimento, di trading o di altro tipo fornite o approvate da TradingView. Per ulteriori informazioni, consultare i Termini di utilizzo.