Wiko S/D Zones
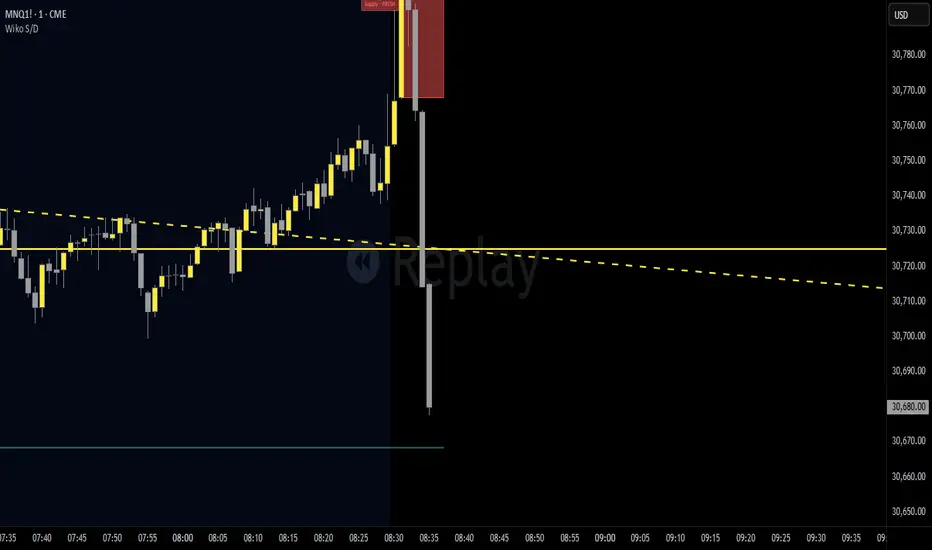
This indicator automatically identifies and plots key Supply and Demand zones directly on your chart, giving you a clear visual edge for finding high-probability trade setups.
Supply zones represent areas where price has previously shown strong selling pressure, while Demand zones mark areas where buyers have stepped in aggressively. These zones act as magnets — price tends to revisit and react to them, making them ideal areas to look for entries, exits, and reversals.
What it does:
Automatically draws Supply zones (resistance areas) and Demand zones (support areas)
Updates in real time as new zones are formed
Clearly color codes zones for quick visual reading — red for Supply, green for Demand
Marks tested zones so you always know which levels have been revisited
How to use it:
Look for price to pull back into a zone and react — that's your entry signal
Use in confluence with your existing bias, structure, and confirmation tools
Works on all timeframes and all instruments
Best used on: Futures, Forex, Crypto, Stocks
Recommended timeframes: 1M, 3M, 5M, 15M, 1H and above
Supply zones represent areas where price has previously shown strong selling pressure, while Demand zones mark areas where buyers have stepped in aggressively. These zones act as magnets — price tends to revisit and react to them, making them ideal areas to look for entries, exits, and reversals.
What it does:
Automatically draws Supply zones (resistance areas) and Demand zones (support areas)
Updates in real time as new zones are formed
Clearly color codes zones for quick visual reading — red for Supply, green for Demand
Marks tested zones so you always know which levels have been revisited
How to use it:
Look for price to pull back into a zone and react — that's your entry signal
Use in confluence with your existing bias, structure, and confirmation tools
Works on all timeframes and all instruments
Best used on: Futures, Forex, Crypto, Stocks
Recommended timeframes: 1M, 3M, 5M, 15M, 1H and above

Declinazione di responsabilità
Le informazioni e le pubblicazioni non sono intese come, e non costituiscono, consulenza o raccomandazioni finanziarie, di investimento, di trading o di altro tipo fornite o approvate da TradingView. Per ulteriori informazioni, consultare i Termini di utilizzo.
Declinazione di responsabilità
Le informazioni e le pubblicazioni non sono intese come, e non costituiscono, consulenza o raccomandazioni finanziarie, di investimento, di trading o di altro tipo fornite o approvate da TradingView. Per ulteriori informazioni, consultare i Termini di utilizzo.