OPEN-SOURCE SCRIPT
MTF Pure Delta Light [Zofesu]
01 — Overview
What is MTF Pure Delta Light?
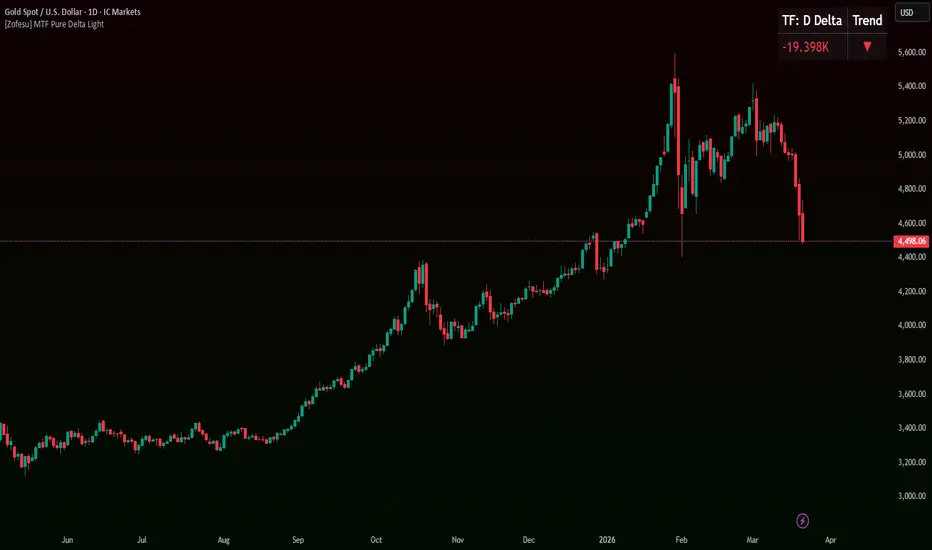
MTF Pure Delta Light [Zofesu] is a minimalist overlay indicator that displays the volume delta of any chosen timeframe directly on your chart — as a compact, always-visible table widget. No separate pane, no clutter. Just the number and the trend direction.
Delta is the difference between buying and selling volume pressure for a bar. A positive delta means buyers dominated. A negative delta means sellers dominated. Combined with the HMA trend direction, you get an instant read on who is in control — on any timeframe — without leaving your chart.
BULLISH EXAMPLE
TF: D Delta Trend
+24.7K ▲
BEARISH EXAMPLE
TF: D Delta Trend
-19.4K ▼
Why "Light"?
This is the lightweight companion to the full Flow Oscillator. No separate pane, no cumulative history — just the current bar's delta value and trend direction from your chosen timeframe, always visible on the chart. Designed for traders who want context without complexity.
02 — Delta Calculation
How Delta Is Measured
The indicator uses the same dual-source delta standard as the full Flow Oscillator:
The delta is then smoothed using an HMA (Hull Moving Average) to determine trend direction. HMA is used specifically because it minimises lag — the trend signal responds quickly to delta shifts without excessive whipsawing.
03 — Table Widget
Reading the Display
The table widget shows two values at all times:
04 — Settings
Configuration Parameters
Group - Parameter - Default - Description
Timeframe examples:
60 = 1 hour · 240 = 4 hours · D = Daily · W = Weekly
Recommended setup: If you trade H1 charts, set Target Timeframe to D. You get the daily delta context without switching charts.
05 — Use Cases
When and How to Use It
Higher timeframe context on intraday charts
Set Target Timeframe to D while trading on H1 or H4. The widget shows you whether the daily bar is currently dominated by buyers or sellers — without leaving your intraday view. Align your intraday trades with the daily delta direction for higher probability setups.
Quick confluence check
Before entering a trade, check the widget. If your price action setup is bullish but the delta is strongly negative with a ▼ trend — reconsider. If everything aligns — price structure, S/R, and positive delta ▲ — confidence increases.
Multi-indicator stack
MTF Pure Delta Light is designed to run alongside other indicators without occupying a separate pane. Pair it with Best MA [Zofesu] for trend context and Flow Oscillator [Zofesu] for cumulative delta history — all three together give a complete volume-delta picture.
Important: Delta is a confirmation tool, not a prediction tool. A positive delta tells you buyers dominated the last completed bar on your chosen timeframe — it does not guarantee the next bar will be bullish. Always use price structure and S/R as your primary decision framework.
What is MTF Pure Delta Light?
MTF Pure Delta Light [Zofesu] is a minimalist overlay indicator that displays the volume delta of any chosen timeframe directly on your chart — as a compact, always-visible table widget. No separate pane, no clutter. Just the number and the trend direction.
Delta is the difference between buying and selling volume pressure for a bar. A positive delta means buyers dominated. A negative delta means sellers dominated. Combined with the HMA trend direction, you get an instant read on who is in control — on any timeframe — without leaving your chart.
BULLISH EXAMPLE
TF: D Delta Trend
+24.7K ▲
BEARISH EXAMPLE
TF: D Delta Trend
-19.4K ▼
Why "Light"?
This is the lightweight companion to the full Flow Oscillator. No separate pane, no cumulative history — just the current bar's delta value and trend direction from your chosen timeframe, always visible on the chart. Designed for traders who want context without complexity.
02 — Delta Calculation
How Delta Is Measured
The indicator uses the same dual-source delta standard as the full Flow Oscillator:
- Footprint - Real bid/ask volume delta via fp.delta(). Used when your broker or data feed provides footprint data. Exact buying vs. selling volume per bar. High ✅
- Elder CTI - Approximation using volume × (2×close − high − low) / range. Automatic fallback when footprint is unavailable. Works on all instruments and brokers. Good ⚡
The delta is then smoothed using an HMA (Hull Moving Average) to determine trend direction. HMA is used specifically because it minimises lag — the trend signal responds quickly to delta shifts without excessive whipsawing.
03 — Table Widget
Reading the Display
The table widget shows two values at all times:
- Delta Value (left)
The raw delta of the selected timeframe bar. Green = positive (buyers dominated). Red = negative (sellers dominated). Formatted as volume shorthand (K, M). - Trend Arrow (right)
▲ Green — HMA delta trend rising. Buying pressure increasing.
▼ Red — HMA delta trend falling. Selling pressure increasing.
▬ Gray — No change. Neutral. - ✅ Strong Bullish
Delta positive AND trend arrow ▲. Buyers in control and accelerating. Highest confidence bullish read. - ⚠️ Divergence Warning
- Delta positive BUT trend arrow ▼ — buying is slowing.
- Delta negative BUT trend arrow ▲ — selling is slowing.
Potential shift incoming. - ✅ Strong Bearish
Delta negative AND trend arrow ▼. Sellers in control and accelerating. Highest confidence bearish read. - ➡️ Neutral
Delta near zero or trend arrow ▬. No dominant force. Avoid directional bias until one side takes control.
04 — Settings
Configuration Parameters
Group - Parameter - Default - Description
- Core - Target Timeframe - D - Timeframe for delta calculation. Use standard TV notation: 1, 5, 15, 60, 240, D, W. Leave D for daily delta on any intraday chart.
- Core - Trend Smoothing (HMA) - 5 - HMA length for delta trend direction. Lower = faster reaction, more signals. Higher = smoother, fewer but stronger signals.
- UI - Table Position - Top Right - Position of the widget on the chart. Options: Top Right, Top Left, Bottom Right, Bottom Left, Middle Right, Middle Left.
- UI - Text Size - Large - Widget text size. Small for compact charts, Large for readability at a glance.
- UI - Background Opacity - 80 - Transparency of the widget background. 0 = fully transparent, 100 = fully opaque black.
Timeframe examples:
60 = 1 hour · 240 = 4 hours · D = Daily · W = Weekly
Recommended setup: If you trade H1 charts, set Target Timeframe to D. You get the daily delta context without switching charts.
05 — Use Cases
When and How to Use It
Higher timeframe context on intraday charts
Set Target Timeframe to D while trading on H1 or H4. The widget shows you whether the daily bar is currently dominated by buyers or sellers — without leaving your intraday view. Align your intraday trades with the daily delta direction for higher probability setups.
Quick confluence check
Before entering a trade, check the widget. If your price action setup is bullish but the delta is strongly negative with a ▼ trend — reconsider. If everything aligns — price structure, S/R, and positive delta ▲ — confidence increases.
Multi-indicator stack
MTF Pure Delta Light is designed to run alongside other indicators without occupying a separate pane. Pair it with Best MA [Zofesu] for trend context and Flow Oscillator [Zofesu] for cumulative delta history — all three together give a complete volume-delta picture.
Important: Delta is a confirmation tool, not a prediction tool. A positive delta tells you buyers dominated the last completed bar on your chosen timeframe — it does not guarantee the next bar will be bullish. Always use price structure and S/R as your primary decision framework.
Script open-source
Nello spirito di TradingView, l'autore di questo script lo ha reso open source, in modo che i trader possano esaminarne e verificarne la funzionalità. Complimenti all'autore! Sebbene sia possibile utilizzarlo gratuitamente, ricordiamo che la ripubblicazione del codice è soggetta al nostro Regolamento.

Think Act Believe. Use SL. Use BreakEven. Respect the market. Your ego and arrogance can destroy your trading account. Never leave the table unless you have a closed trade or SL/BE. Indicator does not guarantee profit.
discord.gg/FcSJpSvNnv
discord.gg/FcSJpSvNnv
Declinazione di responsabilità
Le informazioni e le pubblicazioni non sono intese come, e non costituiscono, consulenza o raccomandazioni finanziarie, di investimento, di trading o di altro tipo fornite o approvate da TradingView. Per ulteriori informazioni, consultare i Termini di utilizzo.
Script open-source
Nello spirito di TradingView, l'autore di questo script lo ha reso open source, in modo che i trader possano esaminarne e verificarne la funzionalità. Complimenti all'autore! Sebbene sia possibile utilizzarlo gratuitamente, ricordiamo che la ripubblicazione del codice è soggetta al nostro Regolamento.
Think Act Believe. Use SL. Use BreakEven. Respect the market. Your ego and arrogance can destroy your trading account. Never leave the table unless you have a closed trade or SL/BE. Indicator does not guarantee profit.
discord.gg/FcSJpSvNnv
discord.gg/FcSJpSvNnv
Declinazione di responsabilità
Le informazioni e le pubblicazioni non sono intese come, e non costituiscono, consulenza o raccomandazioni finanziarie, di investimento, di trading o di altro tipo fornite o approvate da TradingView. Per ulteriori informazioni, consultare i Termini di utilizzo.