Aggiornato
Public_Library_Divergences
More exclusive indicators from SimpleCryptoLife
Subscribe to Beyond Market Structure Pro Suite for $18.00/month to get exclusive indicators by this author. You pay right on TradingView and can use them on your charts straight away.
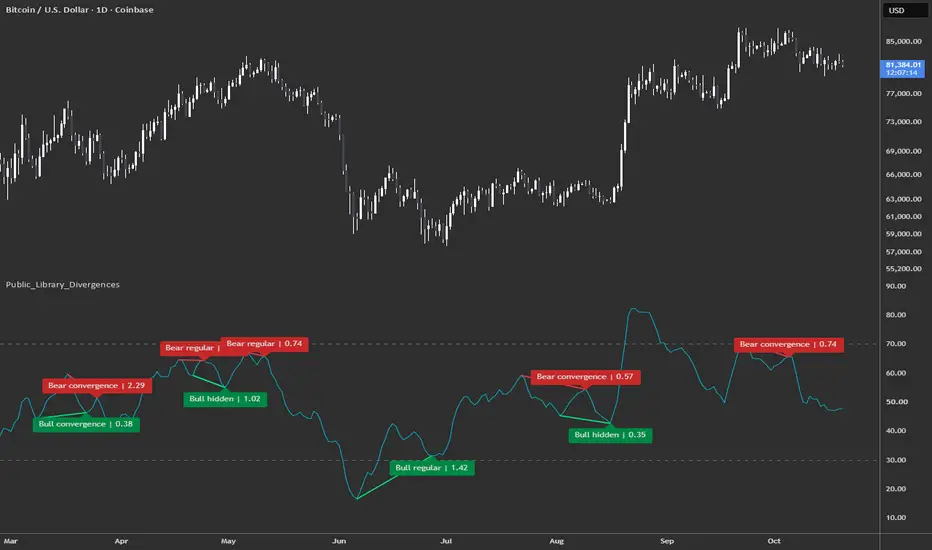
Explore Beyond Market Structure Pro SuiteThis library finds regular and hidden divergences, and directional convergences, between price and a momentum series.
It's based on my own Momentum Resets library, because I think defining pivots in momentum by how far the metric has moved is superior to and often faster than a simple "highest value in x bars" approach. This imported library gives us different left and right shoulder settings for free. The resets library also allows us to use absolute distances or a percentage of the recent momentum range to define shoulders. And in this library, first and second pivots have separate qualification settings, so you can fully customise what kind of turns in momentum count for you.
We sample price around each qualified turn instead of assuming that the price extreme happened on the momentum pivot's candle — 'cos it often doesn't, depending on what the momentum metric is.
When you look at the chart it seems "obvious" which pivots you choose to compare. But actually it's quite a technical problem as well as a judgement call. We use rolling pairs so that the same pivot can have more than one role — it can be the second pivot in one pair and the first pivot in another pair at the same time.
This combination of movement-based momentum pivots, independently configurable first and second pivot criteria, rolling pairs, and price sampling over each pivot’s own shoulder interval is I beleive both the closest to the way that the trader's eye sees divergences and also, according to a lot of searches, unique among Pine scripts.
One way that I think the classical divergences are arbitrary is the division into Strong, Medium and Weak, also known as Class A, B, and C respectively. A price difference of a single pip can tip a divergence from Strong to Medium for example. In the continuous pursuit of non-arbitrariness, what I call Market Coherence Primitives, I've implemented a continuous strength score for all the types of divergences and convergences here. It measures both the size and speed of price and momentum movements against smoothed percentile reference ranges.
The library works with bounded and unbounded momentum series. It returns the pattern, both endpoints, and a continuous strength score for your own indicator or strategy.
🟩 PIVOTS AND PAIRING
A left shoulder is the momentum movement needed to start tracking a possible pivot. A right shoulder is the movement back from its extreme that's needed to confirm it. These are distances, and we don't use candle counts. In Percent Of Range mode, 5 means 5% of the smoothed momentum reference range.
Highs and lows are paired separately. After A pairs with B, B can start the next pair only if it independently qualifies as a first pivot. The two roles can confirm at different times.
We combine pivots into pairs only if they happen within the window. The pairing window measures the distance between the actual momentum pivot bars, including its final bar. Confirmation can happen later. If you pass a value of zero for the window length, "auto" selects the next strictly greater Fibonacci number above the momentum period: 14 gives 21; 21 gives 34, and so on.
🟩 PATTERNS
We detect the classical patterns, plus Convergences, which are a specific subset of the standard "momentum confirms price" patterns.
Regular divergence — Traditional strong (Class A)
Regular divergences are usually taken as a sign that the current trend is losing momentum. They signifiy either a reversal or a pause.
Bullish: Price makes a lower low; momentum makes a higher low.
Bearish: Price makes a higher high; momentum makes a lower high.

Regular divergence — Traditional medium (Class B)
Bullish: Price makes equal lows; momentum makes a higher low.
Bearish: Price makes equal highs; momentum makes a lower high.

Regular divergence — Traditional weak (Class C)
Bullish: Price makes a lower low; momentum makes equal lows.
Bearish: Price makes a higher high; momentum makes equal highs.

Hidden divergence
Hidden divergences are usually interpreted as trend continuation after a pullback.
Bullish: Price makes a higher low; momentum makes a lower low.
Bearish: Price makes a lower high; momentum makes a higher high.

Convergence
Convergences normally signal trend continuation when aligned with the general trend or market structure.
Bullish: Price and momentum both make higher lows.
Bearish: Price and momentum both make lower highs.

🟩 STRENGTH
We measure the strength of a divergence based on the difference between the endpoints in terms of their momentum and their price. Other things being equal, a bigger difference means a stronger divergence, and a quicker divergence scores higher. The same continuous strength calculation applies to regular divergences, hidden divergences and convergences.
The default weighting is 70% momentum and 30% price. A small fast movement can score the same as a large slow one. We normalise the metrics against a reference range, just so that the strnegth scores can be comparable across assets. Otherwise we do minimal processing, in order to get closer to what the strength "really" is. Even so, the score is unbounded. It's measured in percent of reference range per bar, rather than as a percentage of some theoretical maximum strength. If there's not enough information, for example early in the chart, the strength is `na` but the class and direction and all the other information about the divergence is still returned.
🟩 USING THE LIBRARY
Pass your momentum series, current bar data in an `o_barData` object, and momentum period to `getDivergences()`. The function returns an array of classified patterns; an empty array means no new results. Each result contains its kind, first and second endpoints, and strength. Endpoints have separate price and momentum values and bar indexes, so use the corresponding coordinates for each drawing. Call the function on every bar.
🟩 ABOUT THE EXAMPLE
The function defaults to Percent Of Range shoulders. The example defaults to Absolute, using RSI(14) of close smoothed by SMA(3). The library doesn't calculate or smooth the momentum you pass in. Example labels show strength to two decimals; tooltips identify when each result became available. The 30/70 lines are visual guides only.
🟩 TIMING
A pattern becomes available when its required qualifications are known. Drawings placed on earlier pivot candles do not imply that it was known then. Open-candle results can change or disappear under normal Pine rollback.
Percentage shoulders need a positive reference range to start tracking. Absolute shoulders can detect patterns before scoring is ready. A missing shoulder start or incomplete price history prevents classification. The shoulder-start search is limited to 200 bars before confirmation.
🟩 PRICE SAMPLING
Each pivot role selects its price extreme from its left-shoulder start through its confirmation candle, inclusive. Choose Body Edge (open/close), Close or Wick (high/low). Close therefore means the extreme close across that interval, not necessarily the close on the momentum pivot candle. Ties keep the earliest candle.
Price is frozen at that role's confirmation. A pivot used as both second and first can have different price endpoints because its shoulder intervals can differ. The second price endpoint must be later than the first; same-candle or reversed endpoints are rejected. Price classification never changes the momentum pairing sequence.
It's based on my own Momentum Resets library, because I think defining pivots in momentum by how far the metric has moved is superior to and often faster than a simple "highest value in x bars" approach. This imported library gives us different left and right shoulder settings for free. The resets library also allows us to use absolute distances or a percentage of the recent momentum range to define shoulders. And in this library, first and second pivots have separate qualification settings, so you can fully customise what kind of turns in momentum count for you.
We sample price around each qualified turn instead of assuming that the price extreme happened on the momentum pivot's candle — 'cos it often doesn't, depending on what the momentum metric is.
When you look at the chart it seems "obvious" which pivots you choose to compare. But actually it's quite a technical problem as well as a judgement call. We use rolling pairs so that the same pivot can have more than one role — it can be the second pivot in one pair and the first pivot in another pair at the same time.
This combination of movement-based momentum pivots, independently configurable first and second pivot criteria, rolling pairs, and price sampling over each pivot’s own shoulder interval is I beleive both the closest to the way that the trader's eye sees divergences and also, according to a lot of searches, unique among Pine scripts.
One way that I think the classical divergences are arbitrary is the division into Strong, Medium and Weak, also known as Class A, B, and C respectively. A price difference of a single pip can tip a divergence from Strong to Medium for example. In the continuous pursuit of non-arbitrariness, what I call Market Coherence Primitives, I've implemented a continuous strength score for all the types of divergences and convergences here. It measures both the size and speed of price and momentum movements against smoothed percentile reference ranges.
The library works with bounded and unbounded momentum series. It returns the pattern, both endpoints, and a continuous strength score for your own indicator or strategy.
🟩 PIVOTS AND PAIRING
A left shoulder is the momentum movement needed to start tracking a possible pivot. A right shoulder is the movement back from its extreme that's needed to confirm it. These are distances, and we don't use candle counts. In Percent Of Range mode, 5 means 5% of the smoothed momentum reference range.
Highs and lows are paired separately. After A pairs with B, B can start the next pair only if it independently qualifies as a first pivot. The two roles can confirm at different times.
We combine pivots into pairs only if they happen within the window. The pairing window measures the distance between the actual momentum pivot bars, including its final bar. Confirmation can happen later. If you pass a value of zero for the window length, "auto" selects the next strictly greater Fibonacci number above the momentum period: 14 gives 21; 21 gives 34, and so on.
🟩 PATTERNS
We detect the classical patterns, plus Convergences, which are a specific subset of the standard "momentum confirms price" patterns.
Regular divergence — Traditional strong (Class A)
Regular divergences are usually taken as a sign that the current trend is losing momentum. They signifiy either a reversal or a pause.
Bullish: Price makes a lower low; momentum makes a higher low.
Bearish: Price makes a higher high; momentum makes a lower high.
Regular divergence — Traditional medium (Class B)
Bullish: Price makes equal lows; momentum makes a higher low.
Bearish: Price makes equal highs; momentum makes a lower high.
Regular divergence — Traditional weak (Class C)
Bullish: Price makes a lower low; momentum makes equal lows.
Bearish: Price makes a higher high; momentum makes equal highs.
Hidden divergence
Hidden divergences are usually interpreted as trend continuation after a pullback.
Bullish: Price makes a higher low; momentum makes a lower low.
Bearish: Price makes a lower high; momentum makes a higher high.
Convergence
Convergences normally signal trend continuation when aligned with the general trend or market structure.
Bullish: Price and momentum both make higher lows.
Bearish: Price and momentum both make lower highs.
🟩 STRENGTH
We measure the strength of a divergence based on the difference between the endpoints in terms of their momentum and their price. Other things being equal, a bigger difference means a stronger divergence, and a quicker divergence scores higher. The same continuous strength calculation applies to regular divergences, hidden divergences and convergences.
The default weighting is 70% momentum and 30% price. A small fast movement can score the same as a large slow one. We normalise the metrics against a reference range, just so that the strnegth scores can be comparable across assets. Otherwise we do minimal processing, in order to get closer to what the strength "really" is. Even so, the score is unbounded. It's measured in percent of reference range per bar, rather than as a percentage of some theoretical maximum strength. If there's not enough information, for example early in the chart, the strength is `na` but the class and direction and all the other information about the divergence is still returned.
🟩 USING THE LIBRARY
Pass your momentum series, current bar data in an `o_barData` object, and momentum period to `getDivergences()`. The function returns an array of classified patterns; an empty array means no new results. Each result contains its kind, first and second endpoints, and strength. Endpoints have separate price and momentum values and bar indexes, so use the corresponding coordinates for each drawing. Call the function on every bar.
🟩 ABOUT THE EXAMPLE
The function defaults to Percent Of Range shoulders. The example defaults to Absolute, using RSI(14) of close smoothed by SMA(3). The library doesn't calculate or smooth the momentum you pass in. Example labels show strength to two decimals; tooltips identify when each result became available. The 30/70 lines are visual guides only.
🟩 TIMING
A pattern becomes available when its required qualifications are known. Drawings placed on earlier pivot candles do not imply that it was known then. Open-candle results can change or disappear under normal Pine rollback.
Percentage shoulders need a positive reference range to start tracking. Absolute shoulders can detect patterns before scoring is ready. A missing shoulder start or incomplete price history prevents classification. The shoulder-start search is limited to 200 bars before confirmation.
🟩 PRICE SAMPLING
Each pivot role selects its price extreme from its left-shoulder start through its confirmation candle, inclusive. Choose Body Edge (open/close), Close or Wick (high/low). Close therefore means the extreme close across that interval, not necessarily the close on the momentum pivot candle. Ties keep the earliest candle.
Price is frozen at that role's confirmation. A pivot used as both second and first can have different price endpoints because its shoulder intervals can differ. The second price endpoint must be later than the first; same-candle or reversed endpoints are rejected. Price classification never changes the momentum pairing sequence.
Note di rilascio
v2Fixed a subtle sequencing bug. Real men test in Production ;-)
Note di rilascio
v3First Pivot confirmation time
Added a new setting. In the example it's called First Pivot Minimum confirmation Bars and the function parameter is `_firstMinimumBars`.
It's so that you can prevent two pivots that come in very quick succession from counting as separate pivots. It does this by making the library wait for that many bars before confirming the first pivot.
Imagine you want to create a divergence pattern that requires large entries and exits but only a small movement between the pivots. This could erroneously match a single jagged pivot. Now with this extra time-based constraint you can prevent that.
Yeah, this library isn't a toy. It's not especially easy to use. It's a pro tool; very accurate and configurable.
The default is 3, to filter out momentum turns separated by a single bar. The First pivot must meet both the minimum age and its right shoulder; bounces do not erase completed shoulder movement. A new extreme restarts qualification.
Set to `1` to allow next-bar confirmation with no extra waiting. Valid range: 1–199, no greater than the effective pairing window. Invalid settings stop the script with a runtime error because you did not get the shape you ordered.

🔥 Beyond Market Structure Paid Space is now live! is.gd/beyondMS
🆓 All my free scripts: is.gd/simplefree
🆓 All my free scripts: is.gd/simplefree
Declinazione di responsabilità
Le informazioni e le pubblicazioni non sono intese come, e non costituiscono, consulenza o raccomandazioni finanziarie, di investimento, di trading o di altro tipo fornite o approvate da TradingView. Per ulteriori informazioni, consultare i Termini di utilizzo.
🔥 Beyond Market Structure Paid Space is now live! is.gd/beyondMS
🆓 All my free scripts: is.gd/simplefree
🆓 All my free scripts: is.gd/simplefree
Declinazione di responsabilità
Le informazioni e le pubblicazioni non sono intese come, e non costituiscono, consulenza o raccomandazioni finanziarie, di investimento, di trading o di altro tipo fornite o approvate da TradingView. Per ulteriori informazioni, consultare i Termini di utilizzo.