Aggiornato
Volume Footprint Levels
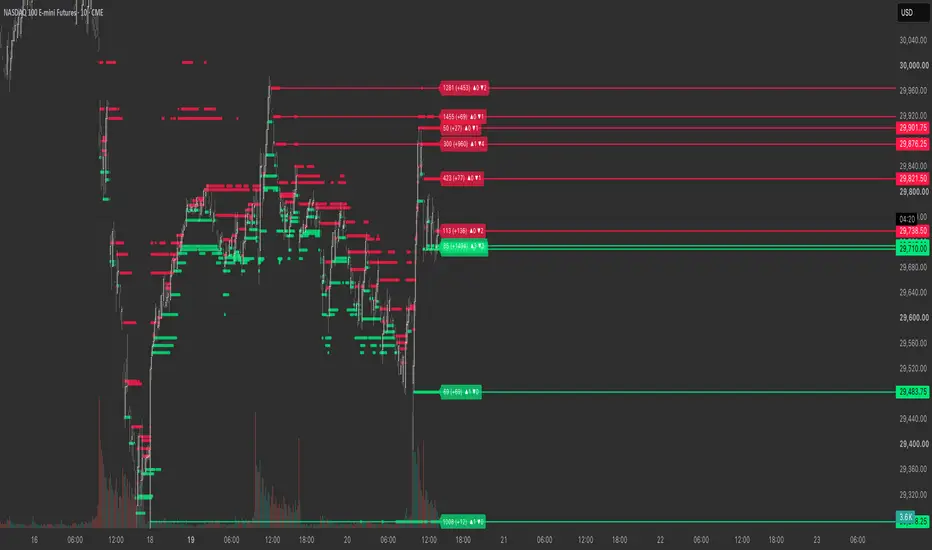
Volume Footprint Levels 🐾
What it is
A support/resistance plotter that uses TradingView's request.footprint() volume-at-price data to identify levels where aggressive volume actively defended or rejected price. Instead of drawing lines from raw highs/lows, it only marks zones where one side (buyers or sellers) absorbed the other and price was pushed away — the kind of levels that tend to matter on retest.
How defense is detected
For each bar, the script walks the footprint rows and looks for one-sided imbalance concentrated at the bar's wick zones:
Qualifying rows are aggregated into a volume-weighted average price for the level, and the level only fires if the total defending volume clears a minimum threshold. Individual rows must also clear a minimum delta to count, which filters out thin-tape noise.
Level lifecycle
Each detected level becomes a horizontal line projecting forward from the bar that created it:
Exports
The four nearest supports and four nearest resistances (sorted by proximity to close) are plotted to the price scale and data window as Sup 1–4 / Res 1–4. When Enable JSON Alerts is on, each confirmed bar emits a structured JSON alert containing timestamp, ticker, timeframe, close, all eight ranked levels, active level count, and any new support/resistance created on that bar — designed for ingestion by an external webhook pipeline.
What you see on the chart
Green lines for support, red for resistance, each tagged with a label showing defending volume and the running ▲/▼ touch counts. Hovering a label exposes a tooltip with the level type, exact price, volume, imbalance ratio at creation, and full touch breakdown. Line style, width, colors, and label size are all configurable.
Intended use
A footprint-driven structure tool — the levels flag prices where aggressive flow has already been absorbed once, making them candidates for retest entries, target zones, or invalidation references. Best on instruments where TradingView's footprint data is dense (liquid futures, major FX, large-cap equities); on thinner instruments or deep history the footprint resolution degrades, which is why maxLookback is capped.
What it is
A support/resistance plotter that uses TradingView's request.footprint() volume-at-price data to identify levels where aggressive volume actively defended or rejected price. Instead of drawing lines from raw highs/lows, it only marks zones where one side (buyers or sellers) absorbed the other and price was pushed away — the kind of levels that tend to matter on retest.
How defense is detected
For each bar, the script walks the footprint rows and looks for one-sided imbalance concentrated at the bar's wick zones:
- Buy defense (support) — heavy aggressive buying at the bottom X% of the bar's range, where buy volume exceeds sell volume by the imbalance ratio, and the close has moved a configurable distance away from the lows.
- Sell defense (resistance) — heavy aggressive selling at the top X% of the bar's range, where sell volume exceeds buy volume by the ratio, and the close has moved away from the highs.
Qualifying rows are aggregated into a volume-weighted average price for the level, and the level only fires if the total defending volume clears a minimum threshold. Individual rows must also clear a minimum delta to count, which filters out thin-tape noise.
Level lifecycle
Each detected level becomes a horizontal line projecting forward from the bar that created it:
- Merge / replace — a new level within mergePoints of an existing one is suppressed, unless the new one has higher defending volume, in which case it replaces the weaker one in place.
- Touch tracking — every bar whose wick reaches within touchTol of the level increments either the bullish (▲) or bearish (▼) touch counter depending on which side of the level the bar closed on. Counts render in the level's label.
- Break confirmation — a level is only removed once price closes beyond it (plus a buffer) for breakBars consecutive bars. If price moves back inside before the count completes, the break counter resets. This stops single-wick fakeouts from killing valid levels.
- Cap — total active levels are pruned oldest-first to stay under maxLevels.
Exports
The four nearest supports and four nearest resistances (sorted by proximity to close) are plotted to the price scale and data window as Sup 1–4 / Res 1–4. When Enable JSON Alerts is on, each confirmed bar emits a structured JSON alert containing timestamp, ticker, timeframe, close, all eight ranked levels, active level count, and any new support/resistance created on that bar — designed for ingestion by an external webhook pipeline.
What you see on the chart
Green lines for support, red for resistance, each tagged with a label showing defending volume and the running ▲/▼ touch counts. Hovering a label exposes a tooltip with the level type, exact price, volume, imbalance ratio at creation, and full touch breakdown. Line style, width, colors, and label size are all configurable.
Intended use
A footprint-driven structure tool — the levels flag prices where aggressive flow has already been absorbed once, making them candidates for retest entries, target zones, or invalidation references. Best on instruments where TradingView's footprint data is dense (liquid futures, major FX, large-cap equities); on thinner instruments or deep history the footprint resolution degrades, which is why maxLookback is capped.
Note di rilascio
New Feature to preserve the plots. The plots only go as far back as the volume data Tradingview provides. The plots help to identify previous levels once the levels have moved on. Note di rilascio
Changed the volume label so it no longer stays frozen at the level's creation strength: each time price retests a level, we now add the footprint volume actually transacted at that price row into a new retestVols accumulator and display it as defenseVol (+retestVol), with the tooltip broken out into Defense / Retest Vol / Total Vol. We added an "Accumulate Touch Volume" toggle, a f_volAtPrice() helper to read the at-level volume, wired the new array through every lifecycle path (create, merge-replace, prune, break-removal), and un-gated the label-update loop so volume updates even when touch counts are hidden.Note di rilascio
- Fixed the "CPU time exceeded" resource error on higher timeframes with a new Compute option: "Compute on bar close only (live bars)". On by default, the footprint request and all level logic run once per bar on its closing tick, exactly like history. Turn it off for the original every-tick (live) calculation.
- Alert JSON option ("Enable JSON Alerts") sends a JSON payload on every bar close with the active footprint levels: the four nearest supports and resistances with their defense volume, accumulated retest volume and bull/bear touch counts, plus any level created on that bar.
- Level prices are rounded to the tick (math.round_to_mintick), so lines, labels, plots and the alert payload all show a tradeable price.
- Levels extend to the right natively instead of being redrawn every bar.
- Faster level ranking: the nearest-level export sorts only the four ranks it needs and keeps each level's volume and touch data attached to its price.
- Faster touch volume lookup: the footprint row at a level is found by index arithmetic rather than scanning every row, which is what made 15m and above expensive.
- Labels are positioned once on the last bar and their text is rebuilt only when a level is touched or created.
- Lighter footprint requests: data is fetched only inside the lookback window (now 50–1000 bars, default 300), the script computes at most the most recent 1,500 bars, and line/label limits were trimmed to 100 each.

Declinazione di responsabilità
Le informazioni e le pubblicazioni non sono intese come, e non costituiscono, consulenza o raccomandazioni finanziarie, di investimento, di trading o di altro tipo fornite o approvate da TradingView. Per ulteriori informazioni, consultare i Termini di utilizzo.
Declinazione di responsabilità
Le informazioni e le pubblicazioni non sono intese come, e non costituiscono, consulenza o raccomandazioni finanziarie, di investimento, di trading o di altro tipo fornite o approvate da TradingView. Per ulteriori informazioni, consultare i Termini di utilizzo.