Aggiornato
RSI T-Bands
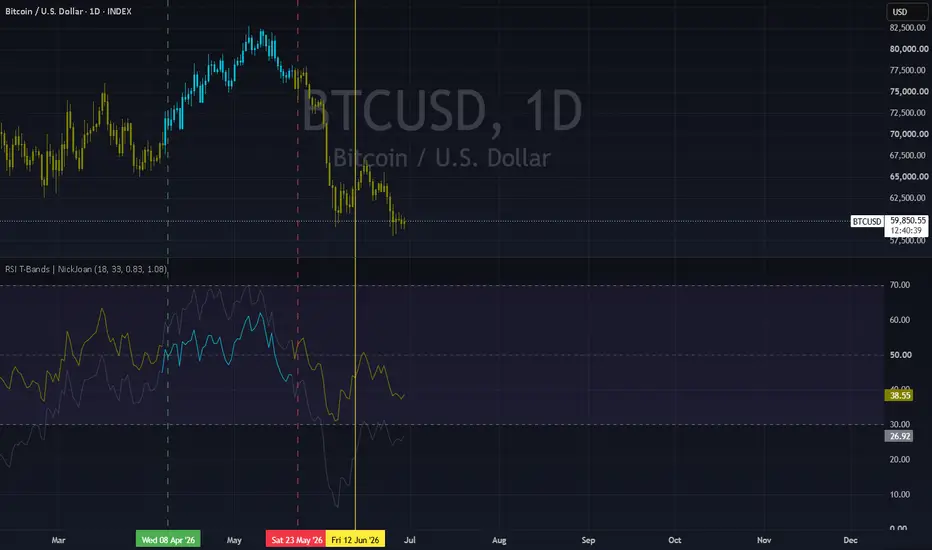
Overview
RSI T-Bands is a trend-following indicator that wraps RSI with upper and lower bands built from standard deviation. Instead of treating RSI as a simple overbought/oversold oscillator, it uses the position of these bands relative to the 50 midline to define a bullish or bearish trend state. Bands expand and contract with RSI volatility, making the indicator adaptive to changing momentum conditions.
• Bullish state: begins when the lower RSI band moves above 50.
• Bearish state: begins when the upper RSI band moves below 50
How to use
Candle coloring reflects the current trend state (green = bullish, red = bearish).
The upper and lower RSI bands act as dynamic thresholds around RSI.
The dashed 50 midline is the trend decision boundary.
Alerts
The script includes two alert conditions:
RSI T-Bands Bullish: triggers when the trend state flips from bearish to bullish.
RSI T-Bands Bearish: triggers when the trend state flips from bullish to bearish.
RSI T-Bands is a trend-following indicator that wraps RSI with upper and lower bands built from standard deviation. Instead of treating RSI as a simple overbought/oversold oscillator, it uses the position of these bands relative to the 50 midline to define a bullish or bearish trend state. Bands expand and contract with RSI volatility, making the indicator adaptive to changing momentum conditions.
• Bullish state: begins when the lower RSI band moves above 50.
• Bearish state: begins when the upper RSI band moves below 50
How to use
Candle coloring reflects the current trend state (green = bullish, red = bearish).
The upper and lower RSI bands act as dynamic thresholds around RSI.
The dashed 50 midline is the trend decision boundary.
Alerts
The script includes two alert conditions:
RSI T-Bands Bullish: triggers when the trend state flips from bearish to bullish.
RSI T-Bands Bearish: triggers when the trend state flips from bullish to bearish.
Note di rilascio
Added separate upper and lower standard deviation multipliers.Note di rilascio
Changed bar coloring.
Declinazione di responsabilità
Le informazioni e le pubblicazioni non sono intese come, e non costituiscono, consulenza o raccomandazioni finanziarie, di investimento, di trading o di altro tipo fornite o approvate da TradingView. Per ulteriori informazioni, consultare i Termini di utilizzo.
Declinazione di responsabilità
Le informazioni e le pubblicazioni non sono intese come, e non costituiscono, consulenza o raccomandazioni finanziarie, di investimento, di trading o di altro tipo fornite o approvate da TradingView. Per ulteriori informazioni, consultare i Termini di utilizzo.