OPEN-SOURCE SCRIPT
SVT 30M Options Swing Indicator
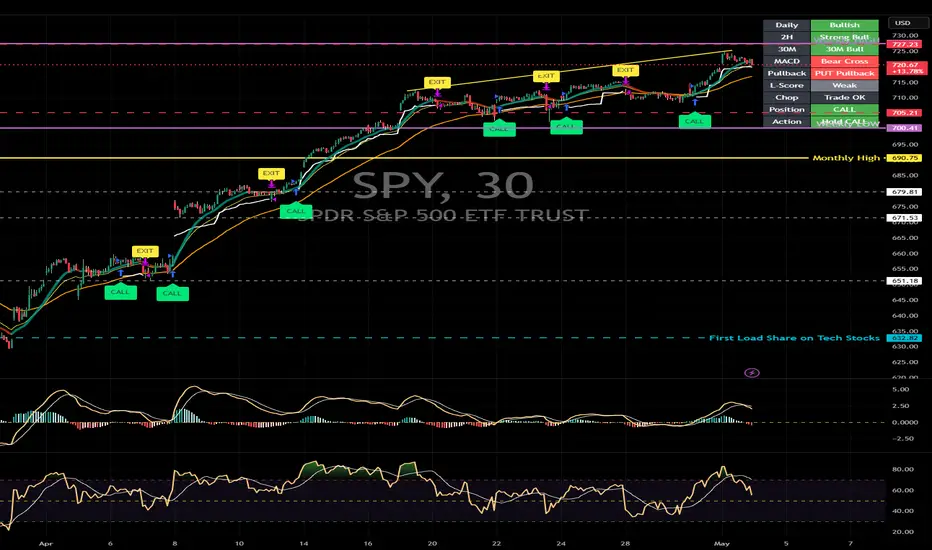
SVT 30M Options Swing Indicator Description
This indicator is designed as a swing trading assistant for SPY / QQQ options using the 30-minute chart for entries and exits, while using the Daily and 2H timeframes to confirm the larger trend direction.
The main idea is:
Trend is your friend.
Daily + 2H define direction.
30M gives the timing.
Lorentzian-style score confirms trade quality.
This indicator is not designed for scalping. It is designed to help identify higher-quality CALL and PUT opportunities that can potentially be held for a swing move, while avoiding low-quality trades during chop, consolidation, or weak momentum.
Strategy Logic
The strategy combines several layers of confirmation:
1. Higher Timeframe Trend
The indicator first checks the Daily and 2H charts.
The Daily timeframe is used to define the larger market bias:
Daily Bullish = price above Daily EMA 50 and RSI above 50
Daily Bearish = price below Daily EMA 50 and RSI below 50
The 2H timeframe is used to confirm the active swing direction:
2H Bullish = price above EMA 20, RSI above 50, and MACD above signal
2H Bearish = price below EMA 20, RSI below 50, and MACD below signal
This helps avoid trading against the bigger trend.
2. 30-Minute Entry Timing
The 30-minute chart is used for actual entry timing.
A CALL setup looks for:
Daily / 2H bullish direction
Recent 30M pullback
30M MACD bullish cross
RSI recovery
Price reclaiming EMA 20
Bullish Lorentzian-style score
No chop / consolidation warning
A PUT setup looks for:
Daily / 2H bearish direction
Recent 30M pullback or rejection
30M MACD bearish cross
RSI weakness
Price rejecting EMA 20
Bearish Lorentzian-style score
No chop / consolidation warning
3. Lorentzian-Style Score
The indicator uses a Lorentzian-inspired quality score to confirm whether the market condition supports the trade.
The score uses:
RSI 14
RSI 9
WaveTrend
CCI
ADX
MACD momentum
EMA trend structure
For CALLs, the score checks if momentum and trend conditions are bullish.
For PUTs, the score checks if momentum and trend conditions are bearish.
This helps filter out weaker signals.
4. Chop / Consolidation Filter
The indicator avoids trades when the market is sideways.
It checks:
Low ADX
EMA 20 and EMA 50 compression
Tight price range
Price moving inside a range
When the market is choppy, the table may show:
Chop: No Trade
That means the signal should be avoided because options can lose value quickly in sideways action due to theta decay.
5. Exit Logic
The strategy does not exit on every small pullback. It looks for stronger confirmation.
CALL exits can happen when:
30M MACD crosses bearish
RSI weakens
Price loses EMA 20
2H trend turns bearish
Price breaks below EMA 50 with weakness
ATR stop is hit
Maximum hold time is reached
PUT exits can happen when:
30M MACD crosses bullish
RSI recovers
Price reclaims EMA 20
2H trend turns bullish
Price breaks above EMA 50 with strength
ATR stop is hit
Maximum hold time is reached
The goal is to hold winners longer but exit when the trend clearly weakens.
Meaning of the Table
The table is the main decision dashboard.
Daily
Shows the larger market bias.
Bullish = larger trend favors CALLs
Bearish = larger trend favors PUTs
Neutral = no clear daily direction
2H
Shows the active swing trend.
Strong Bull = 2H supports CALLs strongly
Bull Recovery = 2H may be turning bullish
Strong Bear = 2H supports PUTs strongly
Bear Recovery = 2H may be turning bearish
Neutral = no strong 2H direction
30M
Shows the current 30-minute trend.
30M Bull = short-term trend favors CALLs
30M Bear = short-term trend favors PUTs
Neutral = short-term trend is unclear
MACD
Shows the recent 30-minute MACD cross.
Bull Cross = recent bullish MACD cross
Bear Cross = recent bearish MACD cross
No Fresh Cross = no recent MACD timing signal
MACD is used for timing, but it should be confirmed by the trend and L-Score.
Pullback
Shows whether price recently pulled back into a potential entry area.
CALL Pullback = possible CALL setup area
PUT Pullback = possible PUT setup area
None = no pullback setup
A pullback alone is not an entry. It needs MACD, trend, and L-Score confirmation.
L-Score
This is the Lorentzian-style quality score.
Bull 5 or higher = bullish conditions are strong
Bear 5 or higher = bearish conditions are strong
Weak = no strong quality confirmation
The stronger the L-Score, the better the trade quality.
Chop
Shows whether the market is tradable or sideways.
Trade OK = market is not detected as choppy
No Trade = market is consolidating or too sideways
Avoid new trades when this says No Trade.
Position
Shows the current strategy position.
CALL = currently in a CALL / long trade
PUT = currently in a PUT / short trade
Flat = no active trade
Action
This is the simplified guidance.
Hold CALL = stay in the CALL trade
Hold PUT = stay in the PUT trade
CALL Watch = conditions are building for CALL
PUT Watch = conditions are building for PUT
Wait = no high-quality setup
How to Use the Indicator
For a strong CALL setup, look for:
Daily: Bullish
2H: Strong Bull or Bull Recovery
30M: 30M Bull
MACD: Bull Cross
Pullback: CALL Pullback
L-Score: Bull 5 or higher
Chop: Trade OK
Action: CALL Watch or Hold CALL
For a strong PUT setup, look for:
Daily: Bearish
2H: Strong Bear or Bear Recovery
30M: 30M Bear
MACD: Bear Cross
Pullback: PUT Pullback
L-Score: Bear 5 or higher
Chop: Trade OK
Action: PUT Watch or Hold PUT
Avoid trades when:
Daily and 2H disagree strongly
L-Score is Weak
Chop says No Trade
MACD is opposite the desired direction
Price is too extended away from EMA 20
Action says Wait
Simple Trading Rules
Entry Rule
Only enter when the higher timeframe direction, 30M MACD, pullback, L-Score, and chop filter agree.
Exit Rule
Do not exit on the first small pullback.
Exit when MACD, RSI, price, or 2H trend confirm weakness, or when the strategy prints EXIT.
Trend Rule
If Daily and 2H are bullish, focus on CALLs.
If Daily and 2H are bearish, focus on PUTs.
If trend is mixed, wait for a cleaner setup.
Theta Rule
Avoid sitting in sideways trades.
Options lose value when price does not move.
If Chop says No Trade or the trade is not moving, be cautious.
Summary
This indicator is a multi-timeframe swing options strategy that uses:
Daily trend
2H confirmation
30M MACD timing
Pullback entries
Lorentzian-style quality score
Chop filter
ATR runner stop
RSI + MACD exit confirmation
It is meant to help traders avoid random entries and focus on higher-quality swing setups where the trend, momentum, and market condition are aligned.
This indicator is designed as a swing trading assistant for SPY / QQQ options using the 30-minute chart for entries and exits, while using the Daily and 2H timeframes to confirm the larger trend direction.
The main idea is:
Trend is your friend.
Daily + 2H define direction.
30M gives the timing.
Lorentzian-style score confirms trade quality.
This indicator is not designed for scalping. It is designed to help identify higher-quality CALL and PUT opportunities that can potentially be held for a swing move, while avoiding low-quality trades during chop, consolidation, or weak momentum.
Strategy Logic
The strategy combines several layers of confirmation:
1. Higher Timeframe Trend
The indicator first checks the Daily and 2H charts.
The Daily timeframe is used to define the larger market bias:
Daily Bullish = price above Daily EMA 50 and RSI above 50
Daily Bearish = price below Daily EMA 50 and RSI below 50
The 2H timeframe is used to confirm the active swing direction:
2H Bullish = price above EMA 20, RSI above 50, and MACD above signal
2H Bearish = price below EMA 20, RSI below 50, and MACD below signal
This helps avoid trading against the bigger trend.
2. 30-Minute Entry Timing
The 30-minute chart is used for actual entry timing.
A CALL setup looks for:
Daily / 2H bullish direction
Recent 30M pullback
30M MACD bullish cross
RSI recovery
Price reclaiming EMA 20
Bullish Lorentzian-style score
No chop / consolidation warning
A PUT setup looks for:
Daily / 2H bearish direction
Recent 30M pullback or rejection
30M MACD bearish cross
RSI weakness
Price rejecting EMA 20
Bearish Lorentzian-style score
No chop / consolidation warning
3. Lorentzian-Style Score
The indicator uses a Lorentzian-inspired quality score to confirm whether the market condition supports the trade.
The score uses:
RSI 14
RSI 9
WaveTrend
CCI
ADX
MACD momentum
EMA trend structure
For CALLs, the score checks if momentum and trend conditions are bullish.
For PUTs, the score checks if momentum and trend conditions are bearish.
This helps filter out weaker signals.
4. Chop / Consolidation Filter
The indicator avoids trades when the market is sideways.
It checks:
Low ADX
EMA 20 and EMA 50 compression
Tight price range
Price moving inside a range
When the market is choppy, the table may show:
Chop: No Trade
That means the signal should be avoided because options can lose value quickly in sideways action due to theta decay.
5. Exit Logic
The strategy does not exit on every small pullback. It looks for stronger confirmation.
CALL exits can happen when:
30M MACD crosses bearish
RSI weakens
Price loses EMA 20
2H trend turns bearish
Price breaks below EMA 50 with weakness
ATR stop is hit
Maximum hold time is reached
PUT exits can happen when:
30M MACD crosses bullish
RSI recovers
Price reclaims EMA 20
2H trend turns bullish
Price breaks above EMA 50 with strength
ATR stop is hit
Maximum hold time is reached
The goal is to hold winners longer but exit when the trend clearly weakens.
Meaning of the Table
The table is the main decision dashboard.
Daily
Shows the larger market bias.
Bullish = larger trend favors CALLs
Bearish = larger trend favors PUTs
Neutral = no clear daily direction
2H
Shows the active swing trend.
Strong Bull = 2H supports CALLs strongly
Bull Recovery = 2H may be turning bullish
Strong Bear = 2H supports PUTs strongly
Bear Recovery = 2H may be turning bearish
Neutral = no strong 2H direction
30M
Shows the current 30-minute trend.
30M Bull = short-term trend favors CALLs
30M Bear = short-term trend favors PUTs
Neutral = short-term trend is unclear
MACD
Shows the recent 30-minute MACD cross.
Bull Cross = recent bullish MACD cross
Bear Cross = recent bearish MACD cross
No Fresh Cross = no recent MACD timing signal
MACD is used for timing, but it should be confirmed by the trend and L-Score.
Pullback
Shows whether price recently pulled back into a potential entry area.
CALL Pullback = possible CALL setup area
PUT Pullback = possible PUT setup area
None = no pullback setup
A pullback alone is not an entry. It needs MACD, trend, and L-Score confirmation.
L-Score
This is the Lorentzian-style quality score.
Bull 5 or higher = bullish conditions are strong
Bear 5 or higher = bearish conditions are strong
Weak = no strong quality confirmation
The stronger the L-Score, the better the trade quality.
Chop
Shows whether the market is tradable or sideways.
Trade OK = market is not detected as choppy
No Trade = market is consolidating or too sideways
Avoid new trades when this says No Trade.
Position
Shows the current strategy position.
CALL = currently in a CALL / long trade
PUT = currently in a PUT / short trade
Flat = no active trade
Action
This is the simplified guidance.
Hold CALL = stay in the CALL trade
Hold PUT = stay in the PUT trade
CALL Watch = conditions are building for CALL
PUT Watch = conditions are building for PUT
Wait = no high-quality setup
How to Use the Indicator
For a strong CALL setup, look for:
Daily: Bullish
2H: Strong Bull or Bull Recovery
30M: 30M Bull
MACD: Bull Cross
Pullback: CALL Pullback
L-Score: Bull 5 or higher
Chop: Trade OK
Action: CALL Watch or Hold CALL
For a strong PUT setup, look for:
Daily: Bearish
2H: Strong Bear or Bear Recovery
30M: 30M Bear
MACD: Bear Cross
Pullback: PUT Pullback
L-Score: Bear 5 or higher
Chop: Trade OK
Action: PUT Watch or Hold PUT
Avoid trades when:
Daily and 2H disagree strongly
L-Score is Weak
Chop says No Trade
MACD is opposite the desired direction
Price is too extended away from EMA 20
Action says Wait
Simple Trading Rules
Entry Rule
Only enter when the higher timeframe direction, 30M MACD, pullback, L-Score, and chop filter agree.
Exit Rule
Do not exit on the first small pullback.
Exit when MACD, RSI, price, or 2H trend confirm weakness, or when the strategy prints EXIT.
Trend Rule
If Daily and 2H are bullish, focus on CALLs.
If Daily and 2H are bearish, focus on PUTs.
If trend is mixed, wait for a cleaner setup.
Theta Rule
Avoid sitting in sideways trades.
Options lose value when price does not move.
If Chop says No Trade or the trade is not moving, be cautious.
Summary
This indicator is a multi-timeframe swing options strategy that uses:
Daily trend
2H confirmation
30M MACD timing
Pullback entries
Lorentzian-style quality score
Chop filter
ATR runner stop
RSI + MACD exit confirmation
It is meant to help traders avoid random entries and focus on higher-quality swing setups where the trend, momentum, and market condition are aligned.
Script open-source
Nello spirito di TradingView, l'autore di questo script lo ha reso open source, in modo che i trader possano esaminarne e verificarne la funzionalità. Complimenti all'autore! Sebbene sia possibile utilizzarlo gratuitamente, ricordiamo che la ripubblicazione del codice è soggetta al nostro Regolamento.

Declinazione di responsabilità
Le informazioni e le pubblicazioni non sono intese come, e non costituiscono, consulenza o raccomandazioni finanziarie, di investimento, di trading o di altro tipo fornite o approvate da TradingView. Per ulteriori informazioni, consultare i Termini di utilizzo.
Script open-source
Nello spirito di TradingView, l'autore di questo script lo ha reso open source, in modo che i trader possano esaminarne e verificarne la funzionalità. Complimenti all'autore! Sebbene sia possibile utilizzarlo gratuitamente, ricordiamo che la ripubblicazione del codice è soggetta al nostro Regolamento.
Declinazione di responsabilità
Le informazioni e le pubblicazioni non sono intese come, e non costituiscono, consulenza o raccomandazioni finanziarie, di investimento, di trading o di altro tipo fornite o approvate da TradingView. Per ulteriori informazioni, consultare i Termini di utilizzo.