Aggiornato
[blackcat] L2 Ehlers Leading Indicator
Level: 2
Background
John F. Ehlers introuced Leading Indicator in his "Cybernetic Analysis for Stocks and Futures" chapter 16 on 2004.
Function
The leading characteristic is present in the net filte.As predicted, the lead is one bar at very low frequencies. That is, the trend indication will lead by one bar. However, the net filter has a lag of approximately 2.5 bars for cycle components near 20-bar cycles. Also, higher-frequency lag settles down to be about half a bar. The interpretation of the lag response is that the filter predicts a continuation of a trend by 1 bar, lags abrupt changes by about 0.5 bars, and lags smooth changes that can be fitted by segments of a 20-bar sinewave by as much as 2.5 bars. That’s the law of physics—you cannot get something for nothing. Causal filters can have a predictive capability over some portion of the frequency response, but not at all frequencies. There is no magic predictor.
Key Signal
NetLead ---> Leading Indicator fast line
EMA ---> Leading Indicator slow line
Pros and Cons
100% John F. Ehlers definition translation of original work, even variable names are the same. This help readers who would like to use pine to read his book. If you had read his works, then you will be quite familiar with my code style.
Remarks
The 35th script for Blackcat1402 John F. Ehlers Week publication.
Readme
In real life, I am a prolific inventor. I have successfully applied for more than 60 international and regional patents in the past 12 years. But in the past two years or so, I have tried to transfer my creativity to the development of trading strategies. Tradingview is the ideal platform for me. I am selecting and contributing some of the hundreds of scripts to publish in Tradingview community. Welcome everyone to interact with me to discuss these interesting pine scripts.
The scripts posted are categorized into 5 levels according to my efforts or manhours put into these works.
Level 1 : interesting script snippets or distinctive improvement from classic indicators or strategy. Level 1 scripts can usually appear in more complex indicators as a function module or element.
Level 2 : composite indicator/strategy. By selecting or combining several independent or dependent functions or sub indicators in proper way, the composite script exhibits a resonance phenomenon which can filter out noise or fake trading signal to enhance trading confidence level.
Level 3 : comprehensive indicator/strategy. They are simple trading systems based on my strategies. They are commonly containing several or all of entry signal, close signal, stop loss, take profit, re-entry, risk management, and position sizing techniques. Even some interesting fundamental and mass psychological aspects are incorporated.
Level 4 : script snippets or functions that do not disclose source code. Interesting element that can reveal market laws and work as raw material for indicators and strategies. If you find Level 1~2 scripts are helpful, Level 4 is a private version that took me far more efforts to develop.
Level 5 : indicator/strategy that do not disclose source code. private version of Level 3 script with my accumulated script processing skills or a large number of custom functions. I had a private function library built in past two years. Level 5 scripts use many of them to achieve private trading strategy.
Background
John F. Ehlers introuced Leading Indicator in his "Cybernetic Analysis for Stocks and Futures" chapter 16 on 2004.
Function
The leading characteristic is present in the net filte.As predicted, the lead is one bar at very low frequencies. That is, the trend indication will lead by one bar. However, the net filter has a lag of approximately 2.5 bars for cycle components near 20-bar cycles. Also, higher-frequency lag settles down to be about half a bar. The interpretation of the lag response is that the filter predicts a continuation of a trend by 1 bar, lags abrupt changes by about 0.5 bars, and lags smooth changes that can be fitted by segments of a 20-bar sinewave by as much as 2.5 bars. That’s the law of physics—you cannot get something for nothing. Causal filters can have a predictive capability over some portion of the frequency response, but not at all frequencies. There is no magic predictor.
Key Signal
NetLead ---> Leading Indicator fast line
EMA ---> Leading Indicator slow line
Pros and Cons
100% John F. Ehlers definition translation of original work, even variable names are the same. This help readers who would like to use pine to read his book. If you had read his works, then you will be quite familiar with my code style.
Remarks
The 35th script for Blackcat1402 John F. Ehlers Week publication.
Readme
In real life, I am a prolific inventor. I have successfully applied for more than 60 international and regional patents in the past 12 years. But in the past two years or so, I have tried to transfer my creativity to the development of trading strategies. Tradingview is the ideal platform for me. I am selecting and contributing some of the hundreds of scripts to publish in Tradingview community. Welcome everyone to interact with me to discuss these interesting pine scripts.
The scripts posted are categorized into 5 levels according to my efforts or manhours put into these works.
Level 1 : interesting script snippets or distinctive improvement from classic indicators or strategy. Level 1 scripts can usually appear in more complex indicators as a function module or element.
Level 2 : composite indicator/strategy. By selecting or combining several independent or dependent functions or sub indicators in proper way, the composite script exhibits a resonance phenomenon which can filter out noise or fake trading signal to enhance trading confidence level.
Level 3 : comprehensive indicator/strategy. They are simple trading systems based on my strategies. They are commonly containing several or all of entry signal, close signal, stop loss, take profit, re-entry, risk management, and position sizing techniques. Even some interesting fundamental and mass psychological aspects are incorporated.
Level 4 : script snippets or functions that do not disclose source code. Interesting element that can reveal market laws and work as raw material for indicators and strategies. If you find Level 1~2 scripts are helpful, Level 4 is a private version that took me far more efforts to develop.
Level 5 : indicator/strategy that do not disclose source code. private version of Level 3 script with my accumulated script processing skills or a large number of custom functions. I had a private function library built in past two years. Level 5 scripts use many of them to achieve private trading strategy.
Note di rilascio
OVERVIEW This indicator implements the Ehlers Leading Indicator (ELI) with advanced divergence detection capabilities. It displays leading signals on price movements and identifies bullish and bearish divergences through multiple detection methods.FEATURES
• Calculates Ehlers Leading Indicator using customizable Alpha parameters
• Plots Net Lead and EMA lines with dynamic fill coloring
• Displays BUY/SELL labels at crossover points
• Detects four types of divergences:
Regular Bullish
Hidden Bullish
Regular Bearish
Hidden Bearish • Customizable lookback periods and alert conditions
HOW TO USE
Input Parameters:
• Price: Select the price source (default: hl2)
• Alpha1: Set the first smoothing parameter (default: 0.25)
• Alpha2: Set the second smoothing parameter (default: 0.33)
• Pivot Lookback Right/Left: Adjust pivot detection range
• Max/Min of Lookback Range: Set maximum/minimum bars for divergence detection
• Toggle visibility of bullish/bearish divergences
Interpretation:
• Monitor Net Lead and EMA lines for trend direction
• Watch for BUY/SELL labels at crossovers
• Identify divergences by observing price and oscillator behavior
• Use alerts to notify of detected divergences
LIMITATIONS
• Requires sufficient historical data for accurate calculations
• Divergence detection may generate false signals in choppy markets
• Results depend heavily on chosen input parameters
NOTES
• The indicator uses the Ehlers Leading Indicator algorithm for forward-looking price prediction
• Alert conditions are available for all divergence types
• Colors can be customized through TradingView's settings panel
Note di rilascio
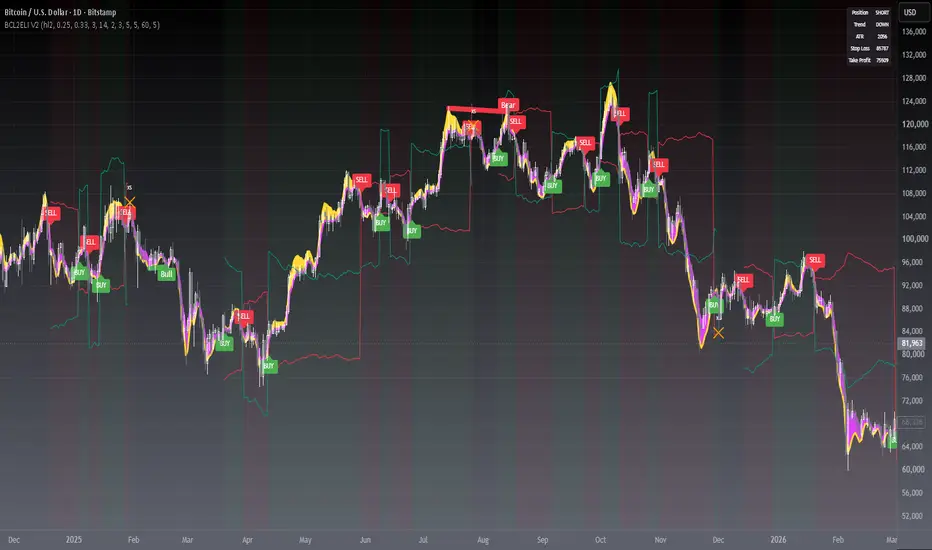
█ OVERVIEWThis indicator applies John Ehlers' Leading Indicator to spot trend turns early: a fast Net Lead line and a smooth EMA line cross to mark potential buy and sell points. V2 adds a full signal engine on top - state-machine trade signals, cooldown filtering, ATR-based take-profit and stop-loss levels, eight alert hooks and an on-chart dashboard.
█ CONCEPTS
The engine computes two synchronized lines from the selected price source:
• Net Lead (yellow) - a two-stage smoothed leading response that reacts quickly to price impulses
• EMA (fuchsia) - a half-alpha EMA baseline used as the reference line
Key principles:
• Line crosses act as directional triggers: Net Lead crossing above EMA is bullish, crossing below is bearish
• A position state machine arbitrates every cross so entries, exits and reversals never conflict on the same bar
• A pivot-based divergence module scans the Net Lead oscillator for regular and hidden divergences
█ HOW TO USE
1 — Add the indicator to your chart. Lines render on the price panel because both series share the price scale.
2 — Tune Alpha1 / Alpha2 to control how aggressively the Net Lead line leads price (higher = faster, noisier).
3 — Read BUY / SELL labels as state-confirmed entries, XL / XS orange crosses as exits, and the background tint as the current position direction.
4 — Optional: enable the divergence labels and set any of the eight alerts.
Input Parameters
• Price - source feeding the Ehlers calculation (default HL2)
• Alpha1 / Alpha2 - lead and smoothing coefficients, 0.01-0.99 (defaults 0.25 / 0.33)
• Same-bar Entry/Exit Exclusivity - resolves conflicts, exit wins (default on)
• Cooldown Bars - minimum bars between signals, 0 disables (default 3)
• Enable Short Signals - turn off for long-only analysis (default on)
• Show TP/SL Levels / ATR Length / Stop & Take Profit xATR - risk reference lines (on / 14 / 2.0 / 3.0)
• Pivot Lookback Left/Right, Lookback Range min/max - divergence window (5/5, 5/60)
• Plot Bullish / Hidden Bullish / Bearish / Hidden Bearish - toggle each divergence class
• Show Entry/Exit Labels / Position Background / Dashboard - visual toggles
█ FEATURES
• State-machine governed BUY / SELL signals with cooldown and same-bar exclusivity
• ATR-based take-profit and stop-loss guide lines from each entry
• Regular and hidden, bullish and bearish divergence detection on Net Lead
• Eight alertcondition hooks plus dynamic bar-close alert messages
• On-chart dashboard: position, trend state, ATR, active TP/SL
• Position background tinting for instant direction reading
█ SIGNALS
Visual Elements
• BUY label (green, below price) - Net Lead crossed above EMA, long entry confirmed
• SELL label (red, above price) - Net Lead crossed under EMA, short entry confirmed
• XL / XS orange crosses - long / short exit (opposite cross or cooldown-gated reversal)
• Yellow / fuchsia fill - current lead direction between the two lines
• Bull / Bear and H Bull / H Bear labels - regular and hidden divergences on Net Lead pivots
• Green / red background - long or short state
█ IMPLEMENTATION NOTES
• Core filter follows Ehlers' two-pole leading structure: a lead polynomial, an alpha-smoothed net lead and a half-alpha EMA
• Signals fire on confirmed crosses only; no request.security calls, no repainting of signals
• Divergence pivots confirm after the right lookback bars, so divergence marks appear lbR bars behind the actual pivot by construction
█ LIMITATIONS
• Leading indicators react fast but whipsaw in strong trends and tight ranges - use the cooldown and higher-timeframe context
• TP/SL lines are visual references only; the script does not place orders
• Divergence signals are delayed by the pivot confirmation window
• Best used on liquid markets and timeframes of 15 minutes and above
█ NOTES
• V2 of the original blackcat L2 Ehlers Leading Indicator by blackcat1402 - same core engine, upgraded signal engine
• Original core released under the Mozilla Public License 2.0
════════════════════════════════════════════════════════════════════════
For questions or feedback, please use the comments section below.
Feel free to use and modify — attribution appreciated.

Don't miss out! The first and most important thing to do is to join my Discord chat now! Click here to start your adventure: discord.com/invite/ZTGpQJq My new github for more pine development soon: github.com/wxt-coder
Declinazione di responsabilità
Le informazioni e le pubblicazioni non sono intese come, e non costituiscono, consulenza o raccomandazioni finanziarie, di investimento, di trading o di altro tipo fornite o approvate da TradingView. Per ulteriori informazioni, consultare i Termini di utilizzo.
Don't miss out! The first and most important thing to do is to join my Discord chat now! Click here to start your adventure: discord.com/invite/ZTGpQJq My new github for more pine development soon: github.com/wxt-coder
Declinazione di responsabilità
Le informazioni e le pubblicazioni non sono intese come, e non costituiscono, consulenza o raccomandazioni finanziarie, di investimento, di trading o di altro tipo fornite o approvate da TradingView. Per ulteriori informazioni, consultare i Termini di utilizzo.