Gaussian Distribution
Gaussian Distribution
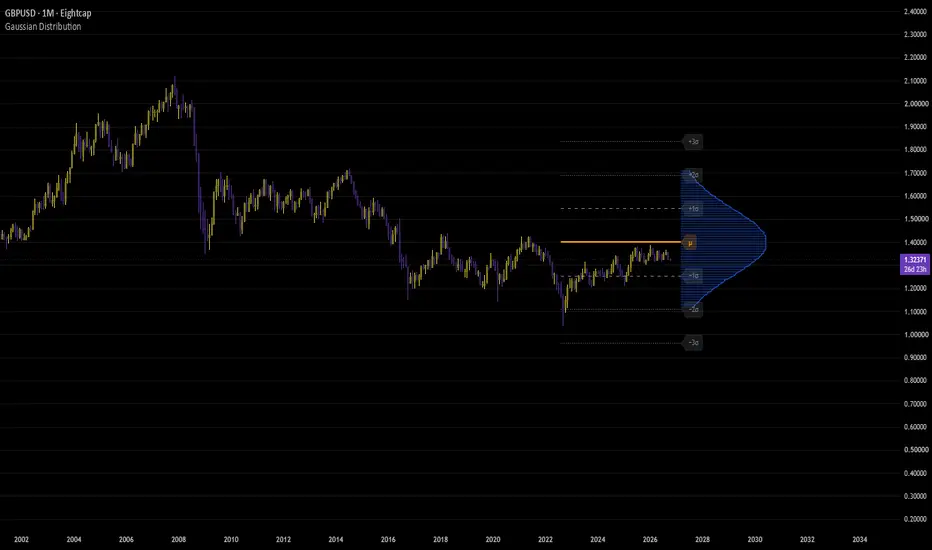
A TradingView indicator that draws a Gaussian (normal) distribution, or "bell curve," of price over a lookback period on the right-hand side of the chart, along with the mean (μ) and ±1σ, ±2σ, and ±3σ reference lines.
What it does
This indicator plots the statistical distribution of price over a configurable lookback window. The shape and width of the bell curve show how tightly price has clustered around its average, and the sigma lines mark ranges that contain roughly 68%, 95%, and 99.7% of a normal distribution.
Practical tips
- Use the sigma lines as a quick read on how "normal" the current move is. A move beyond ±2σ is uncommon; beyond ±3σ is rare and often marks a volatility spike or a potential reversal zone.
- Switch Mean Type between SMA and Median to see how much outliers are distorting the picture.
- Lower the Lookback Length for a faster, more responsive distribution on shorter timeframes; raise it for a calmer, longer-term view.
- Keep Curve Steps around 100 to 120 for a good balance of smoothness and performance. Increase only if the curve looks visibly jagged.
- This is a statistical tool, not a standalone buy/sell signal. Combine it with your usual price action, volume, and trend analysis.
Notes
- The curve and reference lines are recalculated and redrawn on the last bar only, so they represent the current lookback window at the right edge of the chart.
- The percentages described assume price roughly follows a normal distribution, which real markets do only approximately. Treat them as guidelines, not guarantees.
A TradingView indicator that draws a Gaussian (normal) distribution, or "bell curve," of price over a lookback period on the right-hand side of the chart, along with the mean (μ) and ±1σ, ±2σ, and ±3σ reference lines.
What it does
This indicator plots the statistical distribution of price over a configurable lookback window. The shape and width of the bell curve show how tightly price has clustered around its average, and the sigma lines mark ranges that contain roughly 68%, 95%, and 99.7% of a normal distribution.
Practical tips
- Use the sigma lines as a quick read on how "normal" the current move is. A move beyond ±2σ is uncommon; beyond ±3σ is rare and often marks a volatility spike or a potential reversal zone.
- Switch Mean Type between SMA and Median to see how much outliers are distorting the picture.
- Lower the Lookback Length for a faster, more responsive distribution on shorter timeframes; raise it for a calmer, longer-term view.
- Keep Curve Steps around 100 to 120 for a good balance of smoothness and performance. Increase only if the curve looks visibly jagged.
- This is a statistical tool, not a standalone buy/sell signal. Combine it with your usual price action, volume, and trend analysis.
Notes
- The curve and reference lines are recalculated and redrawn on the last bar only, so they represent the current lookback window at the right edge of the chart.
- The percentages described assume price roughly follows a normal distribution, which real markets do only approximately. Treat them as guidelines, not guarantees.

Declinazione di responsabilità
Le informazioni e le pubblicazioni non sono intese come, e non costituiscono, consulenza o raccomandazioni finanziarie, di investimento, di trading o di altro tipo fornite o approvate da TradingView. Per ulteriori informazioni, consultare i Termini di utilizzo.
Declinazione di responsabilità
Le informazioni e le pubblicazioni non sono intese come, e non costituiscono, consulenza o raccomandazioni finanziarie, di investimento, di trading o di altro tipo fornite o approvate da TradingView. Per ulteriori informazioni, consultare i Termini di utilizzo.