OPEN-SOURCE SCRIPT
Williams %R - %R | TR
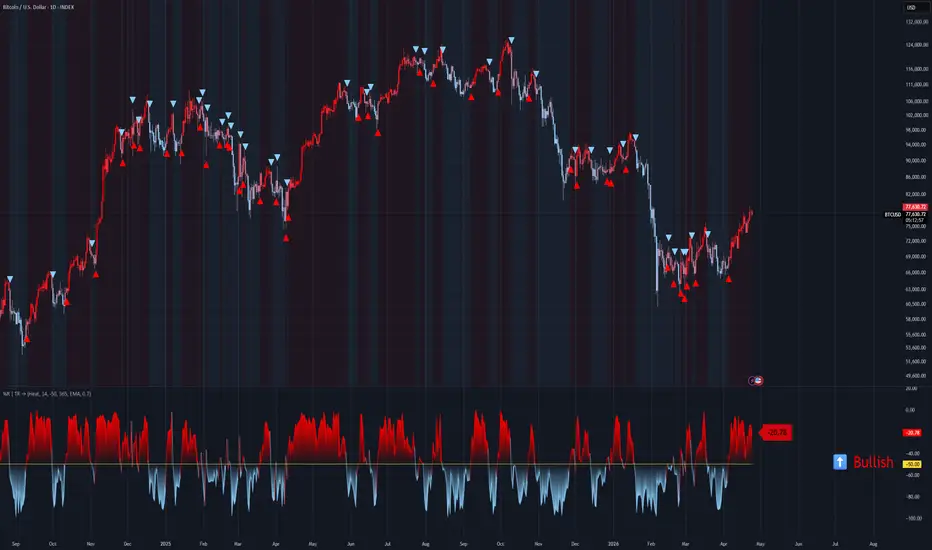
🎯 Overview
Williams %R – %R | TR is a modernised version of Larry Williams’ classic momentum oscillator. It measures the closing price relative to the highest high over a lookback period, producing values from -100 (oversold) to 0 (overbought). This implementation adds dynamic entry levels (either fixed 50 or a moving average of %R), gradient candle coloring, momentum‑based fill transparency, and nine color themes – turning a traditional indicator into a highly visual, adaptable trading tool.
Key Features
📐 Core Oscillator
Williams %R – Standard formula: (HighestHigh - Close) / (HighestHigh - LowestLow) * -100.
Values typically range from -100 (oversold) to 0 (overbought).
Reversed scale – Lower values indicate selling pressure, higher values indicate buying pressure.
🎯 Flexible Entry/Exit Signal
Option 1: Fixed 50 Level – Classic approach: cross above -50 = bullish, below -50 = bearish.
Option 2: %R Moving Average – Uses a smoothed line (many MA types available) as the dynamic threshold. Crosses of %R above/below its own MA generate signals.
🎨 Advanced Visualization
9 Color Themes – Same palette as TQI and SVZO (Classic, Modern, Heat, Robust, Accented, Monochrome, Moderate, Aqua, Cosmic).
Dynamic Fill Zones – Three fills: overbought zone (above entry), oversold zone (below entry), and a trend‑direction fill. Transparency changes with %R momentum.
Gradient Candle Coloring – Candles smoothly transition between bearish and bullish colors based on normalised %R.
Signal Markers – Triangles below/above bars on entry crosses.
Trend Table – Shows “Bullish” or “Bearish” in large coloured text.
Floating Value Label – Displays current %R value near the oscillator line.
📈 Signal System
Zero‑line cross? – No, Williams %R normally uses -50 or a dynamic MA as the threshold.
Entry signals – Bullish cross above the threshold, bearish cross below.
Persistent trend state – Remembers last direction until a crossover occurs.
Real‑time updates – Calculated on every bar.
How It Works
Calculation Logic
Williams %R – ta.wpr(Length_WillR) (TradingView’s built‑in function).
%R = (highest_high - close) / (highest_high - lowest_low) * -100
Entry Threshold – User chooses:
'50' → fixed -50 level
'%R MA' → moving average of %R (configurable length and type)
Moving Average Engine – Supports 12 types: EMA, SMA, RMA, WMA, VWMA, HMA, DEMA, TEMA, TRIMA, FRAMA, SWMA, T3 (with T‑Factor).
Normalised %R – Rescaled 0‑1 range using 70‑period min/max. Used for gradient colors.
Momentum – 5‑bar absolute change of %R, normalised against 50‑period max.
Fill transparency = 35 - (norm_momentum * 25) clamped 0‑100.
→ Higher momentum = less transparency (more visible fill).
Trend State Persistence
Trend_WillR = 1 (bullish) when %R > threshold, -1 (bearish) when %R < threshold.
Holds until a crossover happens – prevents flickering near the threshold.
Display Options
Visual Components
%R Line – Coloured by trend state (bullish/bearish) with 50% opacity.
Entry Line – Yellow horizontal line (fixed -50 or dynamic MA).
Fills:
Above entry → overbought zone (bullish fill with momentum‑based transparency).
Below entry → oversold zone (bearish fill with transparency).
Third fill → only in the current trend direction, adding emphasis.
Gradient Candles – Price bars change colour smoothly between down‑color and up‑color based on normalised %R.
Entry Signals – Triangles below (long) or above (short) bars on crossover.
Background – Very light tint matching the trend direction.
Value Label – Floating label near the %R line showing current value.
Trend Table – Middle‑right corner displays “Bullish” or “Bearish”.
Trading Signals
Entry Signals
LONG – %R crosses above the entry threshold (fixed -50 or %R MA).
→ Triangle below the price bar.
→ Candles turn bullish (gradient).
→ Background tints bullish.
SHORT – %R crosses below the entry threshold.
→ Triangle above the bar.
→ Candles turn bearish.
→ Background tints bearish.
Trend Confirmation
Strong Bullish – %R well above entry, rising, with low fill transparency (high momentum).
Strong Bearish – %R well below entry, falling.
Overbought zone – > -20 (approx). May precede a reversal; use with caution.
Oversold zone – < -80 (approx). May precede a reversal.
Divergence – Price makes a lower low but %R makes a higher low (bullish divergence) or vice versa.
Customization Settings
Technical Parameters
Length %R – Lookback period for Williams %R (default 14).
Entry/Exit Signal – Choose '50' (fixed -50) or '%R MA' (dynamic MA).
Length MA – Period for %R moving average (default 365 – very long, effectively a trend filter).
Moving Average – 12 types (EMA, SMA, RMA, WMA, VWMA, HMA, DEMA, TEMA, TRIMA, FRAMA, SWMA, T3).
T3 Factor – Only for T3 moving average (0.7 default).
Visual Parameters
Color Choice – 9 themes (all fills, candles, background, signals follow the theme).
Alert System
LONG – Triggered on bullish cross (above entry).
SHORT – Triggered on bearish cross (below entry).
Alerts include ticker symbol.
Williams %R – %R | TR is a modernised version of Larry Williams’ classic momentum oscillator. It measures the closing price relative to the highest high over a lookback period, producing values from -100 (oversold) to 0 (overbought). This implementation adds dynamic entry levels (either fixed 50 or a moving average of %R), gradient candle coloring, momentum‑based fill transparency, and nine color themes – turning a traditional indicator into a highly visual, adaptable trading tool.
Key Features
📐 Core Oscillator
Williams %R – Standard formula: (HighestHigh - Close) / (HighestHigh - LowestLow) * -100.
Values typically range from -100 (oversold) to 0 (overbought).
Reversed scale – Lower values indicate selling pressure, higher values indicate buying pressure.
🎯 Flexible Entry/Exit Signal
Option 1: Fixed 50 Level – Classic approach: cross above -50 = bullish, below -50 = bearish.
Option 2: %R Moving Average – Uses a smoothed line (many MA types available) as the dynamic threshold. Crosses of %R above/below its own MA generate signals.
🎨 Advanced Visualization
9 Color Themes – Same palette as TQI and SVZO (Classic, Modern, Heat, Robust, Accented, Monochrome, Moderate, Aqua, Cosmic).
Dynamic Fill Zones – Three fills: overbought zone (above entry), oversold zone (below entry), and a trend‑direction fill. Transparency changes with %R momentum.
Gradient Candle Coloring – Candles smoothly transition between bearish and bullish colors based on normalised %R.
Signal Markers – Triangles below/above bars on entry crosses.
Trend Table – Shows “Bullish” or “Bearish” in large coloured text.
Floating Value Label – Displays current %R value near the oscillator line.
📈 Signal System
Zero‑line cross? – No, Williams %R normally uses -50 or a dynamic MA as the threshold.
Entry signals – Bullish cross above the threshold, bearish cross below.
Persistent trend state – Remembers last direction until a crossover occurs.
Real‑time updates – Calculated on every bar.
How It Works
Calculation Logic
Williams %R – ta.wpr(Length_WillR) (TradingView’s built‑in function).
%R = (highest_high - close) / (highest_high - lowest_low) * -100
Entry Threshold – User chooses:
'50' → fixed -50 level
'%R MA' → moving average of %R (configurable length and type)
Moving Average Engine – Supports 12 types: EMA, SMA, RMA, WMA, VWMA, HMA, DEMA, TEMA, TRIMA, FRAMA, SWMA, T3 (with T‑Factor).
Normalised %R – Rescaled 0‑1 range using 70‑period min/max. Used for gradient colors.
Momentum – 5‑bar absolute change of %R, normalised against 50‑period max.
Fill transparency = 35 - (norm_momentum * 25) clamped 0‑100.
→ Higher momentum = less transparency (more visible fill).
Trend State Persistence
Trend_WillR = 1 (bullish) when %R > threshold, -1 (bearish) when %R < threshold.
Holds until a crossover happens – prevents flickering near the threshold.
Display Options
Visual Components
%R Line – Coloured by trend state (bullish/bearish) with 50% opacity.
Entry Line – Yellow horizontal line (fixed -50 or dynamic MA).
Fills:
Above entry → overbought zone (bullish fill with momentum‑based transparency).
Below entry → oversold zone (bearish fill with transparency).
Third fill → only in the current trend direction, adding emphasis.
Gradient Candles – Price bars change colour smoothly between down‑color and up‑color based on normalised %R.
Entry Signals – Triangles below (long) or above (short) bars on crossover.
Background – Very light tint matching the trend direction.
Value Label – Floating label near the %R line showing current value.
Trend Table – Middle‑right corner displays “Bullish” or “Bearish”.
Trading Signals
Entry Signals
LONG – %R crosses above the entry threshold (fixed -50 or %R MA).
→ Triangle below the price bar.
→ Candles turn bullish (gradient).
→ Background tints bullish.
SHORT – %R crosses below the entry threshold.
→ Triangle above the bar.
→ Candles turn bearish.
→ Background tints bearish.
Trend Confirmation
Strong Bullish – %R well above entry, rising, with low fill transparency (high momentum).
Strong Bearish – %R well below entry, falling.
Overbought zone – > -20 (approx). May precede a reversal; use with caution.
Oversold zone – < -80 (approx). May precede a reversal.
Divergence – Price makes a lower low but %R makes a higher low (bullish divergence) or vice versa.
Customization Settings
Technical Parameters
Length %R – Lookback period for Williams %R (default 14).
Entry/Exit Signal – Choose '50' (fixed -50) or '%R MA' (dynamic MA).
Length MA – Period for %R moving average (default 365 – very long, effectively a trend filter).
Moving Average – 12 types (EMA, SMA, RMA, WMA, VWMA, HMA, DEMA, TEMA, TRIMA, FRAMA, SWMA, T3).
T3 Factor – Only for T3 moving average (0.7 default).
Visual Parameters
Color Choice – 9 themes (all fills, candles, background, signals follow the theme).
Alert System
LONG – Triggered on bullish cross (above entry).
SHORT – Triggered on bearish cross (below entry).
Alerts include ticker symbol.
Script open-source
Nello spirito di TradingView, l'autore di questo script lo ha reso open source, in modo che i trader possano esaminarne e verificarne la funzionalità. Complimenti all'autore! Sebbene sia possibile utilizzarlo gratuitamente, ricordiamo che la ripubblicazione del codice è soggetta al nostro Regolamento.

Declinazione di responsabilità
Le informazioni e le pubblicazioni non sono intese come, e non costituiscono, consulenza o raccomandazioni finanziarie, di investimento, di trading o di altro tipo fornite o approvate da TradingView. Per ulteriori informazioni, consultare i Termini di utilizzo.
Script open-source
Nello spirito di TradingView, l'autore di questo script lo ha reso open source, in modo che i trader possano esaminarne e verificarne la funzionalità. Complimenti all'autore! Sebbene sia possibile utilizzarlo gratuitamente, ricordiamo che la ripubblicazione del codice è soggetta al nostro Regolamento.
Declinazione di responsabilità
Le informazioni e le pubblicazioni non sono intese come, e non costituiscono, consulenza o raccomandazioni finanziarie, di investimento, di trading o di altro tipo fornite o approvate da TradingView. Per ulteriori informazioni, consultare i Termini di utilizzo.