OPEN-SOURCE SCRIPT
Session Volume Pulse [TSL]
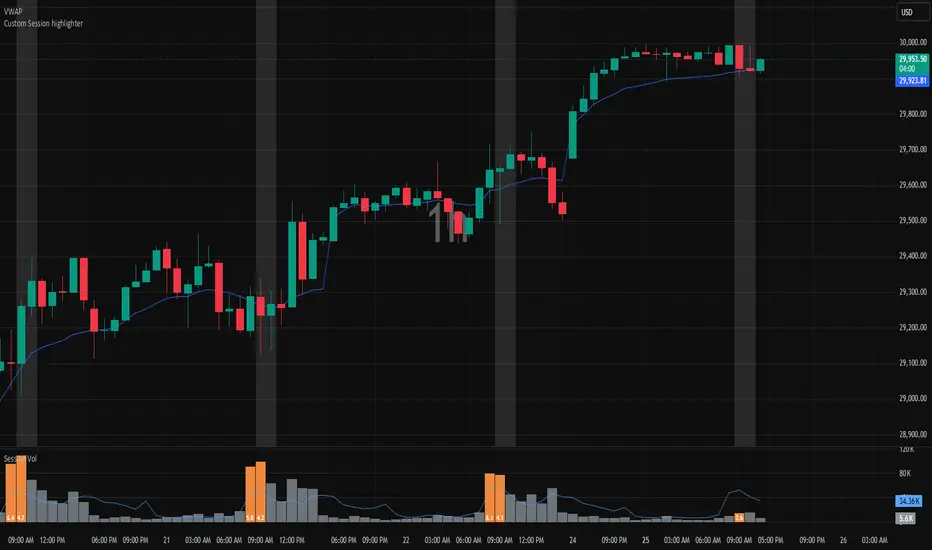
Session Volume Pulse shows whether the current bar's volume is unusual for this exact time of day — not just compared to the last 20 bars, but compared to the same minute across the last 14 trading sessions (configurable 5–60).
Most volume indicators give you raw volume and a moving average. The problem: the 9:30 AM open is always busy, and noon is always quiet. A 3x spike at 9:30 means nothing — that's just what 9:30 looks like. A 3x spike at noon is genuinely unusual. This indicator makes that distinction obvious.
═══ WHAT YOU SEE ═══
Two visual signals on the volume pane:
1. A subtle blue baseline line showing the typical volume for this exact minute of the trading day, averaged across the past 14 sessions. The line curves upward at the open, dips through lunch, rises into the close — because that's what the average session looks like.
2. A multiplier label drawn only on bars where volume is ≥ 2.5x the recent 12-bar average (e.g., "2.7"). Most bars don't get a label. The ones that do are the bars worth attention. Position and orientation are both configurable — see the settings reference below.
That's it. No divergence tints. No z-score overlay. No nine-row corner table. Two signals, both readable at a glance.
═══ HOW TO READ IT ═══
- Bar above baseline + no spike label = elevated participation, soft confirmation
- Bar at or below baseline + no spike label = normal session activity, ignore
- Spike label appears = conviction event worth attention
The combination matters most: a spike at the cash open is less meaningful than a spike at noon, because the baseline tells you what's typical for each minute.
═══ CRITICAL SETTING: BARS PER SESSION ═══
This is the only setting most users need to configure for non-default markets. The default of 0 auto-detects assuming 24h trading, which is correct for crypto/forex and close enough for ~23h futures (NQ, ES, MNQ, MES at 15m).
For US stocks during regular trading hours (6.5h), override to:
- 1m chart: 390
- 5m chart: 78
- 15m chart: 26
- 30m chart: 13
For futures across other timeframes:
- 1m: 1380
- 5m: 276
- 15m: 92 (or leave at 0)
- 30m: 46
- 1h: 23
On 4h and higher timeframes, disable "Show time-of-day baseline" — there aren't enough bars per session for the baseline math to be meaningful. The spike detection still works fine.
═══ TUNING THE LOOKBACK ═══
The "Baseline sessions to average" setting controls how many past sessions feed the time-of-day average. The default is 14, but the right choice depends on your style:
- 5–10 sessions: very responsive, adapts fast after regime shifts (vol expansion, holiday weeks). More spike-alert noise.
- 14 sessions: DEFAULT. Two trading weeks of context. Balances responsiveness with stability. Best for active intraday on 15m futures.
- 21 sessions: one calendar month. More stable baseline, fewer false-spike alerts. Slower to adapt to new regimes.
- 30–60 sessions: swing/positioning context. Very stable, very slow to update. Single high-impact event days (FOMC, CPI) linger in the average for weeks.
Rule of thumb: too many marginal spike alerts? Increase the lookback. Baseline feels stale after a vol regime change? Decrease it.
═══ ALERTS ═══
Two alert conditions, both useful:
1. "Volume spike" — fires when volume hits the spike threshold. Use for multi-symbol monitoring.
2. "Crossed session baseline" — fires when volume transitions from below to above the typical level (or vice versa). Quieter signal indicating regime change.
═══ HONEST LIMITATIONS ═══
- Does not predict direction. A spike with a green close is bullish confirmation; a spike with a red close is often capitulation or distribution. The indicator surfaces the conviction event; reading direction is on you.
- Does not work on symbols without volume. Most spot forex pairs on retail platforms report tick count, not volume. Use the equivalent futures contract (6E, 6J, 6B) for real volume analysis on forex.
- Needs history. On a fresh symbol with fewer sessions of historical bars than your lookback setting, the baseline averages whatever's available and may be choppy for the first few sessions.
- Not session-aware for time changes. DST transitions or holiday-shortened sessions in the lookback window will offset the baseline by a bar or two until they roll out of the average.
═══ WHY OPEN SOURCE ═══
Closed-source indicators in finance are a known yellow flag — they often do less than claimed or rely on lookahead bias to look better in backtests. Every line of this script is readable. Audit the math, fork it, modify it for your strategy. The math is straightforward by design.
═══ SETTINGS REFERENCE ═══
Acceleration lookback (bars): 12 default. How many recent bars feed spike detection. Use 20 for daily charts.
Spike threshold (× average): 2.5 default. How far above average a bar must be to get a label. Lower = more labels.
Baseline sessions to average: 14 default (range 5–60). See "Tuning the Lookback" above.
Bars per session: 0 (auto). See table above.
Spike label position: Four options.
- On bar (top) — text floats just inside the top of the orange bar
- On bar (middle) — text centered inside the bar
- On bar (bottom) — text sits at the base of the bar (DEFAULT)
- Below bar (pill) — legacy orange pill anchored below the bar
Spike label orientation: Two options.
- Vertical (stacked) — each character on its own line. Best for narrow bars on lower timeframes. DEFAULT.
- Horizontal — standard single-line text. Best for wider bars on higher timeframes or when bar width comfortably fits the ratio.
Position and orientation are independent — any of the four positions can use either orientation, giving you eight visual combinations.
Colors: Six configurable colors for bars, baseline, and labels.
═══════════════════════════════════════════════════════════════
Maintained by TrailingStopLoss.com — more free, open-source trading tools at trailingstoploss.com/tradingview-indicators
═══════════════════════════════════════════════════════════════
Disclaimer: This is an analytical tool that displays publicly available volume data with a time-of-day baseline overlay. It does not predict price direction or guarantee any trading outcome. Volume spikes can precede continuation, reversal, or no follow-through. Trading futures and equities involves substantial risk of loss. For educational purposes only.
Most volume indicators give you raw volume and a moving average. The problem: the 9:30 AM open is always busy, and noon is always quiet. A 3x spike at 9:30 means nothing — that's just what 9:30 looks like. A 3x spike at noon is genuinely unusual. This indicator makes that distinction obvious.
═══ WHAT YOU SEE ═══
Two visual signals on the volume pane:
1. A subtle blue baseline line showing the typical volume for this exact minute of the trading day, averaged across the past 14 sessions. The line curves upward at the open, dips through lunch, rises into the close — because that's what the average session looks like.
2. A multiplier label drawn only on bars where volume is ≥ 2.5x the recent 12-bar average (e.g., "2.7"). Most bars don't get a label. The ones that do are the bars worth attention. Position and orientation are both configurable — see the settings reference below.
That's it. No divergence tints. No z-score overlay. No nine-row corner table. Two signals, both readable at a glance.
═══ HOW TO READ IT ═══
- Bar above baseline + no spike label = elevated participation, soft confirmation
- Bar at or below baseline + no spike label = normal session activity, ignore
- Spike label appears = conviction event worth attention
The combination matters most: a spike at the cash open is less meaningful than a spike at noon, because the baseline tells you what's typical for each minute.
═══ CRITICAL SETTING: BARS PER SESSION ═══
This is the only setting most users need to configure for non-default markets. The default of 0 auto-detects assuming 24h trading, which is correct for crypto/forex and close enough for ~23h futures (NQ, ES, MNQ, MES at 15m).
For US stocks during regular trading hours (6.5h), override to:
- 1m chart: 390
- 5m chart: 78
- 15m chart: 26
- 30m chart: 13
For futures across other timeframes:
- 1m: 1380
- 5m: 276
- 15m: 92 (or leave at 0)
- 30m: 46
- 1h: 23
On 4h and higher timeframes, disable "Show time-of-day baseline" — there aren't enough bars per session for the baseline math to be meaningful. The spike detection still works fine.
═══ TUNING THE LOOKBACK ═══
The "Baseline sessions to average" setting controls how many past sessions feed the time-of-day average. The default is 14, but the right choice depends on your style:
- 5–10 sessions: very responsive, adapts fast after regime shifts (vol expansion, holiday weeks). More spike-alert noise.
- 14 sessions: DEFAULT. Two trading weeks of context. Balances responsiveness with stability. Best for active intraday on 15m futures.
- 21 sessions: one calendar month. More stable baseline, fewer false-spike alerts. Slower to adapt to new regimes.
- 30–60 sessions: swing/positioning context. Very stable, very slow to update. Single high-impact event days (FOMC, CPI) linger in the average for weeks.
Rule of thumb: too many marginal spike alerts? Increase the lookback. Baseline feels stale after a vol regime change? Decrease it.
═══ ALERTS ═══
Two alert conditions, both useful:
1. "Volume spike" — fires when volume hits the spike threshold. Use for multi-symbol monitoring.
2. "Crossed session baseline" — fires when volume transitions from below to above the typical level (or vice versa). Quieter signal indicating regime change.
═══ HONEST LIMITATIONS ═══
- Does not predict direction. A spike with a green close is bullish confirmation; a spike with a red close is often capitulation or distribution. The indicator surfaces the conviction event; reading direction is on you.
- Does not work on symbols without volume. Most spot forex pairs on retail platforms report tick count, not volume. Use the equivalent futures contract (6E, 6J, 6B) for real volume analysis on forex.
- Needs history. On a fresh symbol with fewer sessions of historical bars than your lookback setting, the baseline averages whatever's available and may be choppy for the first few sessions.
- Not session-aware for time changes. DST transitions or holiday-shortened sessions in the lookback window will offset the baseline by a bar or two until they roll out of the average.
═══ WHY OPEN SOURCE ═══
Closed-source indicators in finance are a known yellow flag — they often do less than claimed or rely on lookahead bias to look better in backtests. Every line of this script is readable. Audit the math, fork it, modify it for your strategy. The math is straightforward by design.
═══ SETTINGS REFERENCE ═══
Acceleration lookback (bars): 12 default. How many recent bars feed spike detection. Use 20 for daily charts.
Spike threshold (× average): 2.5 default. How far above average a bar must be to get a label. Lower = more labels.
Baseline sessions to average: 14 default (range 5–60). See "Tuning the Lookback" above.
Bars per session: 0 (auto). See table above.
Spike label position: Four options.
- On bar (top) — text floats just inside the top of the orange bar
- On bar (middle) — text centered inside the bar
- On bar (bottom) — text sits at the base of the bar (DEFAULT)
- Below bar (pill) — legacy orange pill anchored below the bar
Spike label orientation: Two options.
- Vertical (stacked) — each character on its own line. Best for narrow bars on lower timeframes. DEFAULT.
- Horizontal — standard single-line text. Best for wider bars on higher timeframes or when bar width comfortably fits the ratio.
Position and orientation are independent — any of the four positions can use either orientation, giving you eight visual combinations.
Colors: Six configurable colors for bars, baseline, and labels.
═══════════════════════════════════════════════════════════════
Maintained by TrailingStopLoss.com — more free, open-source trading tools at trailingstoploss.com/tradingview-indicators
═══════════════════════════════════════════════════════════════
Disclaimer: This is an analytical tool that displays publicly available volume data with a time-of-day baseline overlay. It does not predict price direction or guarantee any trading outcome. Volume spikes can precede continuation, reversal, or no follow-through. Trading futures and equities involves substantial risk of loss. For educational purposes only.
Script open-source
Nello spirito di TradingView, l'autore di questo script lo ha reso open source, in modo che i trader possano esaminarne e verificarne la funzionalità. Complimenti all'autore! Sebbene sia possibile utilizzarlo gratuitamente, ricordiamo che la ripubblicazione del codice è soggetta al nostro Regolamento.

Declinazione di responsabilità
Le informazioni e le pubblicazioni non sono intese come, e non costituiscono, consulenza o raccomandazioni finanziarie, di investimento, di trading o di altro tipo fornite o approvate da TradingView. Per ulteriori informazioni, consultare i Termini di utilizzo.
Script open-source
Nello spirito di TradingView, l'autore di questo script lo ha reso open source, in modo che i trader possano esaminarne e verificarne la funzionalità. Complimenti all'autore! Sebbene sia possibile utilizzarlo gratuitamente, ricordiamo che la ripubblicazione del codice è soggetta al nostro Regolamento.
Declinazione di responsabilità
Le informazioni e le pubblicazioni non sono intese come, e non costituiscono, consulenza o raccomandazioni finanziarie, di investimento, di trading o di altro tipo fornite o approvate da TradingView. Per ulteriori informazioni, consultare i Termini di utilizzo.