Aggiornato
Behavioral Edge 3D [Neblok]
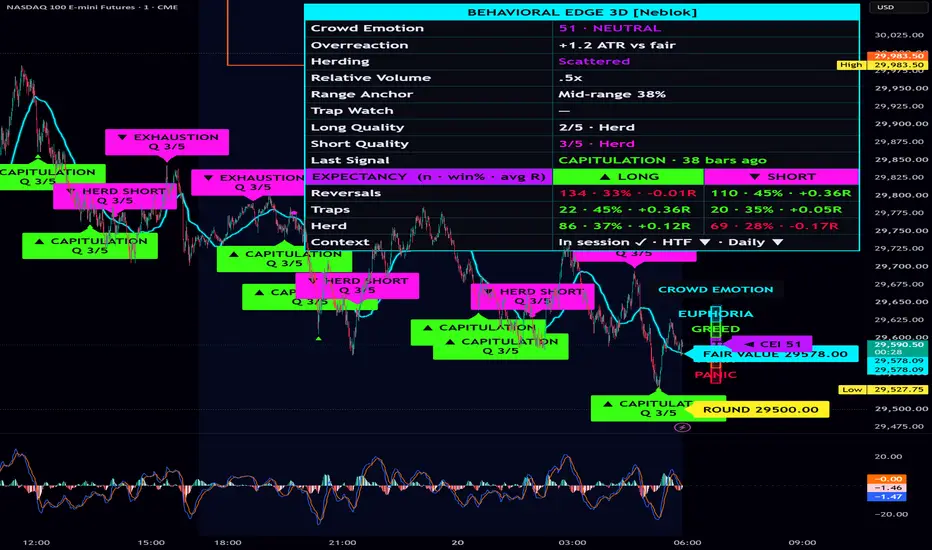
BEHAVIORAL EDGE 3D [Neblok]
Markets aren't moved by perfectly rational traders. They're moved by people who overreact, follow the herd, anchor to old prices, and panic-sell to stop the pain of a loss. Behavioral finance studies those mistakes, and this indicator turns that theory into a live, on-chart read of crowd emotion so you can spot when the crowd is most likely to be wrong.
------------------------------------------------------------
THE CROWD EMOTION INDEX (CEI 0-100)
------------------------------------------------------------
The core of the script blends five behavioral components into one score:
- Overreaction: how far price has stretched from the crowd's average cost (a volume-weighted fair value), measured in ATR.
- Momentum: how strongly price is pushing in one direction.
- Herding: whether bars are agreeing in direction on above-average volume, meaning everyone is piling in the same way.
- Panic / FOMO Thrust: the speed of the move. Fast drops read as panic, fast rips read as FOMO.
- Range Anchoring: where price sits versus the recent highs and lows the crowd remembers.
The CEI is grouped into five zones:
PANIC (below 15) | FEAR (15-35) | NEUTRAL (35-65) | GREED (65-85) | EUPHORIA (above 85)
Candles are colored by zone. Neutral candles keep your normal chart colors, so colored candles instantly tell you the crowd is emotional.
You can adjust the weight of each component and the zone thresholds in the Crowd Emotion Index settings.
------------------------------------------------------------
THE 3D CROWD EMOTION METER
------------------------------------------------------------
To the right of price you'll see a 3D meter stacked from PANIC at the bottom to EUPHORIA at the top. The active zone lights up solid, and the CEI pointer shows the exact reading at a glance.
If the meter is off screen, scroll the chart to the right. If labels touch the meter at your zoom level, raise "Meter offset" in the Visuals settings. You can also change the meter's width, height and 3D depth.
------------------------------------------------------------
SIGNALS
------------------------------------------------------------
Every signal is graded Q 1-5 for quality and confirms on bar close, so signals do not repaint. Hover over any signal label to see the CEI reading, relative volume and extension at the moment it fired.
CAPITULATION (long) / EXHAUSTION (short)
The crowd recently hit Fear or Greed and emotion is now turning. Quality points come from:
- A Panic or Euphoria extreme
- A volume climax
- A rejection candle
- Trapped traders nearby
- Emotion divergence (price makes a new extreme, but the crowd's emotion does not)
SELLERS TRAPPED (long) / BUYERS TRAPPED (short)
Price sweeps an anchored level (prior-day high/low or a recent swing high/low) and snaps back inside with a long wick. Traders who chased the breakout are now trapped, and their exits fuel the reversal.
HERD LONG / HERD SHORT
The CEI crosses the midline in the direction of the trend, on volume, before price is overextended. This catches the herd early instead of joining it late.
Each signal family can be turned on or off, and each has its own minimum quality setting.
------------------------------------------------------------
ANCHOR LEVELS
------------------------------------------------------------
- FAIR VALUE (neon glow line): the crowd's approximate average cost. Price far above it means the crowd is greedy and extended. Far below means the crowd is fearful.
- PDH / PDL: prior-day high and low on intraday charts, the levels traders anchor to most.
- ROUND numbers: the nearest psychological levels above and below price. Auto-sized, or set your own step.
------------------------------------------------------------
DASHBOARD
------------------------------------------------------------
- Crowd Emotion: current CEI and zone
- Overreaction: distance from fair value in ATR
- Herding: buying herd, selling herd, or scattered
- Relative Volume: current volume vs average, flags CLIMAX
- Range Anchor: where price sits in its recent range
- Trap Watch: whether buyers or sellers are currently trapped
- Long / Short Quality: the best setup score building on each side
- Last Signal: the most recent signal and how many bars ago
- Signal Expectancy: trade count, win rate and average R for Reversals, Traps and Herd signals on your loaded chart
------------------------------------------------------------
HOW TO USE IT
------------------------------------------------------------
1. Read the CEI zone first. Panic and Euphoria are where the crowd is most emotional and most often wrong.
2. Watch the Long and Short Quality rows on the dashboard. A score building toward 3-5 means a setup is forming before the signal fires.
3. Favor reversal and trap signals that form near anchor levels (Fair Value, PDH/PDL, Round numbers).
4. Favor higher quality scores. Q 4-5 setups have more behavioral evidence stacked behind them than Q 3.
5. Use Herd signals in trending markets, not choppy ranges.
6. Check the Signal Expectancy section before trusting any signal family on a new symbol or timeframe. If a family shows negative average R on your chart, turn it off or raise its minimum quality.
7. Plan your own stop and position size before entering. The expectancy stats use a hidden ATR-based stop and R-multiple target, which you can adjust in the Expectancy Stats settings.
------------------------------------------------------------
ALERTS
------------------------------------------------------------
For full-detail alerts, create an alert and choose "Any alert() function call." Each alert includes the signal name, direction, quality score, CEI reading, and reference entry, stop and target levels.
Individual alert conditions are also available for each signal type.
------------------------------------------------------------
SETTINGS TIPS
------------------------------------------------------------
- Too many signals: raise the minimum quality scores or the signal cooldown.
- Too few signals: lower the minimum quality scores or the volume climax multiplier.
- Faster markets / lower timeframes: try shorter lengths for the fair-value anchor and herding.
- All colors are adjustable in the Neon Colors section. Label and dashboard text can be set to Normal, Large or Huge.
------------------------------------------------------------
NOTES AND LIMITATIONS
------------------------------------------------------------
- Expectancy tracking holds one trade at a time, counts the stop first if the stop and target are both hit on the same bar, and does not include commissions or slippage. Treat it as a guide, not a full backtest.
- On symbols without volume data, fair value falls back to an EMA and volume-based quality points are unavailable.
- The 3D effect is drawn with layered boxes and lines, since TradingView does not support true 3D rendering.
------------------------------------------------------------
DISCLAIMER
------------------------------------------------------------
This script is provided for educational and informational purposes only and is not financial advice, investment advice, or a recommendation to buy or sell any security, futures contract, option or other instrument. No signal, score, statistic or level shown by this indicator guarantees any outcome. Past performance, including any expectancy figures displayed on the chart, does not guarantee future results.
Trading involves substantial risk of loss and is not suitable for every investor. Leveraged products such as futures and options can result in losses greater than your initial investment. Only trade with money you can afford to lose. Always do your own research, use proper risk management, and consult a licensed financial professional before making trading decisions. The author is not responsible for any losses incurred from the use of this script.
------------------------------------------------------------
TAGS
------------------------------------------------------------
behavioralfinance, sentiment, fearandgreed, crowdpsychology, capitulation, meanreversion, liquidity, volume, riskmanagement
Markets aren't moved by perfectly rational traders. They're moved by people who overreact, follow the herd, anchor to old prices, and panic-sell to stop the pain of a loss. Behavioral finance studies those mistakes, and this indicator turns that theory into a live, on-chart read of crowd emotion so you can spot when the crowd is most likely to be wrong.
------------------------------------------------------------
THE CROWD EMOTION INDEX (CEI 0-100)
------------------------------------------------------------
The core of the script blends five behavioral components into one score:
- Overreaction: how far price has stretched from the crowd's average cost (a volume-weighted fair value), measured in ATR.
- Momentum: how strongly price is pushing in one direction.
- Herding: whether bars are agreeing in direction on above-average volume, meaning everyone is piling in the same way.
- Panic / FOMO Thrust: the speed of the move. Fast drops read as panic, fast rips read as FOMO.
- Range Anchoring: where price sits versus the recent highs and lows the crowd remembers.
The CEI is grouped into five zones:
PANIC (below 15) | FEAR (15-35) | NEUTRAL (35-65) | GREED (65-85) | EUPHORIA (above 85)
Candles are colored by zone. Neutral candles keep your normal chart colors, so colored candles instantly tell you the crowd is emotional.
You can adjust the weight of each component and the zone thresholds in the Crowd Emotion Index settings.
------------------------------------------------------------
THE 3D CROWD EMOTION METER
------------------------------------------------------------
To the right of price you'll see a 3D meter stacked from PANIC at the bottom to EUPHORIA at the top. The active zone lights up solid, and the CEI pointer shows the exact reading at a glance.
If the meter is off screen, scroll the chart to the right. If labels touch the meter at your zoom level, raise "Meter offset" in the Visuals settings. You can also change the meter's width, height and 3D depth.
------------------------------------------------------------
SIGNALS
------------------------------------------------------------
Every signal is graded Q 1-5 for quality and confirms on bar close, so signals do not repaint. Hover over any signal label to see the CEI reading, relative volume and extension at the moment it fired.
CAPITULATION (long) / EXHAUSTION (short)
The crowd recently hit Fear or Greed and emotion is now turning. Quality points come from:
- A Panic or Euphoria extreme
- A volume climax
- A rejection candle
- Trapped traders nearby
- Emotion divergence (price makes a new extreme, but the crowd's emotion does not)
SELLERS TRAPPED (long) / BUYERS TRAPPED (short)
Price sweeps an anchored level (prior-day high/low or a recent swing high/low) and snaps back inside with a long wick. Traders who chased the breakout are now trapped, and their exits fuel the reversal.
HERD LONG / HERD SHORT
The CEI crosses the midline in the direction of the trend, on volume, before price is overextended. This catches the herd early instead of joining it late.
Each signal family can be turned on or off, and each has its own minimum quality setting.
------------------------------------------------------------
ANCHOR LEVELS
------------------------------------------------------------
- FAIR VALUE (neon glow line): the crowd's approximate average cost. Price far above it means the crowd is greedy and extended. Far below means the crowd is fearful.
- PDH / PDL: prior-day high and low on intraday charts, the levels traders anchor to most.
- ROUND numbers: the nearest psychological levels above and below price. Auto-sized, or set your own step.
------------------------------------------------------------
DASHBOARD
------------------------------------------------------------
- Crowd Emotion: current CEI and zone
- Overreaction: distance from fair value in ATR
- Herding: buying herd, selling herd, or scattered
- Relative Volume: current volume vs average, flags CLIMAX
- Range Anchor: where price sits in its recent range
- Trap Watch: whether buyers or sellers are currently trapped
- Long / Short Quality: the best setup score building on each side
- Last Signal: the most recent signal and how many bars ago
- Signal Expectancy: trade count, win rate and average R for Reversals, Traps and Herd signals on your loaded chart
------------------------------------------------------------
HOW TO USE IT
------------------------------------------------------------
1. Read the CEI zone first. Panic and Euphoria are where the crowd is most emotional and most often wrong.
2. Watch the Long and Short Quality rows on the dashboard. A score building toward 3-5 means a setup is forming before the signal fires.
3. Favor reversal and trap signals that form near anchor levels (Fair Value, PDH/PDL, Round numbers).
4. Favor higher quality scores. Q 4-5 setups have more behavioral evidence stacked behind them than Q 3.
5. Use Herd signals in trending markets, not choppy ranges.
6. Check the Signal Expectancy section before trusting any signal family on a new symbol or timeframe. If a family shows negative average R on your chart, turn it off or raise its minimum quality.
7. Plan your own stop and position size before entering. The expectancy stats use a hidden ATR-based stop and R-multiple target, which you can adjust in the Expectancy Stats settings.
------------------------------------------------------------
ALERTS
------------------------------------------------------------
For full-detail alerts, create an alert and choose "Any alert() function call." Each alert includes the signal name, direction, quality score, CEI reading, and reference entry, stop and target levels.
Individual alert conditions are also available for each signal type.
------------------------------------------------------------
SETTINGS TIPS
------------------------------------------------------------
- Too many signals: raise the minimum quality scores or the signal cooldown.
- Too few signals: lower the minimum quality scores or the volume climax multiplier.
- Faster markets / lower timeframes: try shorter lengths for the fair-value anchor and herding.
- All colors are adjustable in the Neon Colors section. Label and dashboard text can be set to Normal, Large or Huge.
------------------------------------------------------------
NOTES AND LIMITATIONS
------------------------------------------------------------
- Expectancy tracking holds one trade at a time, counts the stop first if the stop and target are both hit on the same bar, and does not include commissions or slippage. Treat it as a guide, not a full backtest.
- On symbols without volume data, fair value falls back to an EMA and volume-based quality points are unavailable.
- The 3D effect is drawn with layered boxes and lines, since TradingView does not support true 3D rendering.
------------------------------------------------------------
DISCLAIMER
------------------------------------------------------------
This script is provided for educational and informational purposes only and is not financial advice, investment advice, or a recommendation to buy or sell any security, futures contract, option or other instrument. No signal, score, statistic or level shown by this indicator guarantees any outcome. Past performance, including any expectancy figures displayed on the chart, does not guarantee future results.
Trading involves substantial risk of loss and is not suitable for every investor. Leveraged products such as futures and options can result in losses greater than your initial investment. Only trade with money you can afford to lose. Always do your own research, use proper risk management, and consult a licensed financial professional before making trading decisions. The author is not responsible for any losses incurred from the use of this script.
------------------------------------------------------------
TAGS
------------------------------------------------------------
behavioralfinance, sentiment, fearandgreed, crowdpsychology, capitulation, meanreversion, liquidity, volume, riskmanagement
Note di rilascio
BEHAVIORAL EDGE 3D [Neblok]Markets aren't moved by perfectly rational traders. They're moved by people who overreact, follow the herd, anchor to old prices, and panic-sell to stop the pain of a loss. This indicator turns behavioral finance into a live, on-chart read of crowd emotion so you can spot when the crowd is most likely to be wrong.
▶ WHAT'S NEW IN VERSION 2
On fast charts, v1 fired too many signals, some quality points counted conditions the signal already required, and the stats only tracked one trade at a time. v2 fixes all three:
• Cleaner chart: one label per signal, spaced at least 30 bars apart, plus a small marker on every signal. Cooldown raised to 10 bars.
• Honest quality scores: only evidence BEYOND what a signal requires counts. Reversals now also need a rejection candle.
• Context filters: signal session, reversals only at remembered levels, and herd signals with the higher-timeframe trend.
• Honest stats: every signal graded on its own, split LONG / SHORT, with a 1 ATR stop and a 60-bar time limit.
▶ CROWD EMOTION INDEX (CEI 0-100)
Five behavioral components blended into one score:
• Overreaction: distance from the crowd's average cost (volume-weighted fair value), in ATR
• Momentum: how hard price is pushing
• Herding: bars agreeing in direction on above-average volume
• Panic / FOMO Thrust: speed of the move
• Range Anchoring: where price sits vs the highs and lows the crowd remembers
Zones: PANIC <15 | FEAR 15-35 | NEUTRAL 35-65 | GREED 65-85 | EUPHORIA >85
Candles are colored by zone (neutral keeps your normal colors). Weights and thresholds are adjustable.
▶ 3D CROWD EMOTION METER
A 3D meter right of price, from PANIC to EUPHORIA, with the active zone lit and a CEI pointer. If it's off screen, scroll right. If labels touch it, raise "Meter offset."
▶ SIGNALS
Graded Q 0-5, confirmed on bar close (no repainting). Hover a label for the CEI, relative volume and extension when it fired.
CAPITULATION (long) / EXHAUSTION (short)
Requires: Fear/Greed recently, emotion turning, a rejection candle, and (by default) a remembered level.
Quality: Panic/Euphoria extreme, volume climax, trapped traders, emotion divergence, 2+ ATR overreaction.
SELLERS TRAPPED (long) / BUYERS TRAPPED (short)
Requires: a sweep of a prior-day or swing high/low that snaps back with a long wick and a rejection candle.
Quality: prior-day level swept, volume climax, crowd in Fear/Greed, 1+ ATR wick, higher-timeframe trend agrees.
HERD LONG / HERD SHORT
Requires: CEI crosses 50 with the trend (and, by default, the higher-timeframe trend).
Quality: above-average volume, strong herding, room to run, not at the range extreme, daily trend agrees.
Each family can be turned on/off with its own minimum quality.
▶ CONTEXT FILTERS
• Signal session: Regular hours, Custom, or Any time.
• Reversals only at a remembered level: within 0.5 ATR (adjustable) of a prior-day high/low, round number, or swing high/low.
• Herd needs the higher-timeframe trend (chart EMA + EMA on 4x your timeframe, completed bars only).
Futures note: TradingView treats the whole overnight session as "regular hours" on CME futures. For the NQ/ES day session, set Signal session to Custom 0830-1500 (Chicago time = 9:30-4:00 New York).
▶ ANCHOR LEVELS
• FAIR VALUE: the crowd's approximate average cost
• PDH / PDL: prior-day high and low (intraday)
• ROUND numbers: nearest psychological levels, auto-sized or custom
▶ DASHBOARD
Crowd Emotion, Overreaction, Herding, Relative Volume (flags CLIMAX), Range Anchor, Trap Watch, Long / Short Quality, Last Signal, Expectancy (n · win% · avg R for each family, split LONG / SHORT), and Context (session, higher-timeframe and daily trend).
▶ HOW TO USE IT
1. Read the CEI zone first. Panic and Euphoria are where the crowd is most often wrong.
2. Watch Long / Short Quality build toward 3-5 before a signal fires.
3. Favor Q 4-5 and signals at anchor levels.
4. Use Herd signals in trends, not chop.
5. Check Expectancy on each new symbol/timeframe, LONG and SHORT separately. Turn off or tighten any side showing negative average R.
6. Plan your own stop and size. The stats use a hidden ATR stop and R target (adjustable).
▶ NOTES
• Stats grade every signal with a hidden stop, target and time limit. If both stop and target hit on one bar, the stop counts. No commissions or slippage. A guide, not a full backtest.
• Without volume data, fair value uses an EMA and volume-based quality points are unavailable.
• 3D is drawn with layered boxes and lines.
▶ DISCLAIMER
For educational and informational purposes only. Not financial advice or a recommendation to buy or sell any instrument. No signal, score, statistic or level guarantees any outcome, and past performance, including expectancy figures shown on the chart, does not guarantee future results. Trading involves substantial risk of loss; leveraged products can lose more than your initial investment. Do your own research, use proper risk management, and consult a licensed professional before trading. The author is not responsible for any losses from using this script.
Note di rilascio
BEHAVIORAL EDGE 3D [Neblok]Markets aren't moved by perfectly rational traders. They're moved by people who overreact, follow the herd, anchor to old prices, and panic-sell to stop the pain of a loss. This indicator turns behavioral finance into a live, on-chart read of crowd emotion so you can spot when the crowd is most likely to be wrong.
▶ WHAT'S NEW IN VERSION 2
On fast charts, v1 fired too many signals, some quality points counted conditions the signal already required, and the stats only tracked one trade at a time. v2 fixes all three:
• Cleaner chart: one label per signal, spaced at least 30 bars apart, plus a small marker on every signal. Cooldown raised to 10 bars.
• Honest quality scores: only evidence BEYOND what a signal requires counts. Reversals now also need a rejection candle.
• Context filters: signal session, reversals only at remembered levels, and herd signals with the higher-timeframe trend.
• Honest stats: every signal graded on its own, split LONG / SHORT, with a 1 ATR stop and a 60-bar time limit.
▶ CROWD EMOTION INDEX (CEI 0-100)
Five behavioral components blended into one score:
• Overreaction: distance from the crowd's average cost (volume-weighted fair value), in ATR
• Momentum: how hard price is pushing
• Herding: bars agreeing in direction on above-average volume
• Panic / FOMO Thrust: speed of the move
• Range Anchoring: where price sits vs the highs and lows the crowd remembers
Zones: PANIC <15 | FEAR 15-35 | NEUTRAL 35-65 | GREED 65-85 | EUPHORIA >85
Candles are colored by zone (neutral keeps your normal colors). Weights and thresholds are adjustable.
▶ 3D CROWD EMOTION METER
A 3D meter right of price, from PANIC to EUPHORIA, with the active zone lit and a CEI pointer. If it's off screen, scroll right. If labels touch it, raise "Meter offset."
▶ SIGNALS
Graded Q 0-5, confirmed on bar close (no repainting). Hover a label for the CEI, relative volume and extension when it fired.
CAPITULATION (long) / EXHAUSTION (short)
Requires: Fear/Greed recently, emotion turning, a rejection candle, and (by default) a remembered level.
Quality: Panic/Euphoria extreme, volume climax, trapped traders, emotion divergence, 2+ ATR overreaction.
SELLERS TRAPPED (long) / BUYERS TRAPPED (short)
Requires: a sweep of a prior-day or swing high/low that snaps back with a long wick and a rejection candle.
Quality: prior-day level swept, volume climax, crowd in Fear/Greed, 1+ ATR wick, higher-timeframe trend agrees.
HERD LONG / HERD SHORT
Requires: CEI crosses 50 with the trend (and, by default, the higher-timeframe trend).
Quality: above-average volume, strong herding, room to run, not at the range extreme, daily trend agrees.
Each family can be turned on/off with its own minimum quality.
▶ CONTEXT FILTERS
• Signal session: Regular hours, Custom, or Any time.
• Reversals only at a remembered level: within 0.5 ATR (adjustable) of a prior-day high/low, round number, or swing high/low.
• Herd needs the higher-timeframe trend (chart EMA + EMA on 4x your timeframe, completed bars only).
Futures note: TradingView treats the whole overnight session as "regular hours" on CME futures. For the NQ/ES day session, set Signal session to Custom 0830-1500 (Chicago time = 9:30-4:00 New York).
▶ ANCHOR LEVELS
• FAIR VALUE: the crowd's approximate average cost
• PDH / PDL: prior-day high and low (intraday)
• ROUND numbers: nearest psychological levels, auto-sized or custom
▶ DASHBOARD
Crowd Emotion, Overreaction, Herding, Relative Volume (flags CLIMAX), Range Anchor, Trap Watch, Long / Short Quality, Last Signal, Expectancy (n · win% · avg R for each family, split LONG / SHORT), and Context (session, higher-timeframe and daily trend).
▶ HOW TO USE IT
1. Read the CEI zone first. Panic and Euphoria are where the crowd is most often wrong.
2. Watch Long / Short Quality build toward 3-5 before a signal fires.
3. Favor Q 4-5 and signals at anchor levels.
4. Use Herd signals in trends, not chop.
5. Check Expectancy on each new symbol/timeframe, LONG and SHORT separately. Turn off or tighten any side showing negative average R.
6. Plan your own stop and size. The stats use a hidden ATR stop and R target (adjustable).
▶ NOTES
• Stats grade every signal with a hidden stop, target and time limit. If both stop and target hit on one bar, the stop counts. No commissions or slippage. A guide, not a full backtest.
• Without volume data, fair value uses an EMA and volume-based quality points are unavailable.
• 3D is drawn with layered boxes and lines.
▶ DISCLAIMER
For educational and informational purposes only. Not financial advice or a recommendation to buy or sell any instrument. No signal, score, statistic or level guarantees any outcome, and past performance, including expectancy figures shown on the chart, does not guarantee future results. Trading involves substantial risk of loss; leveraged products can lose more than your initial investment. Do your own research, use proper risk management, and consult a licensed professional before trading. The author is not responsible for any losses from using this script.

Declinazione di responsabilità
Le informazioni e le pubblicazioni non sono intese come, e non costituiscono, consulenza o raccomandazioni finanziarie, di investimento, di trading o di altro tipo fornite o approvate da TradingView. Per ulteriori informazioni, consultare i Termini di utilizzo.
Declinazione di responsabilità
Le informazioni e le pubblicazioni non sono intese come, e non costituiscono, consulenza o raccomandazioni finanziarie, di investimento, di trading o di altro tipo fornite o approvate da TradingView. Per ulteriori informazioni, consultare i Termini di utilizzo.