Volume Elevation Map [AlgoNorth]
Volume Elevation Map
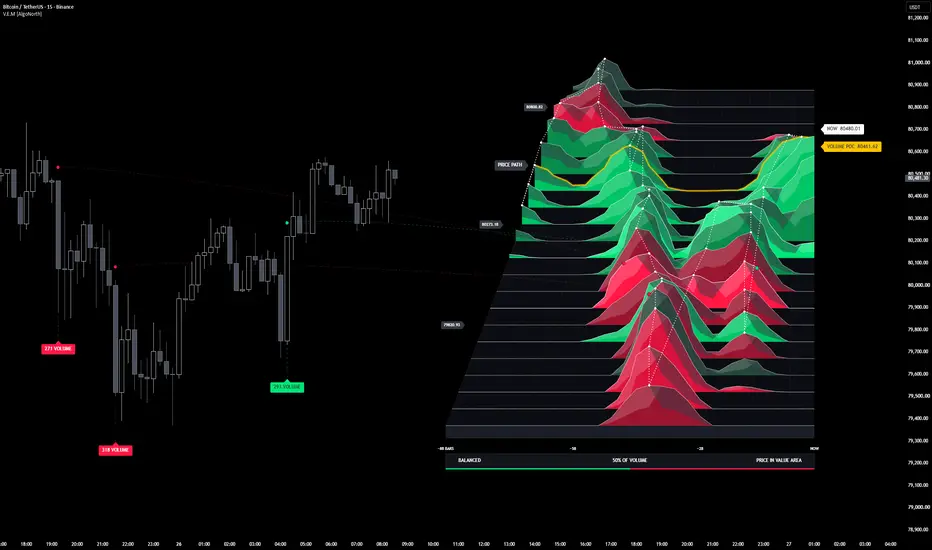
The market does not fight everywhere. Most of its volume trades at a handful of prices, in a handful of moments, and those are the fights that matter. Volume Elevation Map turns those fights into mountains. Over the last ninety candles, heavy volume rises into hills and light volume lies flat, so the busiest prices and moments stand out as peaks. Green hills are where buyers led and red hills where sellers led. A gold ridge traces the Volume POC, a white ridge tracks current price, and dashed lines tie the biggest-volume candles to their spot on the map. Below the map, a strip tells you which side traded more and where price sits against the value area.
🔶 USAGE
🔸 The map sits in the empty space to the right of price, but it shows history, not a forecast: everything on it comes from the last 90 bars. Rows run from the low of the last 90 bars at the front to their high at the back; slices run from the oldest bar on the left to NOW on the right, with each slice's age in bars ticked along the bottom.
🔸 Tall hills mark where the most trading happened at that price and time.
🔸 The gold ridge is the Volume POC, the price row that traded the most volume, with its price on the tag. The white ridge is the NOW row, the row of the last close.
🔸 Volume dots sit above the three highest-volume closed candles of the last 90 bars: green if the candle closed up, red if it closed down. A dashed thread runs from each dot to where that candle's volume sits on the map, and a call-out under the candle shows its volume.
🔸 The white dotted price path joins the hill summits in time order: a step back into the map means price moved up; a step forward means it moved down.
🔸 The verdict strip shows which side traded more of the last 90 bars' volume and that side's share, with the buy/sell split as a green/red edge underneath, and whether price is above, in or below the value area.
🔸 The map is about 85–90 bars wide with its tags at the default settings, so scroll the chart right, or raise the chart's right margin in Chart settings, to bring all of it into view.
🔶 DETAILS
🔸 Volume is read from intrabar candles. Each lower-timeframe bar's volume is placed at that bar's close, so the hills show where volume traded inside each candle. Auto picks the intrabar timeframe from the chart (1s for seconds charts, 1m up to 15m, 5m up to 1h, 15m up to 4h, 1h up to 1D, 4h up to 1W, 1D above), or you can set it yourself. A candle with no intrabar data places its whole volume at its middle.
🔸 The buy/sell split behind the row colours and the verdict is ESTIMATED: an intrabar's volume counts as buying if it closed up and selling if it closed down, and flat bars carry the previous direction. This is not bid/ask data.
🔸 Hill height is the volume traded in that price and time cell, per bar, blended with its neighbours in price and time by the smoothing passes, drawn on a softened scale so smaller hills stay visible. In the 3D angles, rows further back are drawn narrower and shorter. The same volume packed into a short burst stands taller than when it is spread across the 90 bars, so the Volume POC row need not have the tallest hill.
🔸 Row colour is which side's volume led at that price: dark, muted shades where the two sides are near even, deeper green or red for a small lead, and full bright green or red for the biggest leads on the map.
🔸 Volume dots go on the three highest-volume closed candles of the last 90 bars, at least 5 bars apart and never in the same time slice. Each candle's dot on the map sits in its own time slice, at the price row where most of its intrabar volume traded. Call-outs that would print over each other drop below one another instead.
🔸 The value area is the price rows holding up to 70% of the last 90 bars' volume, built out from the Volume POC row by adding whichever neighbouring row traded more, the way TradingView's volume profile builds it. Price is read against it by the NOW row.
🔸 The verdict follows the rounded split, so it can never contradict the share shown beside it, and an even 50/50 reads BALANCED.
🔸 The map is live. It is rebuilt from all 90 bars on every update, so the NOW row, the verdict and the hills move with the current candle, and the window slides forward as bars close.
🔶 SETTINGS
🔸 Volume data: intrabar timeframe (Auto or Manual) and the bars covered (20 to 400, default 90).
🔸 Elevation map: anchor (the covered bars' high–low range, or centred on price), price rows, time columns, column width, gap from the last bar, 3D angle (Perspective, Side view or Flat), elevation height, smoothing passes, price label spacing, the price path and the verdict strip.
🔸 On price: volume dots above candles, threads from the dots to the map, volume call-outs under candles, and a Volume POC band shaded across the candles.
🔸 Colours: buying volume, selling volume, Volume POC, and the ridges, frame and NOW tag.
🔶 NOTES
🔸 The buy/sell split is an estimate from intrabar candle direction, not bid/ask data, so the row colours and the verdict show a read of the volume, not the order flow itself. Hill heights and the volume dots are real volume.
🔸 The volume dots always point to the three biggest candles of the last 90 bars. As new candles close and the window moves forward, the dots move with it: a newer, bigger candle can take a dot, and a candle that leaves the window hands its dot on. A candle only gets a dot once it has closed. The Volume POC band follows the same window, shading today's POC across the candles behind it.
🔸 The map draws on standard candle and bar charts, where each candle's volume belongs to its own price range. On Heikin Ashi, Renko and other synthetic chart types it stops with a message instead of drawing a distorted map.
🔸 Forex and CFD symbols carry tick volume, so the map shows activity rather than contracts traded. A symbol with no volume shows NO VOLUME DATA.
🔸 Cells on the map's edges have fewer neighbours to blend with, so a burst in the first or last time column, or in the front or back row, stands a little taller than the same burst mid-map.
🔸 The map can only cover the bars the script is allowed to calculate. If TradingView's Calculated bars setting for the script is lower than the Bars covered setting, the map covers fewer bars, and with fewer than 20 it shows NEEDS 20 BARS instead.
🔸 The map's labels are sized for a chart where the last 90 bars fill most of the price scale. Zoomed far out, or with much larger older swings in view, they can crowd together; zooming in brings them back.
🔶 SUMMARY
The market does not fight everywhere, and Volume Elevation Map shows you where it did. The last 90 bars become a landscape of mountains, with the busiest prices and moments rising as peaks, coloured by which side led. The Volume POC and current price run as ridges, the biggest-volume candles are tied to their spot on the map, and a strip reads which side traded more and where price sits against the value area.
The market does not fight everywhere. Most of its volume trades at a handful of prices, in a handful of moments, and those are the fights that matter. Volume Elevation Map turns those fights into mountains. Over the last ninety candles, heavy volume rises into hills and light volume lies flat, so the busiest prices and moments stand out as peaks. Green hills are where buyers led and red hills where sellers led. A gold ridge traces the Volume POC, a white ridge tracks current price, and dashed lines tie the biggest-volume candles to their spot on the map. Below the map, a strip tells you which side traded more and where price sits against the value area.
🔶 USAGE
🔸 The map sits in the empty space to the right of price, but it shows history, not a forecast: everything on it comes from the last 90 bars. Rows run from the low of the last 90 bars at the front to their high at the back; slices run from the oldest bar on the left to NOW on the right, with each slice's age in bars ticked along the bottom.
🔸 Tall hills mark where the most trading happened at that price and time.
🔸 The gold ridge is the Volume POC, the price row that traded the most volume, with its price on the tag. The white ridge is the NOW row, the row of the last close.
🔸 Volume dots sit above the three highest-volume closed candles of the last 90 bars: green if the candle closed up, red if it closed down. A dashed thread runs from each dot to where that candle's volume sits on the map, and a call-out under the candle shows its volume.
🔸 The white dotted price path joins the hill summits in time order: a step back into the map means price moved up; a step forward means it moved down.
🔸 The verdict strip shows which side traded more of the last 90 bars' volume and that side's share, with the buy/sell split as a green/red edge underneath, and whether price is above, in or below the value area.
🔸 The map is about 85–90 bars wide with its tags at the default settings, so scroll the chart right, or raise the chart's right margin in Chart settings, to bring all of it into view.
🔶 DETAILS
🔸 Volume is read from intrabar candles. Each lower-timeframe bar's volume is placed at that bar's close, so the hills show where volume traded inside each candle. Auto picks the intrabar timeframe from the chart (1s for seconds charts, 1m up to 15m, 5m up to 1h, 15m up to 4h, 1h up to 1D, 4h up to 1W, 1D above), or you can set it yourself. A candle with no intrabar data places its whole volume at its middle.
🔸 The buy/sell split behind the row colours and the verdict is ESTIMATED: an intrabar's volume counts as buying if it closed up and selling if it closed down, and flat bars carry the previous direction. This is not bid/ask data.
🔸 Hill height is the volume traded in that price and time cell, per bar, blended with its neighbours in price and time by the smoothing passes, drawn on a softened scale so smaller hills stay visible. In the 3D angles, rows further back are drawn narrower and shorter. The same volume packed into a short burst stands taller than when it is spread across the 90 bars, so the Volume POC row need not have the tallest hill.
🔸 Row colour is which side's volume led at that price: dark, muted shades where the two sides are near even, deeper green or red for a small lead, and full bright green or red for the biggest leads on the map.
🔸 Volume dots go on the three highest-volume closed candles of the last 90 bars, at least 5 bars apart and never in the same time slice. Each candle's dot on the map sits in its own time slice, at the price row where most of its intrabar volume traded. Call-outs that would print over each other drop below one another instead.
🔸 The value area is the price rows holding up to 70% of the last 90 bars' volume, built out from the Volume POC row by adding whichever neighbouring row traded more, the way TradingView's volume profile builds it. Price is read against it by the NOW row.
🔸 The verdict follows the rounded split, so it can never contradict the share shown beside it, and an even 50/50 reads BALANCED.
🔸 The map is live. It is rebuilt from all 90 bars on every update, so the NOW row, the verdict and the hills move with the current candle, and the window slides forward as bars close.
🔶 SETTINGS
🔸 Volume data: intrabar timeframe (Auto or Manual) and the bars covered (20 to 400, default 90).
🔸 Elevation map: anchor (the covered bars' high–low range, or centred on price), price rows, time columns, column width, gap from the last bar, 3D angle (Perspective, Side view or Flat), elevation height, smoothing passes, price label spacing, the price path and the verdict strip.
🔸 On price: volume dots above candles, threads from the dots to the map, volume call-outs under candles, and a Volume POC band shaded across the candles.
🔸 Colours: buying volume, selling volume, Volume POC, and the ridges, frame and NOW tag.
🔶 NOTES
🔸 The buy/sell split is an estimate from intrabar candle direction, not bid/ask data, so the row colours and the verdict show a read of the volume, not the order flow itself. Hill heights and the volume dots are real volume.
🔸 The volume dots always point to the three biggest candles of the last 90 bars. As new candles close and the window moves forward, the dots move with it: a newer, bigger candle can take a dot, and a candle that leaves the window hands its dot on. A candle only gets a dot once it has closed. The Volume POC band follows the same window, shading today's POC across the candles behind it.
🔸 The map draws on standard candle and bar charts, where each candle's volume belongs to its own price range. On Heikin Ashi, Renko and other synthetic chart types it stops with a message instead of drawing a distorted map.
🔸 Forex and CFD symbols carry tick volume, so the map shows activity rather than contracts traded. A symbol with no volume shows NO VOLUME DATA.
🔸 Cells on the map's edges have fewer neighbours to blend with, so a burst in the first or last time column, or in the front or back row, stands a little taller than the same burst mid-map.
🔸 The map can only cover the bars the script is allowed to calculate. If TradingView's Calculated bars setting for the script is lower than the Bars covered setting, the map covers fewer bars, and with fewer than 20 it shows NEEDS 20 BARS instead.
🔸 The map's labels are sized for a chart where the last 90 bars fill most of the price scale. Zoomed far out, or with much larger older swings in view, they can crowd together; zooming in brings them back.
🔶 SUMMARY
The market does not fight everywhere, and Volume Elevation Map shows you where it did. The last 90 bars become a landscape of mountains, with the busiest prices and moments rising as peaks, coloured by which side led. The Volume POC and current price run as ridges, the biggest-volume candles are tied to their spot on the map, and a strip reads which side traded more and where price sits against the value area.

Declinazione di responsabilità
Le informazioni e le pubblicazioni non sono intese come, e non costituiscono, consulenza o raccomandazioni finanziarie, di investimento, di trading o di altro tipo fornite o approvate da TradingView. Per ulteriori informazioni, consultare i Termini di utilizzo.
Declinazione di responsabilità
Le informazioni e le pubblicazioni non sono intese come, e non costituiscono, consulenza o raccomandazioni finanziarie, di investimento, di trading o di altro tipo fornite o approvate da TradingView. Per ulteriori informazioni, consultare i Termini di utilizzo.