OPEN-SOURCE SCRIPT
Hosoda Wave Targets [UAlgo]
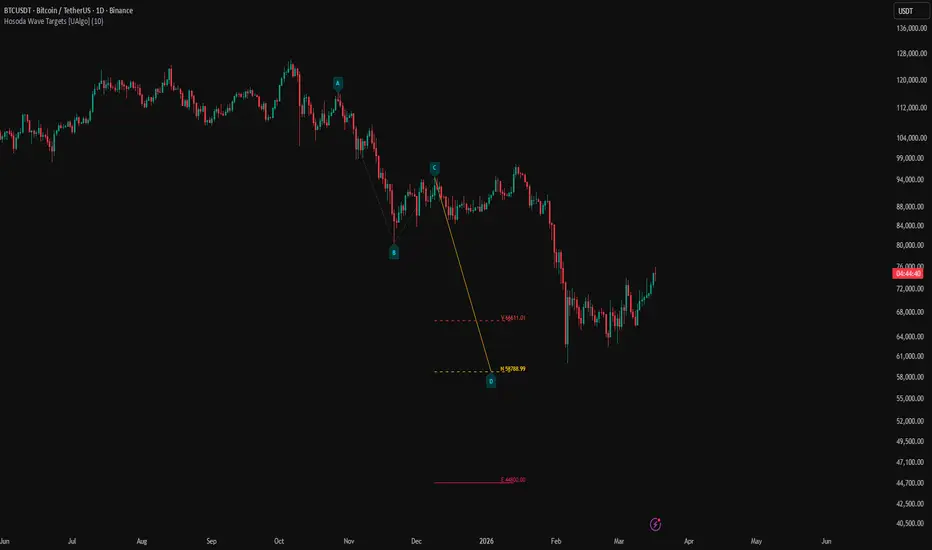
Hosoda Wave Targets is a wave projection tool inspired by the classical Hosoda target framework. The script identifies a three point swing structure using confirmed pivots, classifies that structure as either bullish or bearish, and then projects forward target levels from the completed A B C wave. Instead of drawing generic extension levels, it uses Hosoda style wave arithmetic to produce V, N, and E targets, while also calculating NT internally.
The logic begins with swing detection. Once the script has three valid pivots in sequence, it checks whether they form a proper bullish wave or bearish wave. A bullish wave requires a low, then a high, then a higher low. A bearish wave requires a high, then a low, then a lower high. If the structure is valid and does not overlap with the previous completed pattern, the script creates a new wave object and calculates its targets.
The visual output is built around the A B C D sequence. A, B, and C label the measured swing points, while D is placed at the projected N target time and price. The script also draws a dotted path for the original A to B and B to C legs, then projects the C to D path toward the N objective. In addition, horizontal V, N, and E target lines are plotted forward so the user can see the three main Hosoda price objectives at a glance.
This makes the indicator useful for traders who want a structured wave target model rather than a standard Fibonacci extension tool. Because the wave must pass a specific pivot sequence test before targets are shown, the script stays focused on clean swing structures instead of projecting from every random oscillation in price.
In practical use, Hosoda Wave Targets can help with wave mapping, objective placement, and scenario planning after a three point structure is completed. It works especially well as a framework for comparing potential continuation targets once a valid A B C sequence is already in place.
🔹 Features
🔸 Automatic A B C Wave Detection
The script continuously tracks confirmed pivot highs and pivot lows, then checks whether the latest three pivots form a valid bullish or bearish Hosoda wave structure.
🔸 Bullish and Bearish Pattern Recognition
A bullish structure requires a low, then a high, then a higher low.
A bearish structure requires a high, then a low, then a lower high.
This keeps the wave logic clear and directional.
🔸 Hosoda Style Price Targets
Once a valid wave is found, the script calculates classic Hosoda V, N, and E targets. It also computes the NT target internally as part of the target model.
🔸 Time Projection for D Point
The projected D point is placed using the Hosoda N time relationship. This means the script is not only projecting price, but also projecting where that objective sits in bar time.
🔸 Clear Wave Path Visualization
The A to B and B to C legs are drawn as dotted structural guides, while the C to D path toward the N target is drawn as the forward projection leg.
🔸 Color Coded Target Lines
V, N, and E targets are drawn with separate colors so the user can distinguish between the major Hosoda objectives quickly.
🔸 Last Wave Only Option
The script can either show only the most recent valid wave or keep multiple wave drawings on the chart, depending on the selected setting.
🔸 Overlap Protection
A new wave is only accepted when its first pivot does not overlap the prior completed pattern. This reduces repeated stacking of wave projections over the same structure.
🔹 Calculations
1) Defining the Core Data Objects
Pine Script®
This is the structural foundation of the indicator.
A Point stores one pivot with its bar index, price, and whether it is a high or low.
A HosodaTargets object stores the projected target values:
V,
N,
E,
NT,
an unused placeholder P,
and the projected time for the N target.
A Wave object stores the three actual swing points A, B, and C, along with the direction of the structure.
So before any drawing is done, the script already has a clear data model for pivots, waves, and targets.
2) Detecting Pivot Highs and Pivot Lows
Pine Script®
This is the pivot discovery step.
The script uses the selected pivot length on both the left and right side, which means a pivot is only confirmed after enough bars have passed. This avoids premature wave labeling on unconfirmed turning points.
When a pivot high is confirmed, it becomes a candidate high point. When a pivot low is confirmed, it becomes a candidate low point.
So the whole wave engine is built from confirmed swing structure rather than from temporary price fluctuations.
3) Storing Recent Pivot Points
Pine Script®
Once a pivot is confirmed, the script converts it into a Point object and stores it in the pivot array.
The true pivot bar is pivotLength bars in the past, so the script uses bar_index - pivotLength as the pivot location.
The pivot history is capped at ten points. This keeps the structure engine focused on recent swings and avoids unnecessary buildup of old pivots.
4) Building the Candidate A B C Structure
Pine Script®
This block selects the latest three stored pivots and treats them as a potential A B C sequence.
The script does not skip around the array looking for arbitrary combinations. It always evaluates the latest three pivots in sequence. That keeps the pattern logic straightforward and tied to the most recent confirmed structure.
So every wave begins as a direct test of the newest three pivot points.
5) Bullish Wave Validation
Pine Script®
This line defines the bullish Hosoda wave condition.
For a bullish structure:
A must be a low,
B must be a high,
C must be a low,
B must sit above both A and C,
and C must remain above A.
That last condition is important because it ensures the pullback at C is a higher low rather than a full structural failure.
So the script only accepts bullish waves that look like an advancing move followed by a constructive retracement.
6) Bearish Wave Validation
Pine Script®
This is the mirror condition for bearish waves.
For a bearish structure:
A must be a high,
B must be a low,
C must be a high,
B must sit below both A and C,
and C must remain below A.
This ensures the move represents a decline followed by a lower high retracement, which is the bearish counterpart of the bullish wave structure.
So the script only projects bearish targets when the A B C pattern shows proper downside sequence.
7) Preventing Pattern Overlap
Pine Script®
This is the overlap protection rule.
The script tracks the end of the previous completed pattern and requires the new A point to begin at or after that location. If the new structure starts inside the previous wave’s territory, it is ignored.
This reduces repetitive wave printing over the same swing area and keeps the output cleaner.
So the chart shows more distinct wave structures instead of heavily overlapping ones.
8) Assigning Wave Direction
Pine Script®
Once the script confirms that the latest three pivots form a valid structure, it assigns a direction:
1 for bullish,
-1 for bearish.
That direction then controls how the target formulas are calculated. So all later math depends on whether the wave is an advancing or declining structure.
9) Calculating the Hosoda Time Projection
Pine Script®
This is the time projection used for the D point and the N target.
The script measures the bar distance from A to B, then adds that same distance forward from C. That projected index becomes time_n.
So the wave does not only project price objectives. It also projects when the N objective would align in bar space according to the A to B rhythm.
10) Bullish V, N, E, and NT Target Formulas
Pine Script®
These are the bullish target formulas.
For bullish waves:
V projects the B to C distance upward from B.
N projects the A to B distance upward from C.
E projects the A to B distance upward from B.
NT projects the A to C distance upward from C.
Each target represents a different Hosoda style price relationship. The script calculates all four, although only V, N, and E are drawn visually in the current implementation.
So the script provides a full bullish target set, with one of the values kept internally for future expansion or interpretation.
11) Bearish V, N, E, and NT Target Formulas
Pine Script®
These are the bearish equivalents.
For bearish waves:
V projects the C to B distance downward from B.
N projects the A to B distance downward from C.
E projects the A to B distance downward from B.
NT projects the A to C distance downward from C.
So the same target families are preserved, but the math is reversed to match bearish structure.
12) Returning the Target Object
Pine Script®
After the formulas are calculated, the script packages them into a HosodaTargets object.
This makes it easy to pass all target information into the drawing method in one structured object.
Note that the p field is currently filled with 0.0 and is not used elsewhere in the script. So the active practical targets in this version are V, N, E, and the projected time index for N.
13) Drawing the A B C Labels
Pine Script®
These labels mark the confirmed swing points of the pattern.
Their placement style changes according to wave direction so the labels sit in a visually readable position relative to price.
So the user can immediately see the measured A B C structure before looking at any target levels.
14) Placing the Projected D Label
Pine Script®
The D label is placed at the projected N time and N price.
This does not mean D is a confirmed pivot. It is the projected completion point of the main wave objective according to the N relationship.
So D acts as a forward reference point, not a confirmed market event.
15) Drawing the Structural A to B and B to C Legs
Pine Script®
These two dotted lines draw the original measured wave.
They are not target lines. They simply show the actual A to B impulse and B to C correction that were used to build the projection.
So the user can visually separate measured structure from projected structure.
16) Drawing the C to D Projection Path
Pine Script®
This line connects the confirmed C pivot to the projected D point at the N target.
It visually represents the expected continuation path of the wave according to the N target model.
So the script does not leave the targets floating independently. It ties the projected move directly back to the completed C point.
17) Drawing the V, N, and E Target Lines
Pine Script®
These horizontal lines display the three visible price objectives.
V and N are drawn as dashed lines.
E is drawn as a solid line.
Each starts from the C area and extends forward beyond the projected D time. This makes it easier to compare the three target levels side by side.
It is worth noting that NT is calculated but not drawn in this version of the script. So the visible target framework here focuses on V, N, and E.
18) Drawing the Target Labels
Pine Script®
Each visible target line gets its own text label showing both the target family and the exact projected price.
This is useful because Hosoda targets often overlap or sit close to one another. The labels remove ambiguity and make it easy to read exact values directly from the chart.
19) Show Only Last Wave Mode
Pine Script®
This setting controls how much history remains visible.
If enabled, every time a new valid wave appears, all prior wave drawings are deleted first. That leaves only the most recent wave and its targets on the chart.
If disabled, multiple valid waves can remain visible.
So the user can choose between a clean single setup view or a historical wave map.
20) Clearing Old Drawings
Pine Script®
This cleanup method deletes every visual object associated with one stored wave drawing.
That includes:
the structural lines,
the projected line,
the point labels,
the target lines,
and the target labels.
So the indicator can safely remove prior patterns without leaving stale objects on the chart.
The logic begins with swing detection. Once the script has three valid pivots in sequence, it checks whether they form a proper bullish wave or bearish wave. A bullish wave requires a low, then a high, then a higher low. A bearish wave requires a high, then a low, then a lower high. If the structure is valid and does not overlap with the previous completed pattern, the script creates a new wave object and calculates its targets.
The visual output is built around the A B C D sequence. A, B, and C label the measured swing points, while D is placed at the projected N target time and price. The script also draws a dotted path for the original A to B and B to C legs, then projects the C to D path toward the N objective. In addition, horizontal V, N, and E target lines are plotted forward so the user can see the three main Hosoda price objectives at a glance.
This makes the indicator useful for traders who want a structured wave target model rather than a standard Fibonacci extension tool. Because the wave must pass a specific pivot sequence test before targets are shown, the script stays focused on clean swing structures instead of projecting from every random oscillation in price.
In practical use, Hosoda Wave Targets can help with wave mapping, objective placement, and scenario planning after a three point structure is completed. It works especially well as a framework for comparing potential continuation targets once a valid A B C sequence is already in place.
🔹 Features
🔸 Automatic A B C Wave Detection
The script continuously tracks confirmed pivot highs and pivot lows, then checks whether the latest three pivots form a valid bullish or bearish Hosoda wave structure.
🔸 Bullish and Bearish Pattern Recognition
A bullish structure requires a low, then a high, then a higher low.
A bearish structure requires a high, then a low, then a lower high.
This keeps the wave logic clear and directional.
🔸 Hosoda Style Price Targets
Once a valid wave is found, the script calculates classic Hosoda V, N, and E targets. It also computes the NT target internally as part of the target model.
🔸 Time Projection for D Point
The projected D point is placed using the Hosoda N time relationship. This means the script is not only projecting price, but also projecting where that objective sits in bar time.
🔸 Clear Wave Path Visualization
The A to B and B to C legs are drawn as dotted structural guides, while the C to D path toward the N target is drawn as the forward projection leg.
🔸 Color Coded Target Lines
V, N, and E targets are drawn with separate colors so the user can distinguish between the major Hosoda objectives quickly.
🔸 Last Wave Only Option
The script can either show only the most recent valid wave or keep multiple wave drawings on the chart, depending on the selected setting.
🔸 Overlap Protection
A new wave is only accepted when its first pivot does not overlap the prior completed pattern. This reduces repeated stacking of wave projections over the same structure.
🔹 Calculations
1) Defining the Core Data Objects
This is the structural foundation of the indicator.
A Point stores one pivot with its bar index, price, and whether it is a high or low.
A HosodaTargets object stores the projected target values:
V,
N,
E,
NT,
an unused placeholder P,
and the projected time for the N target.
A Wave object stores the three actual swing points A, B, and C, along with the direction of the structure.
So before any drawing is done, the script already has a clear data model for pivots, waves, and targets.
2) Detecting Pivot Highs and Pivot Lows
This is the pivot discovery step.
The script uses the selected pivot length on both the left and right side, which means a pivot is only confirmed after enough bars have passed. This avoids premature wave labeling on unconfirmed turning points.
When a pivot high is confirmed, it becomes a candidate high point. When a pivot low is confirmed, it becomes a candidate low point.
So the whole wave engine is built from confirmed swing structure rather than from temporary price fluctuations.
3) Storing Recent Pivot Points
Once a pivot is confirmed, the script converts it into a Point object and stores it in the pivot array.
The true pivot bar is pivotLength bars in the past, so the script uses bar_index - pivotLength as the pivot location.
The pivot history is capped at ten points. This keeps the structure engine focused on recent swings and avoids unnecessary buildup of old pivots.
4) Building the Candidate A B C Structure
This block selects the latest three stored pivots and treats them as a potential A B C sequence.
The script does not skip around the array looking for arbitrary combinations. It always evaluates the latest three pivots in sequence. That keeps the pattern logic straightforward and tied to the most recent confirmed structure.
So every wave begins as a direct test of the newest three pivot points.
5) Bullish Wave Validation
This line defines the bullish Hosoda wave condition.
For a bullish structure:
A must be a low,
B must be a high,
C must be a low,
B must sit above both A and C,
and C must remain above A.
That last condition is important because it ensures the pullback at C is a higher low rather than a full structural failure.
So the script only accepts bullish waves that look like an advancing move followed by a constructive retracement.
6) Bearish Wave Validation
This is the mirror condition for bearish waves.
For a bearish structure:
A must be a high,
B must be a low,
C must be a high,
B must sit below both A and C,
and C must remain below A.
This ensures the move represents a decline followed by a lower high retracement, which is the bearish counterpart of the bullish wave structure.
So the script only projects bearish targets when the A B C pattern shows proper downside sequence.
7) Preventing Pattern Overlap
This is the overlap protection rule.
The script tracks the end of the previous completed pattern and requires the new A point to begin at or after that location. If the new structure starts inside the previous wave’s territory, it is ignored.
This reduces repetitive wave printing over the same swing area and keeps the output cleaner.
So the chart shows more distinct wave structures instead of heavily overlapping ones.
8) Assigning Wave Direction
Once the script confirms that the latest three pivots form a valid structure, it assigns a direction:
1 for bullish,
-1 for bearish.
That direction then controls how the target formulas are calculated. So all later math depends on whether the wave is an advancing or declining structure.
9) Calculating the Hosoda Time Projection
This is the time projection used for the D point and the N target.
The script measures the bar distance from A to B, then adds that same distance forward from C. That projected index becomes time_n.
So the wave does not only project price objectives. It also projects when the N objective would align in bar space according to the A to B rhythm.
10) Bullish V, N, E, and NT Target Formulas
These are the bullish target formulas.
For bullish waves:
V projects the B to C distance upward from B.
N projects the A to B distance upward from C.
E projects the A to B distance upward from B.
NT projects the A to C distance upward from C.
Each target represents a different Hosoda style price relationship. The script calculates all four, although only V, N, and E are drawn visually in the current implementation.
So the script provides a full bullish target set, with one of the values kept internally for future expansion or interpretation.
11) Bearish V, N, E, and NT Target Formulas
These are the bearish equivalents.
For bearish waves:
V projects the C to B distance downward from B.
N projects the A to B distance downward from C.
E projects the A to B distance downward from B.
NT projects the A to C distance downward from C.
So the same target families are preserved, but the math is reversed to match bearish structure.
12) Returning the Target Object
After the formulas are calculated, the script packages them into a HosodaTargets object.
This makes it easy to pass all target information into the drawing method in one structured object.
Note that the p field is currently filled with 0.0 and is not used elsewhere in the script. So the active practical targets in this version are V, N, E, and the projected time index for N.
13) Drawing the A B C Labels
These labels mark the confirmed swing points of the pattern.
Their placement style changes according to wave direction so the labels sit in a visually readable position relative to price.
So the user can immediately see the measured A B C structure before looking at any target levels.
14) Placing the Projected D Label
The D label is placed at the projected N time and N price.
This does not mean D is a confirmed pivot. It is the projected completion point of the main wave objective according to the N relationship.
So D acts as a forward reference point, not a confirmed market event.
15) Drawing the Structural A to B and B to C Legs
These two dotted lines draw the original measured wave.
They are not target lines. They simply show the actual A to B impulse and B to C correction that were used to build the projection.
So the user can visually separate measured structure from projected structure.
16) Drawing the C to D Projection Path
This line connects the confirmed C pivot to the projected D point at the N target.
It visually represents the expected continuation path of the wave according to the N target model.
So the script does not leave the targets floating independently. It ties the projected move directly back to the completed C point.
17) Drawing the V, N, and E Target Lines
These horizontal lines display the three visible price objectives.
V and N are drawn as dashed lines.
E is drawn as a solid line.
Each starts from the C area and extends forward beyond the projected D time. This makes it easier to compare the three target levels side by side.
It is worth noting that NT is calculated but not drawn in this version of the script. So the visible target framework here focuses on V, N, and E.
18) Drawing the Target Labels
Each visible target line gets its own text label showing both the target family and the exact projected price.
This is useful because Hosoda targets often overlap or sit close to one another. The labels remove ambiguity and make it easy to read exact values directly from the chart.
19) Show Only Last Wave Mode
This setting controls how much history remains visible.
If enabled, every time a new valid wave appears, all prior wave drawings are deleted first. That leaves only the most recent wave and its targets on the chart.
If disabled, multiple valid waves can remain visible.
So the user can choose between a clean single setup view or a historical wave map.
20) Clearing Old Drawings
This cleanup method deletes every visual object associated with one stored wave drawing.
That includes:
the structural lines,
the projected line,
the point labels,
the target lines,
and the target labels.
So the indicator can safely remove prior patterns without leaving stale objects on the chart.
Script open-source
Nello spirito di TradingView, l'autore di questo script lo ha reso open source, in modo che i trader possano esaminarne e verificarne la funzionalità. Complimenti all'autore! Sebbene sia possibile utilizzarlo gratuitamente, ricordiamo che la ripubblicazione del codice è soggetta al nostro Regolamento.

Get exclusive indicators
All content provided by UAlgo is for informational & educational purposes only. Past performance does not guarantee future results.
All content provided by UAlgo is for informational & educational purposes only. Past performance does not guarantee future results.
Declinazione di responsabilità
Le informazioni e le pubblicazioni non sono intese come, e non costituiscono, consulenza o raccomandazioni finanziarie, di investimento, di trading o di altro tipo fornite o approvate da TradingView. Per ulteriori informazioni, consultare i Termini di utilizzo.
Script open-source
Nello spirito di TradingView, l'autore di questo script lo ha reso open source, in modo che i trader possano esaminarne e verificarne la funzionalità. Complimenti all'autore! Sebbene sia possibile utilizzarlo gratuitamente, ricordiamo che la ripubblicazione del codice è soggetta al nostro Regolamento.
Get exclusive indicators
All content provided by UAlgo is for informational & educational purposes only. Past performance does not guarantee future results.
All content provided by UAlgo is for informational & educational purposes only. Past performance does not guarantee future results.
Declinazione di responsabilità
Le informazioni e le pubblicazioni non sono intese come, e non costituiscono, consulenza o raccomandazioni finanziarie, di investimento, di trading o di altro tipo fornite o approvate da TradingView. Per ulteriori informazioni, consultare i Termini di utilizzo.