OPEN-SOURCE SCRIPT
SQVIGU Squeeze+ TSI Ghost
Description:
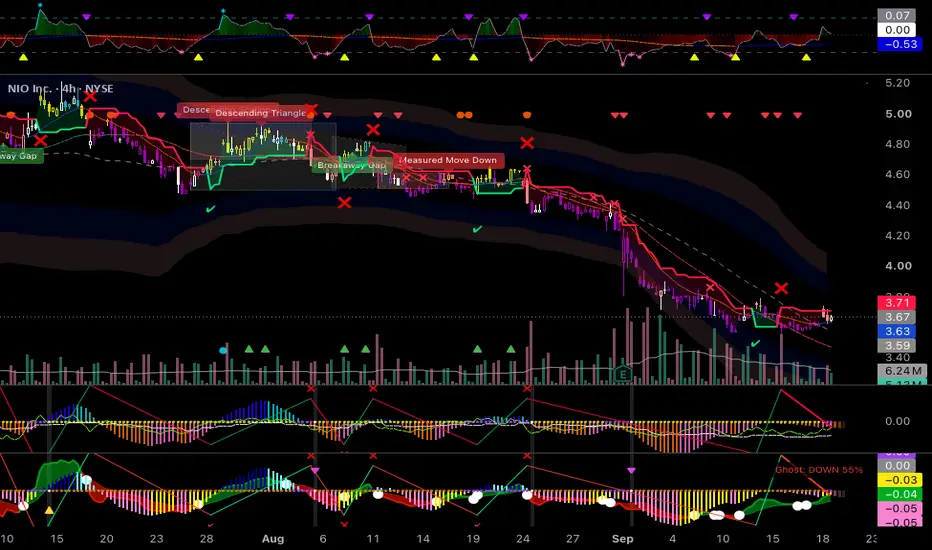
The SQVIGU Squeeze+ is an all-in-one momentum, trend, and projection indicator designed to keep your charts clean while delivering high-conviction signals. It upgrades the classic momentum squeeze by adding predictive "Ghost" projection bars, SuperTrend tracking, and a smooth, auto-scaling True Strength Index (TSI) Cloud Ribbon to confirm trend direction at a glance.
How to Use It:
The TSI Cloud Ribbon: The ribbon at the bottom of the indicator shows the broader trend. Light Blue means bullish momentum; Dark Blue means bearish. A bright White Dot appears exactly when the TSI crosses its signal line, indicating an optimal entry or momentum shift.
The Squeeze Dots (Zero Line): The dots on the zero line tell you when price is consolidating. Purple means the squeeze is building energy. White means the squeeze is firing (breakout). Yellow/Green means the squeeze is off.
Momentum Histogram & Ghost Bars: The classic red and green histogram shows current momentum. The slightly faded "Ghost" bars at the front project where momentum is heading 1 to 3 bars into the future based on linear regression.
SuperTrend Cloud & Zig-Zag: A Green (bullish) or Red (bearish) SuperTrend cloud will display on your main chart. Checkmarks (✔) indicate a confirmed trend cross, while Xs (❌) warn you of a likely false signal.
High-Probability Signals: Look for the tiny Yellow (Long) or Purple (Short) triangles on the top and bottom edges of the indicator pane. These only fire when a squeeze breakout perfectly aligns with a strong macro trend.
The SQVIGU Squeeze+ is an all-in-one momentum, trend, and projection indicator designed to keep your charts clean while delivering high-conviction signals. It upgrades the classic momentum squeeze by adding predictive "Ghost" projection bars, SuperTrend tracking, and a smooth, auto-scaling True Strength Index (TSI) Cloud Ribbon to confirm trend direction at a glance.
How to Use It:
The TSI Cloud Ribbon: The ribbon at the bottom of the indicator shows the broader trend. Light Blue means bullish momentum; Dark Blue means bearish. A bright White Dot appears exactly when the TSI crosses its signal line, indicating an optimal entry or momentum shift.
The Squeeze Dots (Zero Line): The dots on the zero line tell you when price is consolidating. Purple means the squeeze is building energy. White means the squeeze is firing (breakout). Yellow/Green means the squeeze is off.
Momentum Histogram & Ghost Bars: The classic red and green histogram shows current momentum. The slightly faded "Ghost" bars at the front project where momentum is heading 1 to 3 bars into the future based on linear regression.
SuperTrend Cloud & Zig-Zag: A Green (bullish) or Red (bearish) SuperTrend cloud will display on your main chart. Checkmarks (✔) indicate a confirmed trend cross, while Xs (❌) warn you of a likely false signal.
High-Probability Signals: Look for the tiny Yellow (Long) or Purple (Short) triangles on the top and bottom edges of the indicator pane. These only fire when a squeeze breakout perfectly aligns with a strong macro trend.
Script open-source
Nello spirito di TradingView, l'autore di questo script lo ha reso open source, in modo che i trader possano esaminarne e verificarne la funzionalità. Complimenti all'autore! Sebbene sia possibile utilizzarlo gratuitamente, ricordiamo che la ripubblicazione del codice è soggetta al nostro Regolamento.

Declinazione di responsabilità
Le informazioni e le pubblicazioni non sono intese come, e non costituiscono, consulenza o raccomandazioni finanziarie, di investimento, di trading o di altro tipo fornite o approvate da TradingView. Per ulteriori informazioni, consultare i Termini di utilizzo.
Script open-source
Nello spirito di TradingView, l'autore di questo script lo ha reso open source, in modo che i trader possano esaminarne e verificarne la funzionalità. Complimenti all'autore! Sebbene sia possibile utilizzarlo gratuitamente, ricordiamo che la ripubblicazione del codice è soggetta al nostro Regolamento.
Declinazione di responsabilità
Le informazioni e le pubblicazioni non sono intese come, e non costituiscono, consulenza o raccomandazioni finanziarie, di investimento, di trading o di altro tipo fornite o approvate da TradingView. Per ulteriori informazioni, consultare i Termini di utilizzo.