OPEN-SOURCE SCRIPT
Aggiornato AG Pro Volume Delta Imbalance Map [AGPro Series]
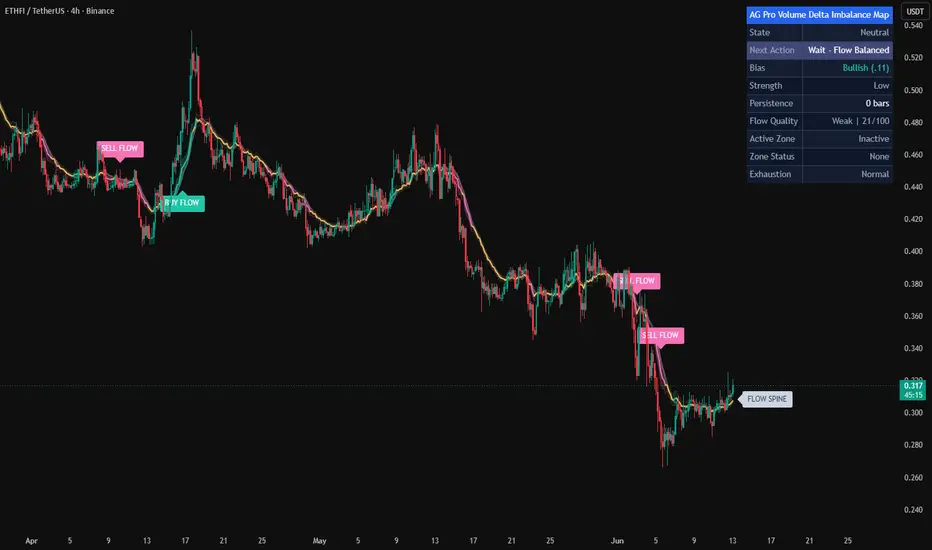
AG Pro Volume Delta Imbalance Map [AGPro Series]
OVERVIEW / WHAT IT DOES
AG Pro Volume Delta Imbalance Map is an overlay-style volume pressure tool designed to visualize directional participation asymmetry directly on the price chart. Instead of presenting volume as a standalone histogram or reducing the analysis to a single cumulative line, this script maps estimated directional imbalance into a chart-native structure built around a basis line, a flow spine, and an adaptive ribbon. The result is a cleaner view of whether recent participation is leaning bullish, bearish, or balanced, while keeping the analysis anchored to actual price movement.
The script is built for traders who want a more visual interpretation of directional volume pressure without relying on a separate lower-pane oscillator. The main purpose is not to predict tops, bottoms, or reversals in isolation. Its role is to help users read where directional pressure is expanding, where it is fading, and where the current state remains neutral or low-conviction. By placing the analysis directly on the chart, the script aims to make flow conditions easier to compare with market structure, pullbacks, trend continuation attempts, and local regime shifts.
A key design objective of this script is practical readability. Many volume-based tools either become too abstract for quick chart work or too visually dense to remain useful during live decision-making. Here, the imbalance model is translated into a compact overlay with a smoothed directional spine, a ribbon that adapts to pressure intensity, optional burst labels, optional zone-start labels, and a summary panel that reports the current state, bias, strength, persistence, label mode, and exhaustion condition. This keeps the output interpretable across multiple markets and timeframes without forcing the user to decode a complicated dashboard.
This script should be understood as a directional-volume map, not as a trade automation engine. It is intended to support chart reading, context building, and workflow discipline. It can help highlight when directional participation is broadening, when pressure alignment is improving, or when a previously strong move begins to lose quality. Those observations can then be combined with price structure, support and resistance, volatility context, and the user’s own execution framework.
UNIQUE EDGE
The main differentiator of this script is that it does not approach volume pressure in the same way as classic cumulative-flow or oscillator-style tools. Traditional cumulative tools such as OBV compress volume behavior into a running line, while money-flow oscillators often frame the analysis around momentum-style expansion and contraction in a lower pane. AG Pro Volume Delta Imbalance Map takes a different route: it transforms estimated directional pressure into an on-chart flow structure that is designed to be read alongside candles, pullbacks, transitions, and continuation attempts.
Another differentiating element is the emphasis on flow state rather than raw volume magnitude alone. The script is not simply asking whether volume is high or low. It is asking whether directional participation is leaning to one side strongly enough to create an interpretable imbalance state, whether that pressure is stabilizing or intensifying, and whether that condition is durable enough to remain relevant across several bars. This creates a more structural view of participation rather than a purely reactive one.
The visual architecture is also intentionally distinct. The flow ribbon is not only cosmetic. It is designed to express directional pressure breadth around the spine, while the spine itself provides a simpler anchor for the prevailing flow direction. Optional labels then mark either stronger burst moments or the beginning of a new directional zone, depending on user preference. This allows the script to serve different chart-reading styles without changing the core methodology.
Finally, transparency matters. This script does not claim to be a true bid/ask footprint, a tape-reading engine, or an exact institutional order-flow detector. It uses an estimated directional-volume proxy derived from price-location and candle-structure behavior. That distinction is important. The objective is to provide a disciplined, readable directional-pressure framework within the constraints of standard chart data, not to imply access to information the script does not use.
METHODOLOGY
The model begins with a directional-pressure proxy built from three components: close location within the bar, candle body dominance relative to the full range, and directional sign reinforcement from candle structure. These inputs are blended into a bounded hybrid bias value intended to estimate whether recent volume participation was more likely to have leaned bullish or bearish within the bar. That estimate is then scaled by the bar’s volume to produce directional volume estimates and a delta-style imbalance reading.
The raw imbalance is normalized using a volume baseline so that the output remains more comparable across changing participation environments. The normalized value is then smoothed to reduce excessive noise and to create a more usable state engine. From there, bullish, bearish, and balanced conditions are determined through explicit thresholds. This means the displayed state is not arbitrary. It is driven by a consistent threshold structure that helps separate neutral conditions from more meaningful directional pressure.
The chart overlay is built around three visual elements. First, a basis line offers a stable reference. Second, the flow spine tracks the smoothed imbalance state translated onto price space. Third, an adaptive ribbon expands or contracts around the spine based on imbalance strength, which helps communicate whether directional participation is broadening or losing intensity. Together, these components aim to make flow conditions visible without overwhelming the chart.
The script also tracks persistence and a simplified exhaustion heuristic. Persistence reflects how long the current directional state has remained in force, while exhaustion attempts to highlight cases where imbalance remains strong but starts to weaken while price response underperforms. This is not a reversal guarantee. It is a contextual warning that a previously forceful participation state may be losing efficiency.
SIGNALS & ALERTS
The script can label directional events in two different styles. In Burst Labels mode, labels are reserved for stronger acceleration moments inside an existing directional condition. In Zone Start Labels mode, labels are printed when a new directional zone begins. This distinction matters because some traders prefer confirmation after pressure expansion, while others prefer earlier visual markers at the start of a state change.
Bullish and bearish imbalance burst alerts are available for users who want notification when directional pressure expands beyond the relevant threshold. These alerts are best interpreted as flow acceleration events, not standalone entry signals. In practice, many users will prefer to combine them with local structure, pullback quality, reclaim behavior, or continuation context.
The script also includes bias reversal alerts and imbalance strength expansion alerts. These are useful for monitoring whether a previously balanced or opposing environment is transitioning into a new directional condition, or whether an already active imbalance is strengthening enough to deserve attention. The summary panel helps reinforce these changes by showing state, bias, strength, persistence, label mode, and exhaustion status in a compact format.
A separate exhaustion-risk alert is provided for conditions where the model detects that a strong imbalance may be fading in quality. This should be interpreted as a caution flag, not as a direct call to reverse or exit automatically. In many workflows, it is more useful as a prompt to reassess the context, tighten risk discipline, or watch for weakening continuation quality.
KEY INPUTS
Normalization Lookback controls the volume baseline used in the imbalance normalization process. Larger values can stabilize the model, while smaller values can make the output more reactive. Imbalance Smoothing influences how quickly the directional state responds to changing pressure. Shorter smoothing reacts faster but may increase noise, while longer smoothing can improve stability at the cost of responsiveness.
Map Basis EMA Length affects the visual anchor used for the overlay. ATR Length and Spine ATR Multiplier influence how the spine is translated into price space and how the ribbon behaves around it. Flow Ribbon Width controls the breadth of the visible pressure corridor, while Bull Flow Width Boost allows the bullish side to be widened slightly for visual emphasis when appropriate.
Bullish and Bearish Imbalance Thresholds define when the script considers directional pressure strong enough to move out of the balanced state. Burst Threshold determines when the model treats a move as a more meaningful acceleration event. Extreme Threshold contributes to the exhaustion logic and strength classification. Users can also choose whether labels represent burst moments or zone starts, depending on how early or selective they want the chart annotations to be.
Visual controls allow users to show or hide the basis line, flow ribbon, spine glow, backdrop, burst labels, exhaustion labels, spine tag, and panel. Panel position, panel theme, text sizing, label sizing, and offset controls are included so that the script can be adapted to different chart layouts and personal reading preferences without changing the underlying methodology.
LIMITATIONS & TRANSPARENCY
This script uses an estimated directional-volume model. It does not use order-book data, footprint data, bid/ask tape data, or exchange-level aggressor classification. As a result, the displayed imbalance should be understood as a chart-based directional proxy, not as an exact measurement of true traded delta.
Because the model relies on price-location and candle-structure inputs, the output can behave differently across instruments with different volatility profiles, gap behavior, liquidity conditions, and session structures. It is normal for a setting that looks well balanced on one asset or timeframe to require refinement on another. Users should expect to tune thresholds and visual parameters when moving between markets.
Signals and labels are contextual. A bullish label inside a weak range environment does not carry the same meaning as a bullish label that appears after a reclaim, a pullback stabilization, or a clean continuation structure. Likewise, a bearish label during highly erratic volatility may be less reliable than a similar reading inside a smoother directional sequence. The script is designed to assist interpretation, not to replace it.
No single output from this script should be treated as a guaranteed trade trigger, reversal call, or risk-management rule. The panel, ribbon, spine, and labels are tools for reading participation conditions. They are most useful when integrated with broader chart context, including trend structure, invalidation logic, nearby levels, liquidity conditions, and the user’s own process.
RISK DISCLOSURE
This script is for chart analysis and educational use. It does not provide financial advice, portfolio advice, or guaranteed trade outcomes. All trading and investing involve risk, including the risk of loss. Past market behavior and prior indicator responses do not guarantee future results.
Users remain fully responsible for how they interpret and apply the script. Any signal, label, or state reading should be evaluated within a complete decision process that includes market context, risk definition, and position management. This script should not be used as the sole basis for entering, exiting, or sizing a trade.
If you use this tool in live market conditions, it is sensible to test it across different assets and timeframes and to confirm that its behavior matches your own execution logic before relying on it in a real-money workflow.
OVERVIEW / WHAT IT DOES
AG Pro Volume Delta Imbalance Map is an overlay-style volume pressure tool designed to visualize directional participation asymmetry directly on the price chart. Instead of presenting volume as a standalone histogram or reducing the analysis to a single cumulative line, this script maps estimated directional imbalance into a chart-native structure built around a basis line, a flow spine, and an adaptive ribbon. The result is a cleaner view of whether recent participation is leaning bullish, bearish, or balanced, while keeping the analysis anchored to actual price movement.
The script is built for traders who want a more visual interpretation of directional volume pressure without relying on a separate lower-pane oscillator. The main purpose is not to predict tops, bottoms, or reversals in isolation. Its role is to help users read where directional pressure is expanding, where it is fading, and where the current state remains neutral or low-conviction. By placing the analysis directly on the chart, the script aims to make flow conditions easier to compare with market structure, pullbacks, trend continuation attempts, and local regime shifts.
A key design objective of this script is practical readability. Many volume-based tools either become too abstract for quick chart work or too visually dense to remain useful during live decision-making. Here, the imbalance model is translated into a compact overlay with a smoothed directional spine, a ribbon that adapts to pressure intensity, optional burst labels, optional zone-start labels, and a summary panel that reports the current state, bias, strength, persistence, label mode, and exhaustion condition. This keeps the output interpretable across multiple markets and timeframes without forcing the user to decode a complicated dashboard.
This script should be understood as a directional-volume map, not as a trade automation engine. It is intended to support chart reading, context building, and workflow discipline. It can help highlight when directional participation is broadening, when pressure alignment is improving, or when a previously strong move begins to lose quality. Those observations can then be combined with price structure, support and resistance, volatility context, and the user’s own execution framework.
UNIQUE EDGE
The main differentiator of this script is that it does not approach volume pressure in the same way as classic cumulative-flow or oscillator-style tools. Traditional cumulative tools such as OBV compress volume behavior into a running line, while money-flow oscillators often frame the analysis around momentum-style expansion and contraction in a lower pane. AG Pro Volume Delta Imbalance Map takes a different route: it transforms estimated directional pressure into an on-chart flow structure that is designed to be read alongside candles, pullbacks, transitions, and continuation attempts.
Another differentiating element is the emphasis on flow state rather than raw volume magnitude alone. The script is not simply asking whether volume is high or low. It is asking whether directional participation is leaning to one side strongly enough to create an interpretable imbalance state, whether that pressure is stabilizing or intensifying, and whether that condition is durable enough to remain relevant across several bars. This creates a more structural view of participation rather than a purely reactive one.
The visual architecture is also intentionally distinct. The flow ribbon is not only cosmetic. It is designed to express directional pressure breadth around the spine, while the spine itself provides a simpler anchor for the prevailing flow direction. Optional labels then mark either stronger burst moments or the beginning of a new directional zone, depending on user preference. This allows the script to serve different chart-reading styles without changing the core methodology.
Finally, transparency matters. This script does not claim to be a true bid/ask footprint, a tape-reading engine, or an exact institutional order-flow detector. It uses an estimated directional-volume proxy derived from price-location and candle-structure behavior. That distinction is important. The objective is to provide a disciplined, readable directional-pressure framework within the constraints of standard chart data, not to imply access to information the script does not use.
METHODOLOGY
The model begins with a directional-pressure proxy built from three components: close location within the bar, candle body dominance relative to the full range, and directional sign reinforcement from candle structure. These inputs are blended into a bounded hybrid bias value intended to estimate whether recent volume participation was more likely to have leaned bullish or bearish within the bar. That estimate is then scaled by the bar’s volume to produce directional volume estimates and a delta-style imbalance reading.
The raw imbalance is normalized using a volume baseline so that the output remains more comparable across changing participation environments. The normalized value is then smoothed to reduce excessive noise and to create a more usable state engine. From there, bullish, bearish, and balanced conditions are determined through explicit thresholds. This means the displayed state is not arbitrary. It is driven by a consistent threshold structure that helps separate neutral conditions from more meaningful directional pressure.
The chart overlay is built around three visual elements. First, a basis line offers a stable reference. Second, the flow spine tracks the smoothed imbalance state translated onto price space. Third, an adaptive ribbon expands or contracts around the spine based on imbalance strength, which helps communicate whether directional participation is broadening or losing intensity. Together, these components aim to make flow conditions visible without overwhelming the chart.
The script also tracks persistence and a simplified exhaustion heuristic. Persistence reflects how long the current directional state has remained in force, while exhaustion attempts to highlight cases where imbalance remains strong but starts to weaken while price response underperforms. This is not a reversal guarantee. It is a contextual warning that a previously forceful participation state may be losing efficiency.
SIGNALS & ALERTS
The script can label directional events in two different styles. In Burst Labels mode, labels are reserved for stronger acceleration moments inside an existing directional condition. In Zone Start Labels mode, labels are printed when a new directional zone begins. This distinction matters because some traders prefer confirmation after pressure expansion, while others prefer earlier visual markers at the start of a state change.
Bullish and bearish imbalance burst alerts are available for users who want notification when directional pressure expands beyond the relevant threshold. These alerts are best interpreted as flow acceleration events, not standalone entry signals. In practice, many users will prefer to combine them with local structure, pullback quality, reclaim behavior, or continuation context.
The script also includes bias reversal alerts and imbalance strength expansion alerts. These are useful for monitoring whether a previously balanced or opposing environment is transitioning into a new directional condition, or whether an already active imbalance is strengthening enough to deserve attention. The summary panel helps reinforce these changes by showing state, bias, strength, persistence, label mode, and exhaustion status in a compact format.
A separate exhaustion-risk alert is provided for conditions where the model detects that a strong imbalance may be fading in quality. This should be interpreted as a caution flag, not as a direct call to reverse or exit automatically. In many workflows, it is more useful as a prompt to reassess the context, tighten risk discipline, or watch for weakening continuation quality.
KEY INPUTS
Normalization Lookback controls the volume baseline used in the imbalance normalization process. Larger values can stabilize the model, while smaller values can make the output more reactive. Imbalance Smoothing influences how quickly the directional state responds to changing pressure. Shorter smoothing reacts faster but may increase noise, while longer smoothing can improve stability at the cost of responsiveness.
Map Basis EMA Length affects the visual anchor used for the overlay. ATR Length and Spine ATR Multiplier influence how the spine is translated into price space and how the ribbon behaves around it. Flow Ribbon Width controls the breadth of the visible pressure corridor, while Bull Flow Width Boost allows the bullish side to be widened slightly for visual emphasis when appropriate.
Bullish and Bearish Imbalance Thresholds define when the script considers directional pressure strong enough to move out of the balanced state. Burst Threshold determines when the model treats a move as a more meaningful acceleration event. Extreme Threshold contributes to the exhaustion logic and strength classification. Users can also choose whether labels represent burst moments or zone starts, depending on how early or selective they want the chart annotations to be.
Visual controls allow users to show or hide the basis line, flow ribbon, spine glow, backdrop, burst labels, exhaustion labels, spine tag, and panel. Panel position, panel theme, text sizing, label sizing, and offset controls are included so that the script can be adapted to different chart layouts and personal reading preferences without changing the underlying methodology.
LIMITATIONS & TRANSPARENCY
This script uses an estimated directional-volume model. It does not use order-book data, footprint data, bid/ask tape data, or exchange-level aggressor classification. As a result, the displayed imbalance should be understood as a chart-based directional proxy, not as an exact measurement of true traded delta.
Because the model relies on price-location and candle-structure inputs, the output can behave differently across instruments with different volatility profiles, gap behavior, liquidity conditions, and session structures. It is normal for a setting that looks well balanced on one asset or timeframe to require refinement on another. Users should expect to tune thresholds and visual parameters when moving between markets.
Signals and labels are contextual. A bullish label inside a weak range environment does not carry the same meaning as a bullish label that appears after a reclaim, a pullback stabilization, or a clean continuation structure. Likewise, a bearish label during highly erratic volatility may be less reliable than a similar reading inside a smoother directional sequence. The script is designed to assist interpretation, not to replace it.
No single output from this script should be treated as a guaranteed trade trigger, reversal call, or risk-management rule. The panel, ribbon, spine, and labels are tools for reading participation conditions. They are most useful when integrated with broader chart context, including trend structure, invalidation logic, nearby levels, liquidity conditions, and the user’s own process.
RISK DISCLOSURE
This script is for chart analysis and educational use. It does not provide financial advice, portfolio advice, or guaranteed trade outcomes. All trading and investing involve risk, including the risk of loss. Past market behavior and prior indicator responses do not guarantee future results.
Users remain fully responsible for how they interpret and apply the script. Any signal, label, or state reading should be evaluated within a complete decision process that includes market context, risk definition, and position management. This script should not be used as the sole basis for entering, exiting, or sizing a trade.
If you use this tool in live market conditions, it is sensible to test it across different assets and timeframes and to confirm that its behavior matches your own execution logic before relying on it in a real-money workflow.
Note di rilascio
Update Notes - V1.2This update focuses on presentation clarity, panel consistency, and cleaner state communication while preserving the core logic of the script.
What changed
- Refined the visual balance of the flow map so the ribbon and glow remain visible without overpowering price candles.
- Standardized the summary panel header into the single-row AG Pro format with a blue title bar.
- Set the panel default text size to Small for a cleaner compact layout.
- Kept label defaults aligned with the current visual system for better chart readability.
- Improved panel wording by replacing the previous balanced-style state wording with a cleaner neutral state presentation.
- Refined the Flow Quality row formatting for a more readable and structured summary display.
- Softened the spine glow slightly to reduce visual weight while preserving directional context.
- Kept the FLOW SPINE tag structure intact for continuity and chart recognition.
Practical result
- Cleaner chart presentation
- Better panel readability
- Reduced visual conflict between overlay elements and candles
- More consistent summary interpretation at a glance
Notes
This update is a visual and usability refinement. It does not represent a promise of predictive accuracy, profitability, or future market performance. The script remains an analytical overlay designed to help users monitor flow imbalance conditions in context.
Note di rilascio
Update Notes - V1.4This follow-up update restores on-chart flow event labels in a more controlled way while keeping the overlay clean and readable.
What changed
- Restored BUY FLOW and SELL FLOW event labels to improve visual event recognition on the chart.
- Reworked label filtering so labels appear more selectively instead of clustering too often.
- Adjusted label placement to keep event markers closer to price structure and reduce excessive distance from candles.
- Preserved the cleaner panel structure and refined overlay styling introduced in the prior update.
- Kept the chart presentation balanced so event labeling adds context without overwhelming the map.
Practical result
- Better event visibility
- More balanced label frequency
- Improved chart readability
- Cleaner interaction between labels, ribbon structure, and price candles
Notes
This update is focused on chart communication and usability refinement. The script remains an analytical tool for monitoring estimated volume delta imbalance behavior in context. It is not a prediction model, trading system, or guarantee of future results.
Note di rilascio
Update Notes - V2.0This update gives Volume Delta Imbalance Map a stronger visual identity and a more structured chart-reading workflow while preserving the script's original directional volume pressure concept.
The biggest change is the addition of Flow Memory Zones. Instead of relying only on the flow spine and adaptive ribbon to communicate state, the script can now project a qualified directional memory zone after a strong bullish or bearish imbalance transition. This helps users identify where directional participation first stabilized, which makes the chart easier to read during both continuation and retest conditions.
What changed
- Removed the AG Pro prefix from the published script title while keeping AG Pro in the panel header for series identity.
- Added Flow Memory Zones that appear only when a fresh directional state transition meets both minimum imbalance strength and minimum quality-score requirements.
- Added selective Bull Retest and Bear Retest labels when price revisits the active flow memory zone and closes with directional structure still in place.
- Refined event filtering so BUY FLOW, SELL FLOW, retest, and fade-risk labels remain visible without turning the chart into a label cloud.
- Improved label offsets so markers sit farther away from candles and ribbon congestion instead of getting buried inside fast price action.
- Rebuilt the summary panel in the standard AGPro format with a single merged blue header row, adjustable panel location, adjustable theme, and adjustable text sizing.
- Switched the panel defaults to a cleaner premium presentation using the locked AGPro palette.
- Added professional English tooltips across the input set to make the script easier to understand without opening the source code.
- Tightened the exhaustion logic so FADE RISK appears in more meaningful weakening conditions rather than firing too loosely.
- Kept the implementation lightweight by managing one active memory zone at a time instead of stacking many projected boxes.
Practical effect
- Cleaner premium screenshots for public publication
- Better distinction between fresh directional control and later retest behavior
- More chart-native context for continuation reading
- Stronger visual separation from generic trend ribbons and common imbalance overlays
- Better usability for traders who want a quick read without shifting attention to a lower pane
Methodology note
Flow Memory Zones are not order blocks, support and resistance levels, or footprint-style bid/ask imbalance zones. They are generated from the script's own estimated directional imbalance model and internal flow-quality logic. This keeps the update aligned with the original concept while making the script materially more distinctive and more memorable on-chart.
What stayed the same
- The script still uses an estimated directional volume pressure model built from candle structure and price location within the bar.
- The flow spine, adaptive ribbon, burst logic, exhaustion concept, and chart-overlay philosophy remain part of the core design.
- The update is a workflow and presentation refinement, not a claim of true exchange-level delta, footprint data, or institutional order-book access.
Publishing note
This update is designed to improve readability, visual identity, and chart communication. It does not turn the script into a trading system, prediction engine, or guaranteed signal model. The tool remains an analytical overlay intended to help users read directional participation conditions in context.
Note di rilascio
🔧 UPDATE NOTES - v2.1This update focuses on decision clarity and readability.
The core purpose of the script remains unchanged.
This release improves how the existing flow map is presented and interpreted on the chart.
This script continues to function as an analytical and visualization tool.
It does not attempt to predict price direction or provide guaranteed outcomes.
------------------------
What Changed
------------------------
• New "Next Action" panel readout
The panel now translates the current flow state into a plain-language focus line: "Hold Bias - Bull Flow" or "Hold Bias - Bear Flow" on high-quality directional flow, "Track Bull / Bear Flow" on standard directional flow, "Track Bull / Bear Retest" when price revisits the active memory zone, "Caution - Bull / Bear Flow Fading" during exhaustion, and "Wait - Flow Balanced" otherwise. The dashboard can be read at a glance without decoding raw values.
• Standardized short title
The chart short title now follows the AGPro Series naming convention.
------------------------
Visual Improvements
------------------------
• Refined panel visual hierarchy: the Next Action row is highlighted so the current focus stands out at first glance
• Improved panel information flow from state, to focus, to flow detail, to zone context
• No changes to the flow spine, adaptive ribbon, spine glow, memory zones, burst labels, exhaustion labels, retest labels, or the live spine tag - the established chart presentation is preserved exactly
• Default visual settings remain balanced; existing user settings are preserved
------------------------
Interface & Usability
------------------------
• Optimized panel layout (State -> Next Action -> Bias -> Strength -> Persistence -> Flow Quality -> Active Zone -> Zone Status -> Exhaustion)
• Enhanced overall user experience without changing core logic
------------------------
Behavior Notes
------------------------
This update does not change the core analytical logic of the script.
The delta estimation, normalization, imbalance state engine, flow quality scoring, memory zones, labels, and alert conditions are identical to v2.0.
Users should interpret outputs the same way as before, but with a clearer reading order in the panel.
------------------------
Limitations Reminder
------------------------
The script remains a rule-based analytical tool that estimates directional volume pressure.
Market conditions such as volatility, liquidity, and timeframe differences may affect how flow states appear.
Outputs should always be interpreted within broader market context.
------------------------
Risk Reminder
------------------------
This script is for educational and analytical purposes only.
It does not provide financial advice or guaranteed trading outcomes.
Users remain responsible for their own decisions.
Script open-source
Nello spirito di TradingView, l'autore di questo script lo ha reso open source, in modo che i trader possano esaminarne e verificarne la funzionalità. Complimenti all'autore! Sebbene sia possibile utilizzarlo gratuitamente, ricordiamo che la ripubblicazione del codice è soggetta al nostro Regolamento.

Public-free scripts + invite-only AGPro workflows for market analysis, liquidity context, risk planning and execution review.
Rules-based. No hype. No guesswork.
Library & access: agprolabs.com/
Telegram: t.me/agprolabs
Rules-based. No hype. No guesswork.
Library & access: agprolabs.com/
Telegram: t.me/agprolabs
Declinazione di responsabilità
Le informazioni e le pubblicazioni non sono intese come, e non costituiscono, consulenza o raccomandazioni finanziarie, di investimento, di trading o di altro tipo fornite o approvate da TradingView. Per ulteriori informazioni, consultare i Termini di utilizzo.
Script open-source
Nello spirito di TradingView, l'autore di questo script lo ha reso open source, in modo che i trader possano esaminarne e verificarne la funzionalità. Complimenti all'autore! Sebbene sia possibile utilizzarlo gratuitamente, ricordiamo che la ripubblicazione del codice è soggetta al nostro Regolamento.
Public-free scripts + invite-only AGPro workflows for market analysis, liquidity context, risk planning and execution review.
Rules-based. No hype. No guesswork.
Library & access: agprolabs.com/
Telegram: t.me/agprolabs
Rules-based. No hype. No guesswork.
Library & access: agprolabs.com/
Telegram: t.me/agprolabs
Declinazione di responsabilità
Le informazioni e le pubblicazioni non sono intese come, e non costituiscono, consulenza o raccomandazioni finanziarie, di investimento, di trading o di altro tipo fornite o approvate da TradingView. Per ulteriori informazioni, consultare i Termini di utilizzo.