Indicatore
Indicatori di Bill Williams

Momentum Trend Fusion (MTF)The Momentum Trend Fusion (MTF) is a composite indicator that combines the Awesome Oscillator and the Relative Strength Index to provide a unique perspective on market momentum and trend strength. The MTF is calculated by first running the Relative Strength Index (RSI) on the Awesome Oscillator (AO) and then applying an Exponential Moving Average (EMA) on the RSI value. The MTF is designed to help traders detect market phases and confirm trend direction by analyzing the cross of the EMA an
Indicatore

3 indicators in another time frame "3 indicators in another time frame"
1- In the indicator settings section, you can save and change another time period
2-For time frame changes, it should be calculated in minutes
3-Includes three performance indicators ( ichimoku , bollinger bans, pivot ) that are set to a 15-minute timeframe by default.
Indicatore

Indicatore

BugiCoThis indicator is designed for shorter time frames - specifically 15 minutes to 1 minute.
It is scalping tool that users William Bollinger setup on various time frames.
This indicator will give you an edge and a way of thinking that you NEVER THOUGHT before because it has a story.
This indicator isolates between 0 and 100. Below around 20 is a buy, above 80 is a sell.
In these locations, try to formulate a scalping strategy with stop loss and risk management. If you don't do that, you will
Indicatore

Profitunity - Beginner [TC]This indicator aggregates the knowledges of the first level of the Trading Chaos approach by Bill Williams. It uses the Market Facilitation Index (MFI) in conjunction with the type of bar(candle) to generate strong long and strong short signals.
General information
Bars numeration
All bars or candles could be numbered with the following algorithm. If we divide the candle for 3 equal parts from high to low. The highest third have the number 1, the middle one - 2, the lowest one - 3. Hence
Indicatore

CM_SlingShotSystem+_CassicEMA+Willams21EMA13 htc1977 editionThis strategy is a combination of 2 indicators based on EMA(actually x3 EMAs and Williams ind.
We usin this to see where EMA fast is above EMA slow(for long), entry position when price hit fast EMA and exit if trend changes or price overbought, or by stoploss 1%.
The opposite for a short position.
For better result You can change every EMA's, stoploss, Willam's ind and other visualisation in settings.
If You find good combination - please, let me know(if You want).
I will check it with ML, a
Strategia

Trend & atr day & calcHi!
Why for what and how in this script?
At the time of publication the script consists of three modules, it may increase in the future.
1. Bottom left corner : daytime ATR module
(idea and basis of the author's script - ???)
- The size of the daily ATR based on 14 bars;
- intraday ATR progress;
- colour indication of the progress status, for easier visual perception (green < 70%, yellow 70-90 and red over 90% of ATR)
By evaluating the progress of the daily ATR, it is possible to suggest and
Indicatore
Ostinated Adjustable Fractal with AlertThis indicator (Ostinated Adjustable Fractal with Alert) is like the traditional William Fractals. However, it created to overcome two disadvantages of the William Fractals:
1. Set minimum value to 1. This a big advantage over traditional William Fractal that has a minimum value of 2.
2. Alerts: setting alert with the traditional William Fractal is very difficult. We have created this indicator to simplify setting fractal alerts.
Like and comment.
Enjoy!
Indicatore

SUPER Alligator[Gabbo]📈 Alligator Indicator Update - Version 2
🔹 New Features and Improvements:
1️⃣ New MA Selection for Indicator Calculations:
You can now choose from various Moving Average types for the indicator calculations, adding more flexibility to your analysis.
2️⃣ Improved Input Visibility and Organization:
Inputs have been reorganized so that the most commonly used options are placed at the beginning for quicker and more convenient configuration.
3️⃣ Bug Fixes and Code Improvements:
Minor
Indicatore

Quick and Simple - WPR+RSI+CCITake a look.
Couple of confluencial reversal signals from popular indicators (W%R, RSI & CCI). I can only say this shows how random the "stanard tools" are and how the market makers "play" these kind of tools to their advantage.
That said. It's better tha average, but not top-class, so expect to have to take signals with other confluence. DON'T take the plots or signals as buy / sell signals, they are just confluencial movements from these indicators based on how they should be "traditionall
Indicatore

EMA 5,15,35,89,200 BY NUTPlots exponential moving average on four timeframes at once for rapid indication of momentum shift as well as slower-moving confirmations.
Displays EMA 5, 15, 35, 89 and 200... default colors are hotter for faster timeframes, cooler for slower ones
ขอบคุณครับ
Strategia

Shaikh Saab Ki MagarmachJab Magarmach bhuki ho jati hai to wo sabko kha jati hai chahe wo bulls ho ya bears.
Indicatore
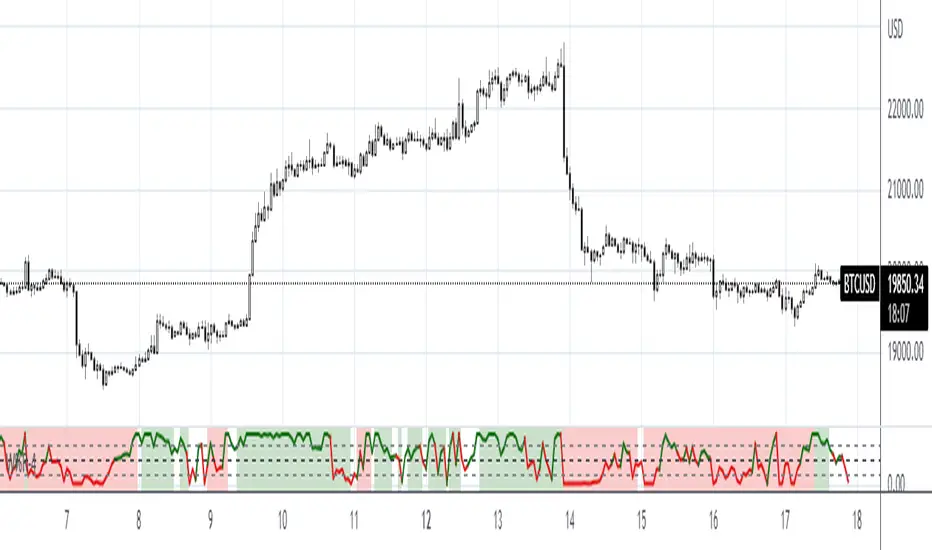
End-pointed SSA of Williams %R [Loxx]End-pointed SSA of Williams %R is an indicator that runes Williams %R SSA calculation through a Singular Spectrum Analysis (SSA) algorithm to derive a smoother final output. The reduction in noise from the traditional Williams %R is significant.
What is Williams %R?
Williams %R , also known as the Williams Percent Range, is a type of momentum indicator that moves between 0 and -100 and measures overbought and oversold levels. The Williams %R may be used to find entry and exit points in the
Indicatore

Williams %R (v.4)This is an upgrade and an update of my Williams %R indicator modification.
As before this implementation is enhanced with CCI in the form of background colors. These colors can be used as a confirmation signal and indication of a current trend. Thee also can be employed in deciding when to enter/exit the market.
Besides, added is a scaling function and Lower/Upper Bound inputs.
Indicatore
Fractals + Alligator + Divergent Bars + Squat BarsFractals + Alligator + Divergent Bars + Squat Bars Williams Indicators
All combined in one
Indicatore

scalping with market facilitationThis strategy is for scalping low timeframes for 10 pips. I have yet to see a strategy with this unique combo of indicators.
First we have volume indicator market facilitation, where we are looking for volume and mfi to be up, then we want the adx 5 to be above level 30 and above its ema period 3, then if these conditions are good we take shorts when ema 8 is below ema 100 and longs when ema8 is above ema 100 with parabolic sar in its propet place, also to verify trend we have obv over or unde
Strategia

Swing PointsEnglish:
The indicator shows the fractals where stop-losses may be located and can be used to trade from their taking.
You can adjust the length of the fractal (the number of bars with which it is surrounded on both sides, to confirm the validity).
You can also display lines from fractal points for clarity.
To keep the chart clean, you can enable deletion of already taken fractals.
Example of use with deleted fractals and without lines:
Русский:
Индикатор показывает фракталы где могут нах
Indicatore

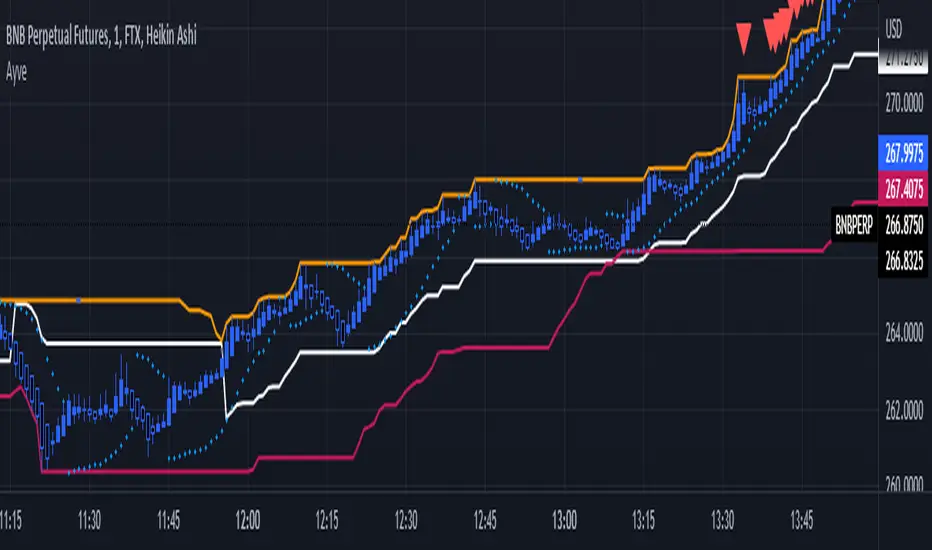
Ayvebotemİki kanal arasında çalışan içinde süper trend,parabolic sar ve bollinger bantları bulunan combo bir indikatör.
Indicatore
PDFMA Awesome Oscillator [Loxx]Theory:
Bill Williams's Awesome Oscillator Technical Indicator (AO) is a 34-period simple moving average, plotted through the bars midpoints (H+L)/2, which is subtracted from the 5-period simple moving average, built across the bars midpoints (H+L)/2. It shows us quite clearly what’s happening to the market driving force at the present moment.
This version uses PdfMA (Probability Density Function weighted Moving Average) instead of SMA (Simple Moving Average). This is a deviation from the or
Indicatore

Williams Vix Fix Bottoms and TopsThis indicator uses the very popular Williams Vix Fix for Bottoms by Chris Moody but not only does it search for bottoms, it can also be switch to work for tops for those who look to short the market. I've also added in a few options like flipping the indicator, color adjustments on the settings page, as well as cut a few of the options I feel did not need to be in which cluttered the screen when the settings were opened. In his later revisions of the Williams Vix Fix, CM took out the functions
Indicatore

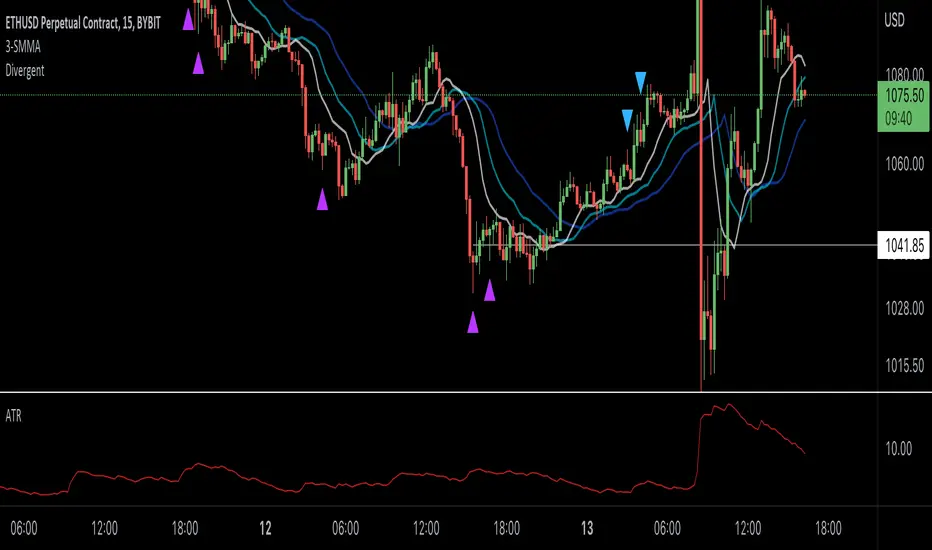
Williams Divergent Bar (First Wise Man)Based on Bill Williams' First Wise Man. Bull candles are marked with purple and Bear candles with blue.
Requirements:
- Candle height must be greater than ATR (filter out tiny Doji candles)
- Open and Close must be beyond the HL2 (midpoint) for either Bull or Bear scenarios
- Candle HL2 must be more than 1x ATR from the Alligator Jaw (13-period SMMA, pushed forward 8 periods). The dark blue line in my example.
- ATR is calculated using a 13-period RMA of the true range
Indicatore
A_HMS_RSI_COMPOSITMy majic Macd Indicator with Ema base macd is My great Indicator that combine four ema base macd lines with its signal lines that show price gravity by best way , and one spatial chart that is the best part of this magic indicator that help you to trading without any problem
for better use note that:
green fill line is ema 66 and ema 199 macd and signal its name is macd very slow signal line
blue fill line is ema 19 and ema 66 macd and signal its name is macd normal signal line
red fill line is
Indicatore

Phase Accumulation, Smoothed Williams %R Histogram [Loxx]Phase Accumulation, Smoothed Williams %R Histogram is a Williams %R indicator using dynamic inputs from Ehlers Phase Accumulation Dominant Cycle Period Algorithm. This indicator includes alerts and signals and is in a smoothed histogram form. The version of Phase Accumulation in this indicator is a modified form of of Ehlers algorithm to allow for better smoothing and cycle length selection.
What is Williams %R?
Williams %R , also known as the Williams Percent Range, is a type of momentum i
Indicatore
