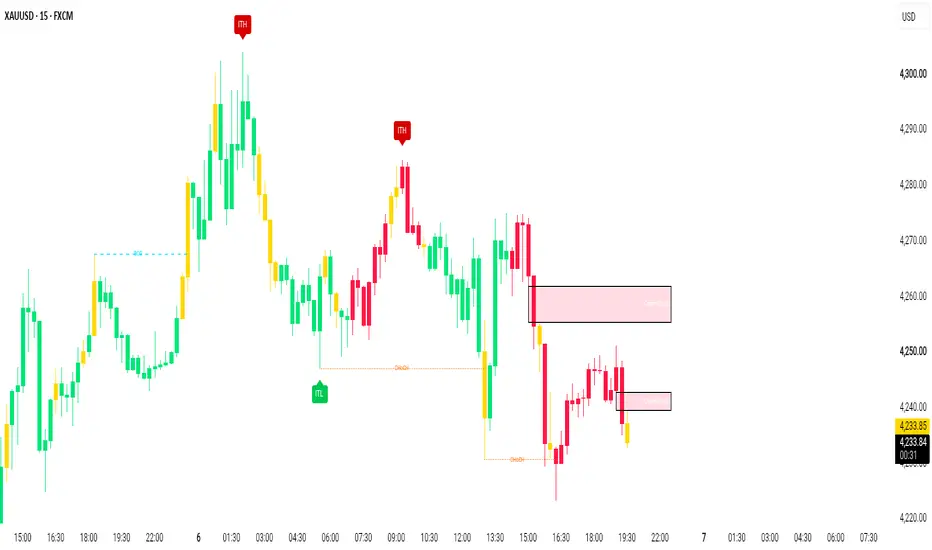
Bolly Breakout AlertsBolly Breakout Alerts is a simple session-based Bollinger Band breakout indicator designed for 5-minute trading setups.
It monitors for a confirmed candle close above the upper Bollinger Band or below the lower Bollinger Band, then allows alerts to trigger only during the selected trading window. This helps filter out unnecessary notifications outside the periods you actually trade. 📈
The script uses standard Bollinger Band settings:
20-period SMA
2.0 standard deviations
Close price as the source
Included features:
5-minute candle close confirmation
Long breakout alerts above the upper band
Short breakout alerts below the lower band
Combined “Either Direction” breakout alert
Separate DAX and Dow trading windows
UK time handling using Europe/London
Visual breakout markers on the chart
Session filtering to reduce unwanted alerts
Default session windows:
DAX: 06:00–08:20 UK time
Dow: 12:30–14:50 UK time
⚙️ Important setup
After adding the indicator to your chart, open the indicator settings and select the correct market for the chart you are using:
If the indicator is on a DAX chart, select DAX
If the indicator is on a Dow chart, select DOW
This is important because the selected market determines which alert time window is used.
Adding the indicator to the chart does not automatically create a TradingView alert. An alert still needs to be created manually.
Open TradingView’s alert setup and select Bolly Breakout Alerts as the condition, then select Bolly Breakout - Either Direction if you want to be notified when a candle closes outside either the upper or lower Bollinger Band.
For best results, set the alert frequency to Once Per Bar Close. 🔔
If you change the selected market, session times, or other indicator settings after creating an alert, it is advisable to recreate the alert so TradingView uses the updated settings.
The indicator is intended as an alerting and monitoring tool rather than a complete trading system. It does not provide stop losses, profit targets, or trade management rules.
Best used on a 5-minute chart.
⚠️ Always test alerts and session behaviour before relying on them in live trading. Indicatore

Sassy CCI: Reversion, Divergence, & CompressionSassy CCI
Reading the Mood Behind Price
1. CCI (Commodity Channel Index). At its simplest, CCI measures **how far price has moved away from its normal average**.
Why I like CCI? I believe CCI often **moves before the larger price move becomes obvious**.
That makes it difficult to use CCI alone for traditional alerts—because it can move quickly and create signals before price has actually confirmed anything.
But that same characteristic makes CCI extremely useful for:
* 👀 **Seeing movement early**
* ⚡ **Scalping**
* 🔄 **Spotting reversals**
* 📦 **Recognizing compression**
* 🧠 **Understanding the relationship between momentum and price**
That is where **Sassy CCI** comes in.
---
2. Why "Sassy"?
Stock trading is ultimately about **psychology**.
Price moves because people make emotional decisions about the future.
Someone thinks:
> "This is going higher."
They buy.
Someone else thinks:
> "This move is over."
They sell.
Fear, confidence, excitement, uncertainty, greed, hesitation and exhaustion all become reflected in the movement of price.
So instead of looking at CCI as simply **overbought or oversold**, I wanted to think about it differently:
### What mood is the market in right now?
Sassy CCI combines CCI, price movement, compression and divergence with additional formulas designed to focus on the **important moments where that relationship changes.**
It isn't designed to predict the future.
It is designed to help **confirm what the market is already beginning to reveal.**
---
3. The Six Moods
### 🔵 CALM
**"Nothing important is happening yet."**
Price and momentum aren't showing a strong relationship or developing pressure.
**Response:**
🧘 **Wait.**
Don't force a trade just because the market is moving.
---
### 🟦 BUILDING
**"Something is starting to develop."**
Price is becoming compressed and conditions are tightening.
Think of it like a spring beginning to load.
**Response:**
👀 **Watch closely.**
This isn't necessarily the entry.
It means the market may be preparing for a larger move.
---
### ⭐ INTENSE
**"Pressure is building inside compression."**
The market has entered a significant compression state.
Price isn't necessarily moving much yet—but something is happening underneath the surface.
**Response:**
🎯 **Prepare for expansion.**
Watch for price, CCI and other confirmation to agree on the direction of the eventual move.
---
### 🩷 GROOVING
**"Price and momentum are working together."**
This is alignment.
Price and CCI are moving in the same general direction rather than fighting each other.
**Response:**
➡️ **Look for continuation.**
This can be especially useful for scalping because the momentum and price action are cooperating.
---
### 🟧 AGITATED
**"Price and momentum aren't agreeing."**
This is where things get interesting.
Price may be moving one way while CCI is telling us something different.
That disagreement can indicate:
* ⚠️ weakening momentum
* 🔄 a possible reversal
* 🪤 a failed move
* ⏳ a move that needs confirmation
**Response:**
🛑 **Slow down.**
Don't chase the move.
Look for confirmation before entering—or consider whether the current move is losing strength.
---
### 🔴 EXHAUSTED
**"The pressure has reached an extreme."**
This corresponds with the strongest pressure zone in Sassy CCI.
The move may still continue, but the market is showing signs that the current emotional push has become extreme.
**Response:**
🔄 **Look for a reaction.**
This is where reversal setups become especially interesting.
---
# 4. The Big Picture
Sassy CCI isn't saying: BUY or SELL.
Instead, it asks: "What is the market doing—and how are momentum and price responding to each other?"
Think of the moods as a progression:
**🔵 CALM**
↓
**🟦 BUILDING**
↓
**⭐ INTENSE**
↓
**🩷 GROOVING**
↓
**🟧 AGITATED**
↓
**🔴 EXHAUSTED**
The indicator is not trying to force a story onto the market.
It is trying to help identify **when the market's behavior changes.**
---
# 5. How I Use It
My goal isn't to use Sassy CCI as a standalone trading system.
I use it as a **confirmation tool**.
I want price action, important levels and Sassy CCI to tell a similar story.
Sassy CCI Alerts
---
# The Most Important Rule
### Don't trade the alert.
### Investigate the alert.
Sassy CCI is designed to **get my attention at important moments.**
Once it does, I look at:
**1. Price action**
**2. Key levels**
**3. Volume / participation**
**4. Market direction**
**5. Sassy CCI confirmation**
The indicator helps answer:
> **"Is something important happening right now?"**
Price action helps answer:
> **"Is there actually a trade here?"**
---
# A Simple Hierarchy
If I had to simplify the entire alert system:
| Signal | Attention Level | My Response |
| ----------------------- | --------------: | --------------------- |
| 🔵 Calm / no alert | Low | Wait |
| 🟦 Compression Start | Medium | Start watching |
| ⭐ Compression / Intense | High | Prepare |
| 🟢 Compression Bias | High | Watch that direction |
| 🩷 Grooving | High | Look for continuation |
| 🟧 Agitated | High | Be cautious |
| 🟡 Pressure 1 | Medium | Momentum increasing |
| 🟠 Pressure 2 | High | Momentum is intense |
| 🔴 Pressure 3 | Very High | Watch for exhaustion |
| 🔄 Divergence | High | Look for a change |
| ⭐ Divergence+ | Very High | Look for confirmation |
### The goal isn't more alerts.
The goal is **better attention.**
Sassy CCI is designed to reduce the amount of time I spend staring at charts and increase the chance that I look at the chart **when something meaningful is developing.**
Indicatore

BB Fill + Visible-Range Fib Retracement# BB Fill + Visible-Range Fib Retracement
A 2-in-1 Pine Script indicator that bundles a **Bollinger Bands volatility fill** and a **visible-range Fibonacci retracement** into a single script. If your TradingView plan limits the number of indicators you can have on a chart at once, this lets you get both tools for the price of one indicator slot.
## Bollinger Bands (grey fill)
Standard Bollinger Bands math is used under the hood:
- **Basis** = Simple Moving Average (SMA) of the source over the chosen length.
- **Upper band** = Basis + (StdDev of source over the length × multiplier).
- **Lower band** = Basis − (StdDev of source over the length × multiplier).
Unlike a typical BB indicator, the basis, upper, and lower lines are **not drawn**. Only the shaded area between the upper and lower bands is visible, giving a quick, uncluttered read on volatility/price range without adding extra lines to your chart.
**Inputs:**
- **BB Length** (default `20`) — number of bars used for the moving average and standard deviation.
- **BB Source** (default `close`) — price series the calculation is based on.
- **BB StdDev Multiplier** (default `2.0`) — how many standard deviations the bands extend from the basis.
- **BB Fill Color** (default grey) — color of the shaded band.
- **BB Fill Transparency %** (default `85`) — how transparent the shading is (higher = more transparent/subtle).
## Visible-Range Fibonacci Retracement
This tool automatically scans the bars **currently visible on your screen** to find the highest high and the lowest low, then draws the standard Fibonacci retracement levels between them:
`0, 0.236, 0.382, 0.5, 0.618, 0.786, 1`
The retracement direction is auto-detected: if the low occurred before the high in the visible range, it's treated as an uptrend (levels retrace down from the high); otherwise it's treated as a downtrend (levels retrace up from the low). Each level is drawn as a horizontal line spanning the visible range, with an optional price label at the right edge showing the level ratio and its price.
**Inputs:**
- **Show Fib Retracement** — toggles the fib lines on/off.
- **Show Fib Price Labels** — toggles the price labels next to each fib line on/off.
**Important behavior to understand:** the lines update to reflect the highest high/lowest low of whatever range you're viewing when you scroll or zoom the chart, but Pine Script only allows a script to redraw on the arrival of new bar/tick data or when the chart is reloaded — not on every scroll/zoom gesture by itself. In practice this means the levels catch up shortly after you stop interacting with the chart (or on the next price update), rather than tracking your viewport in real time. Because of this, the tool is a **discretionary visual aid** meant for manual chart reading, not a deterministic signal — it should not be used as input to automated strategies or backtests, since its output depends on your current viewport rather than a fixed, reproducible calculation.
## How to use
- Use the grey BB fill as quick visual context for current volatility — a wide band suggests an expansive/volatile market, a narrow band suggests consolidation.
- Use the fib levels as an on-the-fly support/resistance reference for whatever swing high/low is currently in view — zoom or scroll to the price range you care about, let the chart refresh, and read the levels as potential reaction zones.
- Combine both: watch for price reacting near a fib level while inside or near the BB shaded zone for added confluence.
## Settings summary
| Input | Default | Description |
|---|---|---|
| BB Length | 20 | Number of bars for the SMA basis and standard deviation. |
| BB Source | close | Price series used for the Bollinger Bands calculation. |
| BB StdDev Multiplier | 2.0 | Multiplier applied to standard deviation to set band width. |
| BB Fill Color | grey | Color of the shaded area between the bands. |
| BB Fill Transparency (%) | 85 | Transparency of the BB shading. |
| Show Fib Retracement | true | Toggles drawing of the fib retracement lines. |
| Show Fib Price Labels | true | Toggles price labels next to each fib line. |
## Limitations
- The fib retracement only redraws when new bar/tick data arrives or the chart reloads — it does not update live as you scroll or zoom, due to a Pine Script platform limitation.
- Not intended for automated strategy logic or backtesting: the visible-range calculation is viewport-dependent and not deterministic across runs.
- The script keeps an internal history array of bar times/highs/lows that grows as the chart's loaded history grows, which can add a small amount of memory/processing overhead on very long chart histories.
---
Last updated (UTC): 2026-09-13 08:41:01 UTC
Indicatore

TDI - Goldminds / MMM Jakub Donovan RecreationTDI — Goldminds / MMM
> A Market Makers Method–style TDI combining RSI momentum, moving averages, and volatility bands to identify trend, momentum shifts, and overbought/oversold conditions.
The Traders Dynamic Index (TDI ) is a momentum and trend-following oscillator that combines RSI, moving averages, and volatility bands into a single indicator.
This version is based on the Goldminds TDI, adapted for the Market Makers Method (MMM) and reconstructed using the original parameters associated with the Jakub Donovan version.
Core Components:
RSI: 21-period RSI
Volatility Bands: 34-period SMA with a 1.6185 standard-deviation multiplier
Fast MA: 7-period SMA of RSI
Slow MA: 2-period SMA of RSI
Reference Levels: 20 / 30 / 50 / 70 / 80
The TDI can be used to identify momentum shifts, trend direction, overbought/oversold conditions, and potential reversals.
How to interpret it
Green & Red lines
The moving averages of RSI help identify changes in momentum. Crossovers can highlight potential shifts in short-term momentum.
Yellow line
The yellow line represents the RSI's broader average and acts as a useful reference for the overall momentum environment.
Blue bands
The volatility bands expand and contract based on RSI volatility, helping identify periods when momentum becomes unusually extended.
50 level
The 50 level acts as the key momentum midpoint:
* Above 50 → bullish momentum
* Below 50 → bearish momentum
30 / 70
Traditional oversold/overbought zones.
20 / 80
Extreme momentum zones that can help identify potentially exhausted moves.
> Important: The TDI should be used as a confirmation tool rather than as a standalone buy or sell signal. Combining it with price structure, support/resistance, volume, and market conditions can provide stronger trade setups.
Indicatore

Bollinger Bands Asymmetry AttributionBollinger Bands Asymmetry Attribution
Overview
Bollinger Bands Asymmetry Attribution is an open-source volatility-analysis overlay that studies how price dispersion is distributed above and below a selectable moving basis.
A conventional Bollinger Bands calculation uses one standard deviation to place symmetric upper and lower bands around a moving average. This script takes a different approach. It separates basis-relative squared deviations into upper-side and lower-side components, attributes the resulting directional dispersion to observation frequency and conditional excursion severity, and then constructs independently stabilized upper and lower wings.
The indicator is designed to answer questions such as:
- Is current dispersion concentrated above or below the basis?
- Is that asymmetry caused by price spending more observations on one side?
- Is it caused by fewer but larger excursions on one side?
- Are frequency and severity reinforcing each other or opposing each other?
- Is directional dispersion currently shifting, and which component is producing that shift?
- How stretched is the current source relative to the matching asymmetric wing?
This is a descriptive market-structure and volatility tool. It is not a trading strategy, directional forecast, reversal model, or buy/sell signal generator.
Core calculation
For each bar, the script evaluates the selected Source over the Attribution Length around the current selected basis.
For every observation in the rolling window:
Deviation = Observation - Current basis
Observations above the basis contribute to the upper squared-deviation mass.
Observations below the basis contribute to the lower squared-deviation mass.
Upper squared mass:
Sum of squared deviations where Deviation > 0
Lower squared mass:
Sum of squared deviations where Deviation < 0
The directional semivariances are then calculated across the entire observation window:
Upper semivariance = Upper squared mass / N
Lower semivariance = Lower squared mass / N
where N is the total number of valid observations in the window.
Frequency and severity attribution
Each directional semivariance can be factored exactly into two components.
For the upper side:
Upper occupancy = Upper observation count / N
Upper conditional severity =
Upper squared mass / Upper observation count
Upper semivariance =
Upper occupancy x Upper conditional severity
The same identity applies to the lower side.
In the readout:
F means observation frequency or occupancy.
S means conditional squared-excursion severity.
Frequency describes how often observations occurred on one side of the basis.
Severity describes how large the squared excursions were when observations occurred on that side.
This distinction allows two windows with similar directional semivariance to be interpreted differently.
For example:
- Frequent but relatively small upper deviations can produce upper-side dispersion.
- A small number of very large upper deviations can produce a similar amount of upper-side dispersion.
- Frequency and severity can both favor the same side.
- Frequency can favor one side while severity favors the other.
The raw mathematical identity is exact. For visual stability, the MASS, frequency, and severity diagnostics shown in the panel are smoothed independently. Therefore, the displayed smoothed values should be interpreted as stable diagnostics rather than as an algebraic identity between the visible numbers.
What makes this script different
The original contribution is not simply the use of different upper and lower band widths. Asymmetric volatility bands and directional semivariance concepts already exist.
This script extends the analysis by connecting four related layers in one coherent framework:
1. Directional dispersion mass
It measures how total basis-relative squared dispersion is divided between the upper and lower sides.
2. Level attribution
It separates each side's directional semivariance into:
- Observation frequency or occupancy
- Conditional squared-excursion severity
3. Mass Shift Attribution
It decomposes the one-bar change in directional semivariance into:
- A frequency-change contribution
- A severity-change contribution
4. Trader-facing geometry
It connects those attribution measurements to independently stabilized asymmetric wings, side-normalized stretch, wing motion, transition markers, and alerts.
The script does not combine unrelated oscillators, volume filters, trend scores, or multi-timeframe indicators. All principal outputs derive from the same basis-relative directional-dispersion framework.
Asymmetric wing construction
The primary upper and lower wings are not conventional symmetric Bollinger Bands.
The script first calculates the conditional variance for each side. When one side contains only a small number of observations, its conditional variance can become unstable or overly dependent on one data point.
To reduce this problem, the displayed geometry uses Sparse-Side Stabilization.
A side with fewer observations is partially shrunk toward the pooled variance of the full rolling window. A side with more observations retains more of its own conditional variance.
Conceptually:
Stabilized side variance =
Side weight x Side conditional variance
+
(1 - Side weight) x Pooled variance
The side weight increases with the number of observations on that side.
The stabilized upper and lower variances are converted into wing distances using their square roots, the Wing Multiplier, and optional RMA smoothing.
Upper wing = Basis + Stabilized upper distance
Lower wing = Basis - Stabilized lower distance
This stabilization affects the displayed wing geometry only. The underlying MASS, Frequency, Severity, and identity diagnostics remain based on the unshrunk directional statistics.
The optional Classic Symmetric Reference displays a conventional SMA-centered standard-deviation envelope for comparison. It is disabled by default to keep the publication chart clear.
Visual readout
The compact panel is organized into seven rows.
Header
The header shows:
- The script name
- LIVE or CLOSE execution status
- The current upper/lower dispersion-mass state
Examples:
UPPER MASS 60.2%
LOWER MASS 58.7%
MASS 51.0%/49.0%
The percentages are smoothed directional semivariance shares. They are not probabilities, expected returns, price targets, or forecasts.
MASS
MASS shows how directional semivariance is divided between the upper and lower sides.
The cyan value represents the upper share.
The magenta value represents the lower share.
The two displayed shares sum to 100%.
A larger upper share means that observations above the basis currently account for more of the smoothed basis-relative squared dispersion. A larger lower share means that observations below the basis account for more.
ATTRIB
ATTRIB describes the composition of the current asymmetry.
F = Observation frequency or occupancy
S = Conditional squared-excursion severity
The symbols have the following meanings:
F▲ = Frequency favors the upper side
F▼ = Frequency favors the lower side
F· = No material frequency bias
S▲ = Conditional severity favors the upper side
S▼ = Conditional severity favors the lower side
S· = No material severity bias
S? = Severity cannot be compared because one side has too few observations
The ATTRIB states are:
Balanced
Neither frequency nor severity exceeds the selected significance threshold.
Frequency
Observation frequency favors one side, while conditional severity is approximately balanced.
Severity
Conditional severity favors one side, while observation frequency is approximately balanced.
Reinforced
Frequency and severity favor the same side.
Offset
Frequency and severity favor opposite sides. One side may occur more often while the other side contains larger conditional excursions.
Sparse
One side does not contain enough observations for a reliable two-sided severity comparison.
No dispersion
The rolling window contains no meaningful basis-relative dispersion.
Warming
The required rolling history is not yet available.
SHIFT
SHIFT analyzes how directional dispersion changed from the previous bar to the current bar.
For either side:
Semivariance = Occupancy x Conditional severity
The one-bar product change is decomposed as:
Delta semivariance =
Delta occupancy x Average conditional severity
+
Delta conditional severity x Average occupancy
This midpoint formulation allocates the interaction between occupancy and severity equally, avoiding dependence on whether frequency or severity is applied first.
The script calculates this decomposition separately for the upper and lower sides, then evaluates the change in the upper-minus-lower directional semivariance difference.
In the SHIFT row:
F↑ means the frequency component is moving directional dispersion toward the upper side.
F↓ means the frequency component is moving directional dispersion toward the lower side.
S↑ means the severity component is moving directional dispersion toward the upper side.
S↓ means the severity component is moving directional dispersion toward the lower side.
A centered dot means the component is below the configured significance threshold.
Possible SHIFT states include:
Frequency upper or Frequency lower
The occupancy-change component is dominant.
Severity upper or Severity lower
The conditional-severity-change component is dominant.
Reinforced upper or Reinforced lower
Frequency and severity changes are both moving directional dispersion toward the same side.
Shared upper or Shared lower
Both components contribute in the same net direction without one meeting the configured dominance ratio.
Offset
Frequency and severity changes oppose each other.
Stable
The net normalized directional mass shift is below the selected threshold.
The displayed Delta value is normalized by the average total semivariance of the two compared windows. It is not a price percentage, return estimate, or directional probability.
STRETCH
STRETCH measures the current Source distance from the basis using the wing on the same side.
When Source is above the basis:
Stretch =
(Source - Basis) / Upper wing distance
When Source is below the basis:
Stretch =
-(Basis - Source) / Lower wing distance
Interpretation:
+1.00x = Source is at the upper wing
-1.00x = Source is at the lower wing
+0.50x = Source is halfway from the basis to the upper wing
-0.50x = Source is halfway from the basis to the lower wing
A value above +1.00x or below -1.00x means the selected Source is outside the corresponding asymmetric wing.
Stretch does not predict continuation or reversal. It only reports the current location relative to the side-specific dispersion geometry.
WINGS
WINGS shows the one-bar movement of the stabilized upper and lower wing distances.
U refers to the upper wing.
D refers to the lower wing.
Arrow meanings:
↗ = Expanding beyond the selected Wing Motion Threshold
↘ = Contracting beyond the selected Wing Motion Threshold
→ = Approximately stable
The ratio on the right is:
Upper wing distance / Lower wing distance
A ratio above 1.00 means the upper wing is wider.
A ratio below 1.00 means the lower wing is wider.
The ratio describes asymmetric geometry, not directional probability.
NOW
NOW reports the current side-normalized location or the most recent live transition preview.
Possible location states include:
- Upper outside
- Upper edge
- Upper half
- On basis
- Lower half
- Lower edge
- Lower outside
The C value is the realized rolling containment percentage.
Containment measures how often the selected Source was inside the displayed asymmetric wings over the configured Containment Lookback.
This is a backward-looking realized statistic. It is not a guaranteed future coverage probability.
How to use the indicator
A practical reading sequence is:
1. Read MASS
Determine whether basis-relative squared dispersion is currently concentrated more heavily above or below the basis.
2. Read ATTRIB
Determine whether the current asymmetry is associated primarily with:
- More observations on one side
- Larger excursions on one side
- Both factors reinforcing each other
- Opposing frequency and severity effects
- An insufficient side sample
3. Read SHIFT
Determine whether the directional dispersion difference is currently changing and whether frequency or severity is producing that change.
4. Read STRETCH
Locate the current Source relative to the corresponding asymmetric wing.
5. Read WINGS
Check whether the upper and lower dispersion envelopes are expanding, contracting, or remaining stable.
6. Read NOW and containment
Confirm the current location or transition and review how frequently the Source has historically remained inside the displayed wings.
Example interpretations:
UPPER MASS with Frequency attribution
Observations have occurred above the basis more often, but upper-side conditional excursion severity is not materially larger.
UPPER MASS with Severity attribution
Upper-side observations may not be more frequent, but their conditional squared excursions are larger.
UPPER MASS with Reinforced attribution
Both observation frequency and conditional severity favor the upper side.
UPPER MASS with Offset attribution
One component favors the upper side while the other favors the lower side. The total upper mass reflects the net result.
Upper mass with SHIFT moving lower
The current level remains upper-dominant, but the latest window change is moving directional dispersion back toward the lower side.
Balanced MASS with active SHIFT
The current upper/lower mass level is near balance, but the most recent change is moving that balance toward one side.
These readings provide context. They do not prescribe an entry, exit, stop, position size, or trade direction.
Markers
The script uses sparse transition markers rather than marking every bar outside a wing.
Triangle above a bar
The selected Source has moved from inside to outside the upper wing.
Triangle below a bar
The selected Source has moved from inside to outside the lower wing.
Circle on an upper or lower wing
The selected Source has returned inside after being outside that wing.
Diamond on the basis
The selected Source moved directly from outside one wing to outside the opposite wing. This is consolidated into one Cross-Wing Jump event so the same bar does not receive duplicate excursion and re-entry markers.
Optional dominance markers
These identify a confirmed transition into upper-mass or lower-mass dominance.
Markers describe transitions across the calculated geometry. They are not buy or sell signals and do not imply that price will reverse, continue, or reach a target.
Alerts
Alert conditions are available for:
- Upper asymmetric excursion started
- Lower asymmetric excursion started
- Upper asymmetric re-entry
- Lower asymmetric re-entry
- Direct cross-wing jump to the upper side
- Direct cross-wing jump to the lower side
- Upper semivariance-mass dominance started
- Lower semivariance-mass dominance started
Confirmed Events Only is enabled by default.
With this setting enabled, markers and alerts wait for the bar to close. The asymmetric wings and visual readout continue to update during the forming bar.
Main settings
Source
Selects the price or indicator series analyzed by the script.
Attribution Length
Sets the rolling observation window.
Basis Type
SMA is the conventional statistical-center setting.
EMA, RMA, and WMA are provided as basis-relative research alternatives. When one of these alternatives is selected, the directional partial moments are measured around that selected moving basis rather than around the arithmetic sample mean.
Wing Multiplier
Scales the upper and lower stabilized wing distances.
The multiplier is not a confidence level.
Sparse-Side Stabilization
Controls how strongly a side with few observations is shrunk toward pooled dispersion.
A value of zero disables shrinkage when that side contains observations.
Wing Smoothing
Applies RMA smoothing to the displayed wing distances.
Attribution Smoothing
Smooths MASS, Frequency, and Severity diagnostics to reduce one-bar flicker.
Dominance Entry and Release Thresholds
Create hysteresis around the upper-mass, balanced, and lower-mass states.
Minimum Observations Per Side
Sets the minimum sample required on both sides before Severity is compared.
Mass Shift Smoothing
Smooths the Frequency and Severity components of the one-bar SHIFT calculation.
Mass Shift Significance Threshold
Controls when a SHIFT component is displayed as materially active.
Mass Shift Driver Dominance Ratio
Controls how much larger one component must be before it is classified as the dominant SHIFT driver.
Edge Zone Starts At
Defines when STRETCH is considered near an upper or lower wing.
Containment Lookback
Sets the rolling window for realized containment.
Visual settings
Allow the user to control wing visibility, split fills, the optional state rail, dominant-wing glow, classic symmetric reference, line widths, transparency, colors, readout position, text size, and price-axis clearance.
Live-bar behavior
The script does not request higher-timeframe data, use lookahead logic, or intentionally access future bars.
Historical calculations use the chart's available data and the selected settings.
During the current forming bar:
- Wings can change
- MASS can change
- ATTRIB can change
- SHIFT can change
- STRETCH can change
- WINGS can change
- NOW can change
This is normal real-time indicator behavior.
When Confirmed Events Only is enabled, transition markers and alerts are recorded only after bar close. Disabling that setting allows intrabar events, which can appear and disappear before the bar closes.
Data Window outputs
The script provides research values in the Data Window, including:
- Semivariance Mass Bias
- Observation Frequency Bias
- Conditional Severity Bias
- Upper Semivariance Share
- Lower Semivariance Share
- Asymmetric Side-Normalized Stretch
- Upper Stabilized Wing Distance
- Lower Stabilized Wing Distance
- Realized Envelope Containment
- Side Sample Adequacy
- Smoothed Directional Mass Shift
- Flow Bridge Identity Residual
The Flow Bridge Identity Residual allows users to inspect the numerical consistency of the raw one-bar frequency/severity decomposition. Small non-zero values can occur because of floating-point arithmetic.
Limitations
This indicator is backward-looking and descriptive. It does not estimate the probability of future price direction, reversals, breakouts, continuation, or profitability.
The primary wings are not conventional Bollinger Bands and are not confidence intervals.
The Wing Multiplier does not imply a 68%, 95%, or 99% probability range.
Realized containment is calculated from past rolling observations and does not guarantee future containment.
The rolling statistics compare historical observations with the current selected basis for each calculation window. They do not compare every historical observation with the basis value that existed on that historical bar.
SMA provides the conventional arithmetic-center interpretation. EMA, RMA, and WMA create basis-relative research variants whose partial moments should not be interpreted as conventional sample semivariance around the arithmetic mean.
Conditional Severity requires observations on both sides. When one side does not meet the configured minimum sample, the script displays Sparse and S? instead of treating the missing comparison as neutral evidence.
Sparse-Side Stabilization intentionally modifies displayed wing geometry when a side has few observations. It does not modify the raw attribution statistics.
Smoothing reduces visual noise but introduces lag.
Results depend on the selected Source, length, basis, multiplier, thresholds, market, timeframe, and available data.
For conventional interpretation, use standard time-based charts. Synthetic chart types can change the input price series and therefore change calculations and alerts.
A movement outside a wing does not necessarily indicate overbought, oversold, exhaustion, breakout confirmation, reversal, or continuation.
This indicator should be used as an analytical context tool alongside the user's own market structure, execution, and risk-management process.
Open-source transparency
The script is published open-source so users can inspect the calculations, verify the attribution identities, review the stabilization logic, study the Data Window outputs, and modify the available research settings.
The indicator provides measurements and alerts only. It does not place orders, simulate performance, report a win rate, or guarantee trading results. Indicatore

Modern Squeeze Momentum [GBB]MODERN SQUEEZE MOMENTUM
A rework of the Squeeze Momentum Indicator with an adaptive length, graded compression, normalised momentum, a qualified-release filter and a higher-timeframe context layer. Classic mode reproduces the original exactly.
The Squeeze Momentum Indicator (LazyBear's open-source implementation of John Carter's TTM Squeeze) is one of the most used free scripts on TradingView, and for good reason: Bollinger Bands inside Keltner Channels is a clean, intuitive way to spot compression before expansion. It also has four well-known limitations:
- The length is fixed at 20 bars regardless of the market's current cycle.
- The squeeze is binary. A hair inside the Keltner Channel counts the same as an extreme contraction.
- Momentum is in price units, so a reading of 15 on gold and 0.0004 on EURUSD tell you nothing comparable, and no fixed threshold works across symbols.
- Every squeeze release fires, whether or not price actually did anything.
This script keeps the original as its base (Layer 0) and adds five layers on top. Each layer has its own on/off switch so you can see exactly what each one changes.
HOW IT WORKS
Layer 0 - Classic base
Bollinger Bands (SMA +/- 2.0 standard deviations) and Keltner Channels (SMA +/- 1.5 x SMA of true range). Momentum is the linear regression of close minus the midpoint of the Donchian midline and the SMA, exactly as in the original.
Layer 1 - Adaptive length
Instead of a fixed 20, the length follows the dominant cycle measured by the Ehlers Homodyne Discriminator on (high + low) / 2. The cycle estimate is smoothed with a short EMA, clamped to a 12-40 bar range, and rounded. All bands and the momentum calculation use this length, so the indicator tightens in fast markets and widens in slow ones.
Layer 2 - Graded compression
The ratio Bollinger width / Keltner width is percentile-ranked over the last 150 bars. Three grades: light (bottom 30%), medium (bottom 15%), tight (bottom 5%). The zero-line dot grows and changes colour with the grade, and a duration counter tracks how many bars the squeeze has lasted. With this layer off, the classic binary test (BB inside KC) is used.
Layer 3 - Normalised momentum
Momentum is divided by the Keltner range, so the histogram is in "Keltner-range units". A reading of 1.0 means the same thing on BTC 1h, gold 15m and EURUSD 1h. Reference lines at +/-0.5 and +/-1.0 are drawn for orientation. The momentum threshold used in Layer 4 is set in the same units.
Layer 4 - Qualified release
A raw release is simply the squeeze ending. A qualified release additionally requires, on the release bar:
- momentum direction agrees with the bar direction (close vs open),
- absolute momentum is at or above the threshold (default 0.5),
- the squeeze lasted at least the minimum number of bars (default 3),
- close breaks the high (long) or low (short) of the range that formed during the squeeze.
Qualified releases are drawn as solid triangles (green up, red down). Unqualified releases are drawn as small grey dots so you can see what the filter removed. Turn the layer off and every release fires, as in the original.
Layer 5 - Context
HTF wash: the full layer stack is evaluated on a higher timeframe (default 4x the chart timeframe, or pick your own). When the higher timeframe is in a squeeze, the pane background is tinted, darker for tighter grades. Only closed higher-timeframe bars are used, lookahead is off. If the chosen HTF is not above the chart timeframe, a label says so and the wash is disabled.
Stats table: running counts on the loaded bars. Number of squeezes, raw vs qualified releases, hit rate (did close move in the release direction after H bars) and range multiple (the H-bar range after a qualified release, in ATR, relative to the H-bar range of all bars). H defaults to 10 bars.
READING THE PANE
- Histogram: the four original states are kept. Positive and rising, positive and falling, negative and falling, negative and rising, each in its own colour.
- Zero-line dot: small blue-grey = no squeeze; yellow / orange / red and increasingly large = light / medium / tight squeeze.
- Triangles: qualified release, long below the histogram, short above.
- Grey dots: releases that did not pass the filter.
- Background tint: the higher timeframe is in a squeeze.
- Reference lines: +/-0.5 and +/-1.0 Keltner-range units (only drawn when Layer 3 is on).
Three palettes: GBB (default), LazyBear (original colours) and Mono.
CLASSIC MODE
One switch in the General group turns Layers 1-4 off, sets the fixed length, and reproduces the original Squeeze Momentum Indicator histogram and squeeze dot. Combine it with the LazyBear palette if you want the familiar look. It is there so you can check for yourself what the added layers do and do not change.
ALERTS
Five alert conditions, all evaluated on confirmed bars only:
- Squeeze started (message includes the grade)
- Squeeze released (raw)
- Qualified release - long
- Qualified release - short
- HTF squeeze started / released
REPAINTING
Releases, markers, alerts and table counts are evaluated on confirmed bars. The higher-timeframe layer uses closed HTF bars only. The adaptive length and the percentile rank depend on recent history, so values on the current bar can move until it closes, like any indicator that uses the live bar.
SETTINGS OVERVIEW
- General: Classic mode.
- Adaptive length (Layer 1): on/off, min and max length, fixed length for when the layer is off.
- Bands: BB and KC multipliers.
- Compression (Layer 2): percentile ranking on/off, rank window, light / medium / tight percentiles, minimum squeeze bars.
- Momentum (Layer 3): normalisation on/off, momentum threshold.
- Release (Layer 4): qualified filter on/off, require range break, show unqualified releases.
- Context (Layer 5): HTF wash on/off, HTF selection, stats table on/off, stats horizon.
- Visual: palette.
CREDITS
- John Carter for the TTM Squeeze concept.
- LazyBear for the open-source Squeeze Momentum Indicator that this script extends. Layer 0 and Classic mode are his logic.
- John F. Ehlers for the Homodyne Discriminator (Rocket Science for Traders).
Open source. No hype, just data. Nothing here is a trade recommendation; a squeeze tells you volatility contracted, not which way it will expand. Indicatore

DNSE VN301!, BB-SMA Trend Following "Bollinger Bands Breakout with SMA Trend Filter" is a volatility-based trend-following strategy designed to capture strong directional price movements when price breaks beyond its recent volatility range. The strategy uses Bollinger Bands with a default SMA(20) basis and 2.0 standard deviations to identify bullish breakouts above the upper band and bearish breakouts below the lower band.
To improve signal quality, the strategy combines Bollinger Band breakouts with a mandatory SMA(200) trend filter, allowing Long trades only when the SMA is rising and Short trades only when it is falling. By combining volatility expansion with broader trend confirmation, the strategy seeks to reduce counter-trend and false breakout signals while participating in stronger intraday movements. It also includes configurable stop loss, take profit, trading session, trade direction, and automatic end-of-session position closure for disciplined risk management.
Strategy settings and configuration:
Chart timeframe: recommended 5-minute chart
Position size: 3 contracts
Bollinger Bands length: 20
Bollinger Bands multiplier: 2.0
SMA length: 200
Stop loss: 10 points
Take profit: 20 points
SMA trend filter: always enabled
Take profit: On / Off
Time filter: On / Off
Trading session: 09:00 – 14:30
Trade direction: Long / Short / Both
Default script settings:
The strategy calculates Bollinger Bands using the SMA(20) of the closing price. The upper and lower bands are created by adding or subtracting two standard deviations around the middle line.
When the closing price breaks above the upper Bollinger Band, buying pressure may be taking control. When the closing price breaks below the lower Bollinger Band, selling pressure may be taking control.
SMA(200) is used as the main trend filter. When SMA(200) is rising, the script only allows Long trades. When SMA(200) is falling, the script only allows Short trades.
In CNPS 04, the SMA(200) filter is always enabled. This helps the bot filter out breakout signals that go against the longer-term trend.
Users can add the built-in Bollinger Bands indicator on TradingView with Length 20 and Multiplier 2.0 to visually monitor the signal on the price chart.
Entry and exit rules:
Long entry:
Closing price > upper Bollinger Band
AND SMA(200) is rising
AND the signal appears during the trading session
AND trade direction allows Long entries
Long exit:
Stop loss: 10 points from entry price
Take profit: 20 points from entry price, if enabled
Opposite breakout signal appears
Reversal when a valid Short signal appears
Automatic position close at the end of the trading session
Short entry:
Closing price < lower Bollinger Band
AND SMA(200) is falling
AND the signal appears during the trading session
AND trade direction allows Short entries
Short exit:
Stop loss: 10 points from entry price
Take profit: 20 points from entry price, if enabled
Opposite breakout signal appears
Reversal when a valid Long signal appears
Automatic position close at the end of the trading session
Risk disclaimer:
Futures trading involves a high level of risk and prices can move sharply. This script is provided for reference, research, and backtesting purposes only. Users should fully understand derivatives trading, their own risk tolerance, and the strategy logic before applying it to live trading.
All investment decisions are the responsibility of the user. phaisinh.online is not responsible for any losses arising from the use of this strategy in real trading. Past performance does not guarantee future results.
_________________________________________________________________
"Bollinger Bands Breakout với Bộ lọc Xu hướng SMA" là một chiến lược giao dịch theo xu hướng dựa trên biến động, được thiết kế nhằm nắm bắt các chuyển động giá mạnh theo một hướng khi giá phá vỡ khỏi vùng biến động gần nhất. Chiến lược sử dụng Bollinger Bands với đường cơ sở mặc định là SMA(20) và 2,0 độ lệch chuẩn để xác định tín hiệu bứt phá tăng khi giá vượt lên trên dải trên và tín hiệu bứt phá giảm khi giá xuống dưới dải dưới.
Để nâng cao chất lượng tín hiệu, chiến lược kết hợp tín hiệu bứt phá Bollinger Bands với bộ lọc xu hướng SMA(200) bắt buộc, chỉ cho phép giao dịch Long khi SMA đang dốc lên và giao dịch Short khi SMA đang dốc xuống. Bằng cách kết hợp sự mở rộng của biến động với xác nhận xu hướng tổng thể, chiến lược hướng tới việc giảm thiểu các tín hiệu giao dịch ngược xu hướng và các tín hiệu phá vỡ giả, đồng thời tận dụng các chuyển động intraday mạnh hơn. Chiến lược cũng bao gồm các tùy chọn Stop Loss, Take Profit, khung thời gian giao dịch, hướng giao dịch và cơ chế tự động đóng vị thế khi kết thúc phiên, nhằm đảm bảo quản trị rủi ro một cách chặt chẽ và có kỷ luật.
Cài đặt & cấu hình chiến lược:
Biểu đồ: khuyến nghị khung 5 phút
Khối lượng giao dịch: 3 hợp đồng
Chu kỳ Bollinger Bands: 20
Hệ số nhân Bollinger Bands: 2.0
Chu kỳ SMA: 200
Cắt lỗ: 10 điểm
Chốt lời: 20 điểm
Bộ lọc xu hướng SMA: luôn bật
Dùng chốt lời: Bật / Tắt
Bộ lọc giờ: Bật / Tắt
Khung giờ giao dịch: 09:00 – 14:30
Chiều giao dịch: Mua / Bán / Cả hai
Cài đặt mặc định của script:
Chiến lược tính toán Bollinger Bands dựa trên đường SMA(20) của giá đóng cửa. Dải trên và dải dưới được tạo bằng cách cộng hoặc trừ hai độ lệch chuẩn quanh đường giữa.
Khi giá đóng cửa vượt lên trên dải trên Bollinger Bands, lực mua có thể đang chiếm ưu thế. Khi giá đóng cửa phá xuống dưới dải dưới Bollinger Bands, lực bán có thể đang chiếm ưu thế.
SMA(200) được dùng làm bộ lọc xu hướng chính. Khi SMA(200) dốc lên, script chỉ cho phép lệnh Mua. Khi SMA(200) dốc xuống, script chỉ cho phép lệnh Bán.
Trong CNPS 04, bộ lọc SMA(200) luôn bật. Điều này giúp bot loại bỏ bớt các tín hiệu breakout đi ngược xu hướng dài hạn.
Người dùng có thể thêm chỉ báo Bollinger Bands có sẵn trên TradingView với tham số Length 20 và Multiplier 2.0 để quan sát tín hiệu trực quan trên biểu đồ giá.
Điều kiện vào và thoát lệnh:
Vào lệnh Mua:
Giá đóng cửa > dải trên Bollinger Bands
VÀ SMA(200) dốc lên
VÀ tín hiệu xuất hiện trong khung giờ giao dịch
VÀ chiều giao dịch cho phép lệnh Mua
Thoát lệnh Mua:
Cắt lỗ: 10 điểm từ giá vào lệnh
Chốt lời: 20 điểm từ giá vào lệnh, nếu bật
Có tín hiệu breakout ngược chiều
Đảo chiều khi xuất hiện tín hiệu Bán hợp lệ
Tự động đóng lệnh khi hết khung giờ giao dịch
Vào lệnh Bán:
Giá đóng cửa < dải dưới Bollinger Bands
VÀ SMA(200) dốc xuống
VÀ tín hiệu xuất hiện trong khung giờ giao dịch
VÀ chiều giao dịch cho phép lệnh Bán
Thoát lệnh Bán:
Cắt lỗ: 10 điểm từ giá vào lệnh
Chốt lời: 20 điểm từ giá vào lệnh, nếu bật
Có tín hiệu breakout ngược chiều
Đảo chiều khi xuất hiện tín hiệu Mua hợp lệ
Tự động đóng lệnh khi hết khung giờ giao dịch
Tuyên bố rủi ro:
Giao dịch hợp đồng tương lai có mức độ rủi ro cao và giá có thể biến động mạnh. Script này chỉ phục vụ mục đích tham khảo, nghiên cứu và kiểm thử. Người dùng cần hiểu rõ giao dịch phái sinh, khẩu vị rủi ro cá nhân và logic của chiến lược trước khi áp dụng vào giao dịch thực tế.
Mọi quyết định đầu tư thuộc trách nhiệm của người dùng. phaisinh.online không chịu trách nhiệm cho bất kỳ khoản lỗ nào phát sinh từ việc sử dụng chiến lược này trong giao dịch thực tế. Hiệu quả trong quá khứ không đảm bảo kết quả trong tương lai.
Strategia

Oleg AlgoWelcome to Oleg Algo, a heavy-duty, multi-layered statistical mean-reversion and trend-following strategy designed for traders who like to scale into volatility like a crazy. This script allows you to harvest profits from market extremes using dynamic gap thresholds, aggressive scale-in martingale sizing, and built-in risk boundaries.
Key Features
Dual Strategy Modes: Switch effortlessly between Reversal Mode (catching extreme overextended moves by fading the gap) and Trending Mode (riding the momentum wave).
Flexible Band Calculations: Measure market boundaries using either ATR (Average True Range) for pure volatility-based distance or Bollinger Bands (Standard Deviations) for statistical dispersion.
Scale-In Martingale System: Automatically scale into positions as the market moves against you. Choose between an exponential Multiplier or a linear Quantity Step to average down like a true strategist.
Win/Loss Outcome Sizing: Optionally adjust your base position size up or down following a win or loss to dynamically manage your exposure streak.
Time Windows: Built-in EST market-session filters that strictly lock your trading window and automatically flatten all open positions before the closing bell rings.
Max Dollar Loss Circuit Breaker: An absolute safety switch that liquidates everything if unrealized open drawdowns cross your predefined dollar risk threshold.
Input Guide
Strategy Execution Mode: Choose whether we hunt the reversal when price crashes hard away from the line, or follow the big bear/bull wave.
Trade Direction: What kind of hunt we do—go both ways like a smart trader, or stick strictly to long-only or short-only.
Moving Average Type & Length: Pick your line flavor (SMA, EMA, HMA).
Band Calculation & Initial Gap: Define how far price must run away from the baseline before enter trade.
Scale-In Step & Martingale Settings: Control how deep price must drop before adding more size, and how aggressively each stacked layer grows.
Take Profit & Stop Loss Multipliers: Set your distance for collecting big feasts when the average entry price bounces back, alongside the emergency parachute stop loss.
Prop Mode & Start/End Times: Lock your trading strictly inside capitalist working hours so you never violate risk rules or hold overnight risk. Strategia

RSI with Bollinger BandsRSI with Bollinger Bands combines the Relative Strength Index with Bollinger Bands calculated directly on the RSI itself.
This indicator is designed to help identify periods when RSI momentum becomes unusually stretched relative to its recent behavior, instead of relying only on the traditional fixed 30 and 70 RSI levels.
The RSI is displayed together with a Bollinger Band basis, upper band, and lower band. When RSI moves outside the bands, the indicator can display overbought or oversold breach signals and highlight the background.
Features
RSI oscillator
Standard RSI calculation
Default RSI Length: 14
Adjustable price source
Bollinger Bands on RSI
Bollinger Bands are calculated from the RSI value
Default BB Length: 20
Default Upper Multiplier: 2.0
Default Lower Multiplier: 2.0
Upper and lower multipliers can be adjusted independently
Overbought Breach Signals
Displays an OB signal when RSI moves above the upper Bollinger Band
Red background highlighting can appear during the condition
Oversold Breach Signals
Displays an OS signal when RSI moves below the lower Bollinger Band
Green background highlighting can appear during the condition
Traditional RSI Reference Levels
70 level
50 level
30 level
These levels can be shown or hidden
Customizable Display
Show or hide breach signals
Show or hide the Bollinger Band fill
Show or hide the 30 / 50 / 70 RSI levels
Settings
Length
Controls the RSI calculation period.
Default: 14
BB Length
Controls the lookback period used to calculate the Bollinger Band basis and standard deviation on RSI.
Default: 20
BB Up
Controls the standard-deviation multiplier for the upper Bollinger Band.
Default: 2.0
BB Down
Controls the standard-deviation multiplier for the lower Bollinger Band.
Default: 2.0
Price Source
Selects the price source used for the RSI calculation.
Default: Close
Show Breach Signals
Turns the OB and OS markers on or off.
Fill Bands
Turns the shaded area between the upper and lower Bollinger Bands on or off.
Show RSI 30/50/70 Levels
Turns the traditional RSI reference levels on or off.
How to Read the Indicator
When RSI moves above the upper Bollinger Band, it means RSI is unusually strong relative to its recent range. This can indicate elevated bullish momentum or a potentially overextended condition.
When RSI moves below the lower Bollinger Band, it means RSI is unusually weak relative to its recent range. This can indicate elevated bearish momentum or a potentially oversold condition.
The traditional 30 and 70 RSI levels remain available as additional reference points.
Alerts
The indicator includes built-in alert conditions for:
RSI Above Upper Band
RSI Below Lower Band
These alerts can be used to notify you when RSI breaches either Bollinger Band.
Important
A breach of the upper or lower band should not automatically be treated as a reversal signal. Strong trends can keep RSI extended for a significant period.
This indicator is best used together with price action, trend analysis, support and resistance, volume, or other forms of confirmation.
For educational and informational purposes only. This indicator does not constitute financial advice. Indicatore

SPMA Trend | NAL1. Overview
SPMA Trend | NAL is an adaptive trend and volatility framework built around the Shock Percentile Moving Average.
Unlike a conventional moving average that continuously follows price, the SPMA selectively updates when the current price change ranks above a configurable percentile of recent returns. This creates an event-driven baseline that places greater emphasis on stronger positive price shocks while holding its previous value during lower-ranked movement.
SPMA Trend expands this concept with adaptive volatility bands, asymmetric shock modeling, empirical quantile boundaries, and optional slope confirmation to form a complete directional regime model.
2. Core Calculation
The SPMA begins by ranking the current price change against its recent historical distribution.
Ret = close - close
Per = ta.percentrank(Ret, percentrank_lookback)
Gate = Per > percentile_gate
When the percentile gate is satisfied, the baseline updates to the current EMA value. Otherwise, it retains its previous level.
MA := na(MA ) ? emaValue : Gate ? emaValue : MA
This produces a persistent baseline whose movement is concentrated around stronger ranked price events rather than every fluctuation in price.
3. Adaptive Volatility Framework
SPMA Trend surrounds the baseline with a configurable volatility structure.
Five volatility models are available:
Standard Deviation — measures dispersion around the mean.
ATR — measures price-range volatility.
Mean Absolute Deviation — measures average absolute dispersion.
Median Absolute Deviation — provides a more robust measure of dispersion with reduced sensitivity to extreme observations.
Quantile — constructs the upper and lower boundaries from the empirical distribution of historical price deviations from the SPMA.
The Quantile model is inherently asymmetric. Positive and negative residuals are evaluated separately, allowing each side of the structure to reflect its own historical distribution.
residual = close - SPMA
= f_quantile_volatility(residual, VolLen, QuantilePct)
For the conventional volatility models, an optional asymmetric mode analyzes positive and negative log-return shocks independently. This allows upper and lower volatility expansion to respond differently when the distribution of market shocks becomes unbalanced.
The resulting volatility estimate is applied around the SPMA to create the final adaptive boundaries.
upperBand = SPMA + finalUpper * VolMul
lowerBand = SPMA - finalLower * VolMul
4. Signal Structure
The bullish regime is deliberately selective.
Price must break above the upper volatility boundary while the SPMA itself is rising. When enabled, the percentage slope of the SPMA must also exceed the configured slope threshold.
if SPMA > SPMA and close > upperBand and (UseSlope ? SlopeGate : true)
NAL := 1
A bearish regime is established when price moves below the lower adaptive boundary.
if close < lowerBand
NAL := -1
Between qualifying transitions, the previous directional state is retained. This converts individual volatility-band events into a persistent trend regime rather than a sequence of isolated crossover signals.
5. Key Features
Shock-percentile adaptive baseline.
Event-driven rather than continuously updating trend structure.
Five selectable volatility models.
Mean and median absolute-deviation volatility.
Empirical asymmetric residual quantiles.
Optional positive/negative shock-adjusted volatility bands.
Configurable SPMA slope confirmation.
Persistent bullish and bearish regime states.
Adaptive band, glow, fill, and candle visualization.
6. Use
SPMA Trend is designed as a specialized trend-regime component within a broader systematic framework.
The indicator combines three distinct layers of information: the significance of recent price movement determines when the baseline adapts, the volatility model determines how far price must expand from that structure, and the optional slope gate measures whether the underlying SPMA is developing with sufficient positive directional strength.
This creates a framework centered on identifying meaningful expansion away from an event-driven price structure rather than responding to every short-term movement.
Its primary value is as a distinct structural layer within a complete strategy architecture, where shock significance, volatility expansion, and directional development can be integrated with other independent forms of market information. Indicatore

Intraday Pullback Sniper (BB, Stoch RSI, Liquidity, HTF)An intraday entry-timing indicator.
It looks for pullbacks into a Bollinger band in the direction of the higher-timeframe bias — buying dips in an up regime, selling rallies in a down one — and marks the candle where the pullback has run far enough and the lower-timeframe structure has turned back.
It marks conditions. It does not place stops, targets or position sizes, and it does not tell you to buy. That decision stays with you.
TWO DOTS, AND THE DIFFERENCE BETWEEN THEM IS THE WHOLE IDEA
A small dot means a setup is armed. Four conditions on the same candle: the wick touched a band, the candle closed back inside and in the half that faces that band, the Stoch RSI was at its extreme within the last few candles, and the bias allows that direction. Read it as "price bounced off the band, I am watching."
A large dot means every enabled condition is met. On top of a setup still running from an earlier candle it needs the structure of the entry timeframe to have confirmed the turn, a second band touch with a rejection on this very candle, the bias, the liquidity sweep if you require one, an open session, and the cooldown after the last signal to have passed. Read it as "price did it a second time, and the structure turned in between."
The decisive part is the time gap. The band has to be touched twice, and the structure has to confirm between the two. A large dot can therefore never appear on the same candle as its own small dot — the following one at the earliest. A new small dot on a signal candle is normal: that candle meets the setup conditions as well, so it arms the next setup while the current one fires.
WHAT IT DRAWS
On the price chart: Bollinger Bands, the bias EMA, setup and signal dots with the price they occurred at, swing labels (HH / HL / LH / LL), market structure (BOS / CHOCH / MSB) for several timeframes, liquidity levels named by side and rank, and session boxes sized to the high and low each session made.
In its own pane: the Stoch RSI the logic actually runs on, its levels, dots at the extremes, the bias as a background tint, and a strip along the bottom that runs for as long as a setup is still waiting for its signal.
HOW SWINGS ARE FOUND
Everything structural — swing labels, market structure and liquidity — comes from one single engine using the classical definition of a turning point. A swing high is the highest candle of a window with the same number of candles on its left and on its right, so it is a local extreme in the literal sense. It is confirmed and never repainted, at the cost of a delay equal to that window.
Highs and lows strictly alternate. A second point of the same kind before the opposite one does not open a new leg; it replaces the current one if it is more extreme, otherwise it is discarded. Two degrees are calculated: a short one with a lookback of 2, the classic fractal, and a longer one for the larger move.
Structure breaks are judged on the close, never on wicks. A break with the prevailing direction is a BOS, one against it a CHOCH; both are MSB events.
Liquidity levels are swing points price has not closed beyond. Once a candle of that timeframe closes through a level, the orders resting there have been filled and the level is dropped. A wick through it with a close back on the old side is a sweep, not a break, so the level survives and is marked as swept.
HOW TO USE IT
Put the chart on the setup timeframe, 5 minutes by default. The entry timeframe must be lower than the chart; its candles are read from inside each chart candle. All higher-timeframe data comes from closed candles only, and signals are evaluated at the close of a chart candle, never intrabar.
The 5-minute default describes the preset, not a limit. Every timeframe is adjustable — a 15m chart with a 1H bias and 5m entry structure works the same way. The status table tells you if the chart and the setup timeframe do not match.
For alerts, pick "Any alert() function call" with the trigger "Once Per Bar Close". One alert then covers both directions, and the message carries symbol, direction, price, bias, setup direction, structure state, sweep and session. Separate SNIPER LONG and SNIPER SHORT conditions exist as well.
Every setting has a tooltip. Group 0 holds a glossary of the labels and a short guide to the alerts.
ON THE DEFAULTS
The defaults are deliberately on the safe side and the strict bias is on. If you get too few signals, switch conditions off one at a time and watch what changes — that is far more instructive than loosening several at once. The liquidity sweep is the one filter that is off by default; switch it on for the stricter variant.
LIMITATIONS, HONESTLY
Lower-timeframe data on TradingView is limited to a few months of intrabar history depending on your plan. Further back the entry structure and the signals that depend on it are missing, while everything else keeps drawing normally.
A swing is only confirmed after its window has passed, so the most recent candles cannot carry a label yet. That delay is the price of never repainting, and it is not a bug.
The indicator needs no volume, so it works on CFDs, forex and futures alike. It assumes continuous trading without large gaps — on instruments that gap overnight a band touch can come from the opening gap rather than from a rejection, and the logic is of little use there.
Suited to liquid, continuously traded instruments: index CFDs, major crypto, major forex pairs, liquid futures. On crypto the sessions carry no meaning; either switch all three off or trade the overlapping hours deliberately.
This is a tool for your own analysis, not financial advice. Past behaviour of any setup says nothing about future results. Indicatore

Aurora_Channel_V1█ Overview
The Aurora Channel is an adaptive multi-layer volatility and expansion framework that fuses Bollinger Bands, Keltner Channels, volume-sensitive dynamics, and intelligent moving-average selection into a single coherent system.
Instead of treating channels as static statistical boundaries, Aurora continuously evaluates market behavior, selects the most suitable moving-average engine in real time, expands or contracts outer envelopes according to volume and width regimes, and projects dynamic trigger and crossover levels that respond to actual price action.
The result is a hybrid channel system that blends:
• Adaptive MA selection (Auto / Adaptive Scoring)
• Volume-modulated Keltner expansion
• Hybrid Bollinger–Keltner “Aurora” bands
• Multi-layer expansion envelopes
• Peak-aware or dynamically tracking Trigger Channel
• Crossover Multiplier Engine with adaptive overlays
• Regime-aware visuals and a live Dashboard HUD
█ Why is this one unique
Most channel indicators are fixed formulas. Aurora is a full adaptive channel engine built in Pine Script v6.
It does not simply plot Bollinger or Keltner bands. It constructs a hybrid core, surrounds it with volume-aware expansion logic, maintains intelligent outer triggers, and generates dynamic crossover projection lines whose multiplier is itself adaptive.
⚪ What it does
At a high level:
Auto MA Selection Engine
Continuously scores SMA, EMA, RMA (SMMA), WMA, and VWMA candidates using a combined lag-error + jitter penalty. The engine automatically selects the MA with the lowest overall score (or lets the user force a manual choice). This becomes the center line for every subsequent calculation.
Hybrid Aurora Core
Builds classic Bollinger Bands and a volume-sensitive Keltner Channel around the selected midline. The Keltner multiplier dynamically expands between 3.0–4.0 during volume spikes. The difference between the two outer bands is then smoothed and re-applied, creating the final Aurora Upper / Lower bands.
Expansion Envelope
Measures the current Aurora width, smooths it, and projects outer envelope levels that react to both width expansion and tick-volume intensity. Optional “Breakouts Only” mode shows the envelope solely when price is already expanding beyond the Aurora bands.
Trigger Channel
Two memory modes:
• Dynamic Tracking – continuously follows expansion and decays when price returns inside.
• Hold Peak Level – latches the highest/lowest expansion extremes.
A proportional buffer is then added, creating clean outer trigger lines.
Crossover Multiplier Engine
Monitors crosses of a user-selected target (Midline, Aurora Bands, Envelope, or Trigger). On every cross it captures the current Keltner multiplier × volume ratio, latches that value, smooths it with the same adaptive MA engine, and projects symmetric overlay lines around the midline. These act as adaptive reaction / target levels.
Multi-Layer Clouds + Regime Visuals
Soft gradient fills between midline → Aurora and Aurora → Envelope, plus a softer fill toward the Trigger. Candles are colored by regime (above/below midline). A compact Dashboard HUD displays the active MA, cross target, current multiplier, expansion state, and regime.
⚪ Why it is good
The strongest aspect is the combination of adaptive center selection, volume-aware expansion, and quality-aware outer structures in one coherent framework.
Most channel tools are either pure statistical (Bollinger) or pure volatility (Keltner/ATR). Aurora merges both, then adds intelligent memory (Trigger modes) and a live crossover-driven multiplier engine. The visual hierarchy (multi-layer clouds) makes regime and expansion instantly readable, while the Dashboard keeps the key adaptive values visible without cluttering the chart.
⚪ What makes it sophisticated
• Real-time adaptive MA scoring with lag + jitter penalty
• Dynamic Keltner multiplier driven by volume ratio
• Hybrid band construction that re-injects smoothed BB–KC difference
• Dual-mode Trigger memory (peak hold vs continuous tracking + decay)
• Crossover-triggered multiplier latching and adaptive projection
• Multi-layer gradient fills that scale with the actual channel hierarchy
• Non-repainting alerts on confirmed crosses
⚪ Why It’s Marketable
Traders looking for more than a simple Bollinger or Keltner band receive a complete adaptive channel ecosystem. The Auto MA engine removes the endless debate of “which MA is best,” the Expansion Envelope and Trigger Channel give clear breakout and reaction zones, and the Crossover Multiplier Engine turns every significant cross into dynamic, volume-aware target lines. The result is a selective, visually rich, and highly configurable system that adapts to the instrument and timeframe instead of forcing a fixed formula onto every market.
⚪ Main weakness
The system is still rule-based adaptive logic, not deep learning. Performance depends on the chosen lengths, the quality of volume data (especially on tick-volume charts), and the current market regime. Over-optimization of the many parameters can reduce robustness.
█ How It Works
⚪ Auto MA Selection Engine
Scores five classic moving averages on tracking error (squared lag) plus a jitter penalty. The lowest combined score becomes the active center line used by every channel component.
⚪ Aurora Core Construction
• Midline = selected MA
• Bollinger = midline ± StdDev × multiplier
• Keltner = midline ± ATR × volume-modulated multiplier (3.0–4.0)
• Aurora bands = Keltner ± smoothed (BB – KC) difference
⚪ Expansion Envelope
Average Aurora width is multiplied by a base factor and further expanded by excess volume. The resulting offset is added outside the Aurora bands. Optional breakout-only plotting keeps the chart clean until genuine expansion occurs.
⚪ Trigger Channel
On expansion the system either latches the extreme (Hold Peak) or follows and slowly decays the level (Dynamic Tracking). A proportional buffer creates the final trigger lines.
⚪ Crossover Multiplier Engine
Detects crosses of the chosen target, captures kcMult × volRatio, latches the value, smooths it with the adaptive MA engine, and projects midline ± ATR × smoothed multiplier as dotted overlay lines.
█ How To Use
• Use the Aurora bands as the primary dynamic support/resistance zone.
• Watch the Expansion Envelope for genuine volatility breakouts.
• Treat the Trigger Channel as outer reaction / invalidation levels.
• The Crossover Multiplier lines act as adaptive targets or reaction zones after significant crosses.
• Candle color and the Dashboard HUD give instant regime and state information.
• Enable alerts on the crossover condition for automated notifications.
█ Settings
Auto MA Selection Engine
• MA Selection Engine (Auto Adaptive / Manual)
• Manual MA type
• Jitter Penalty strength
Core Channel Engine
• Base Center Length
• Bollinger StdDev multiplier
• Keltner ATR Length
• Tick Volume MA Length & Expansion Factor
• Band Difference MA Length
Expansion Envelope
• Show / Breakouts Only
• Expansion MA Length
• Envelope Base Multiplier & Volume Boost
Trigger Channel
• Show Trigger
• Buffer Multiplier
• Memory Mode (Dynamic Tracking / Hold Peak Level)
Crossover Multiplier Engine
• Show Dynamic Lines
• Cross Monitoring Target
• Multiplier MA Smoothing Length
Visual Settings
• Candle Coloring
• Multi-Layer Cloud
• Dashboard HUD
• Full color customization for every layer
█ Disclaimer
The content provided in this script is for educational and informational purposes only. It does not constitute financial advice, investment recommendations, or a solicitation to buy or sell any financial instruments. Past performance is not indicative of future results. All trading involves risk, and you are solely responsible for your own trading decisions. Indicatore

Volatility Expansion Score (0-4) v2.2 [TotoMazter]Volatility Expansion Score (0-4)
WHAT IT IS
This indicator detects one specific market state: a compressed market whose calm is starting to break. It scores every closed bar from 0 to 4, one point per condition:
Compressed regime — ATR% in the lower tercile of its own last 500 bars
Expansion starting — ATR% higher than on the previous bar
Narrow Bollinger Bands — band width in the lower tercile of its last 120 bars
Volume waking up — tick volume above its 100-bar mean (z-score > 0)
Score 3 (orange) is the signal threshold; score 4 (red) is a full trigger. Everything is self-normalized (rolling percentiles and z-scores, no absolute levels), so the indicator needs no recalibration across price regimes: in our research it behaved the same with gold at 1,800 and at 4,800.
WHAT IT DOES NOT DO — READ THIS FIRST
It does NOT predict direction. In the research program behind this script, the directional question was tested three separate ways on 14 years of XAUUSD minute data — 132 technical variables, a dedicated 40-feature study (intraday synthetic dollar index, gold/silver lead-lag, compression context, M1 microstructure, path features), and real aggressor order flow from COMEX gold futures — and all three came back null. A 4/4 score says "an impulse is more likely than usual", never which way. Any use of this tool as a bullish/bearish signal is outside what was validated.
It also does not promise big moves in dollar terms. The signal fires when ATR is compressed (about 0.83x its normal level), and the subsequent move measured in % of price is slightly SMALLER than average (about 0.97x). What increases is the move relative to current volatility. If you size stops and targets in ATR units (R multiples), the historical edge is real; if you think in dollars, there is none.
MEASURED RESULTS (all historical, XAUUSD 1h, 2013-2026, ~79,000 bars)
Out-of-sample validation on a pre-registered 2023-2026 holdout, opened once: bars with score >= 3 were followed by a 2-ATR impulse 1.95x more often than the base rate (95% CI 1.76-2.03). Score = 4: 2.73x (CI 2.09-2.94).
Honest base rates: with a ~5% base impulse rate, 2.7x lift means roughly 13-14% of full triggers are followed by an impulse. Most signals are NOT followed by a large move. Position sizing must assume this.
The follow-through advantage, measured in ATR units and controlled for time of day, is about x1.106, favorable in all 21 measurable hourly buckets and in 13 of 14 years. Without the time-of-day control the raw number is x1.139 — the control matters, and the built-in table applies it for you.
Where signals cluster on gold: the New York morning (13:00-15:00 UTC) and the London open (08:00-09:00 UTC). The most volatile hour of gold's day in this dataset is 14:00 UTC (about 1.8x the daily average hourly range).
STOCKS (NVDA, AMD, TSLA — high-volume, high-volatility test set)
The signal transfers, but with roughly half the strength: x1.04-1.08 in ATR units after the same time-of-day control (below 1 in dollar terms). Three structural rules came out of that validation and are enforced by the script's guards:
Do not use 5-minute charts: intraday volume is U-shaped and the signal degenerates into a closing-auction detector (a fake x1.68 "edge" came entirely from the last 30 minutes of the session).
Do not use 1-hour charts on RTH equities: the session's partial bar has a smaller range by construction and concentrates signals. The script excludes partial bars automatically (marked with a dot).
Use 15m or 30m, and keep the characterization horizon inside the session (H <= 12 on 15m, H <= 11 on 30m). Windows containing long closures (overnight gaps, weekends) are excluded by the gap guard.
Earnings are not the driver: excluding extreme-gap days does not change the result.
THE BUILT-IN CHARACTERIZATION TABLE
The table answers, for THE SYMBOL AND TIMEFRAME ON YOUR CHART, whether the signal has historically preceded larger moves, using three measures: raw MFE in ATR (inflated by the denominator and by time of day — reference only), MFE in % of price (immune to the denominator), and the intra-hour advantage (computed within each hour of day, then aggregated — the one that decides, highlighted in yellow). It also reports the ATR-at-signal ratio (~0.8 expected) and the maximum hourly concentration of signals (if it exceeds ~8 pp, part of what you see is the clock, not the market). If it says "short sample", the guards are refusing to output a number that cannot be measured cleanly on your chart — that is a feature.
WHY IT IS ORIGINAL
Rolling percentiles converted to the exact convention of pandas rolling rank, so the script reproduces the research module it was ported from (practical parity check: on XAUUSD 1h, score >= 3 should fire on roughly 17% of bars, score = 4 on roughly 3.7%).
Wilder ATR (RMA), population standard deviations, closed-bar evaluation with alerts on bar close, and an entry reference at the next bar's open — no repainting of the validated signal.
Session guards: partial-bar exclusion (any intraday bar shorter than its timeframe) and a data-measured gap guard (characterization windows may not contain a closure longer than 3x the timeframe), so equity overnight gaps and weekends do not contaminate the statistics while gold's 1-hour daily break does not block them.
A self-auditing characterization table with denominator-aware and time-of-day-controlled measures. It will happily tell you the signal does NOT work on your chart.
SETTINGS
Signal windows (14 / 500 / 120 / 100) and tercile cuts are the canonical values of the validated module; changing them invalidates every reference number above. "Confirm on bar close" keeps the indicator inside its validated definition. The alert message includes the score breakdown and states that the entry reference is the next bar's open. The characterization table can be displayed in English or Spanish via the "Table language" setting.
LIMITATIONS
All figures are historical measurements from the research program described above; past behavior does not guarantee future behavior. The stock characterization is in-sample (no reserved validation window). This is a statistical tool for regime awareness — when to pay attention — not a trading system: it provides no direction, no entries, and no risk management. Indicatore

Strategia

MACD Pullback Validation with Divergence Filters [algotim]MACD Pullback Validation with Divergence Filters is a momentum confirmation indicator designed to identify continuation opportunities after temporary pullbacks rather than generating signals from every MACD crossover.
Instead of relying on a single event, the script evaluates multiple stages of market behavior. It begins by detecting pullbacks within an existing momentum cycle, waits for momentum recovery, confirms that price and the MACD histogram are no longer weakening, and optionally verifies that the setup occurs near significant price locations using pivot-derived support/resistance levels or Bollinger Band extremes.
The objective is to reduce low-quality MACD signals by requiring several independent conditions to align before a bullish or bearish signal is displayed.
Problem Statement
Traditional MACD crossover signals frequently occur during ranging markets or immediately after short-lived momentum fluctuations. Likewise, divergence signals alone often appear too early and do not necessarily indicate that momentum has already shifted back in the anticipated direction.
This indicator addresses that limitation by requiring multiple confirmation stages rather than treating each condition as an independent trading signal.
Instead of responding to isolated events, it evaluates whether a pullback has occurred, whether momentum is rebuilding, whether a recent divergence supports the move, and whether price is located in an area where reversals may be more meaningful.
Methodology
The analytical framework consists of several sequential validation layers.
First, MACD crossover events occurring above or below the zero line are monitored to identify temporary pullbacks within an existing momentum cycle. These crossover events establish the recent pullback state.
Next, the script monitors the MACD histogram. Bullish momentum requires the histogram to remain above zero while increasing relative to the previous bar. Bearish momentum requires the histogram to remain below zero while decreasing.
The indicator then waits for the MACD line itself to cross the zero line, treating this as evidence that momentum has shifted back in the direction of the prevailing move.
Histogram divergence is calculated using confirmed pivot highs and pivot lows. Regular bullish divergence requires price to form a lower low while the histogram forms a higher low. Regular bearish divergence requires price to form a higher high while the histogram forms a lower high. Hidden divergence calculations are also available for users who wish to visualize continuation-type divergence.
Finally, optional contextual filters may be enabled.
The Support/Resistance filter checks whether the current price is interacting with recently confirmed pivot-based levels.
The Bollinger Band filter requires bullish setups to occur after closing below the lower band and bearish setups after closing above the upper band, helping identify momentum reversals from statistically extended price conditions.
Signals are generated only after every enabled validation layer has been satisfied.
Signal Workflow
Bullish workflow
1. Detect a recent bearish MACD crossover occurring above the zero line to identify a pullback.
2. Confirm a regular bullish MACD histogram divergence using pivot comparisons.
3. Require the MACD histogram to begin strengthening.
4. Wait for the MACD line to cross back above the zero line.
5. Optionally require interaction with recent pivot-based support.
6. Optionally require price to close below the lower Bollinger Band.
7. Display a bullish signal.
Bearish workflow
1. Detect a recent bullish MACD crossover occurring below the zero line.
2. Confirm a regular bearish MACD histogram divergence.
3. Require bearish histogram acceleration.
4. Wait for the MACD line to cross below the zero line.
5. Optionally require interaction with recent pivot-based resistance.
6. Optionally require price to close above the upper Bollinger Band.
7. Display a bearish signal.
Why This Indicator Is Different
Many MACD indicators generate signals immediately after crossovers, while divergence indicators typically evaluate price and momentum independently.
This script integrates these concepts into a sequential validation framework where each condition serves a different analytical purpose.
The pullback logic identifies temporary counter-trend momentum.
The histogram evaluates whether momentum is rebuilding.
The zero-line crossover confirms broader momentum alignment.
Divergence provides evidence that momentum and price are no longer moving in agreement.
Optional pivot interaction and Bollinger Band filters add market-location confirmation before a signal is produced.
Rather than displaying every crossover or every divergence, the indicator waits until multiple independent conditions align before producing a trading signal.
Inputs
The script includes configurable parameters for:
* MACD fast, slow, and signal periods
* Pullback lookback window
* Divergence pivot lengths
* Divergence range settings
* Optional hidden divergence display
* Optional Support/Resistance validation
* Pivot sensitivity
* Optional Bollinger Band confirmation
* Bollinger Band length and standard deviation
Alerts
Built-in alert conditions are available for:
* Bullish Signal
* Bearish Signal
* Regular Bullish Divergence
* Hidden Bullish Divergence
* Regular Bearish Divergence
* Hidden Bearish Divergence
Practical Usage
The indicator is intended for traders who prefer waiting for momentum confirmation after temporary pullbacks instead of reacting to every MACD crossover.
Optional Support/Resistance and Bollinger Band filters can be enabled to make signal selection more restrictive when additional price-location confirmation is desired.
Limitations
MACD histogram divergence relies on confirmed pivot highs and lows, so divergence signals are only confirmed after the required pivot bars have formed.
Support and resistance levels are derived from pivot calculations and represent algorithmically identified swing points rather than manually drawn market structure.
Like any momentum-based indicator, performance may vary across different market conditions and should be evaluated alongside a broader trading plan and appropriate risk management.
Notes
This indicator is intended as an analytical decision-support tool. It combines momentum analysis, pullback recognition, divergence detection, and optional contextual filters into a structured confirmation process rather than relying on any individual condition as a standalone trading signal. Indicatore

Daily BB (Historical Plotting with RTH/ETH/24H)Daily BB (RTH/ETH/24H) projects Daily Bollinger Bands onto intraday charts using Regular Trading Hours (RTH) daily data as the underlying daily reference.
The script plots a projected Daily Bollinger Band basis together with projected upper and lower bands. By default, the basis uses a 20-day calculation and the bands use ±2 standard deviations. The length, standard-deviation multiplier, and band fill can be adjusted in the indicator settings.
Unlike a standard Bollinger Band calculated from the chart’s intraday bars, this indicator maintains a Daily calculation. Completed RTH daily closes provide the historical portion of the Daily window, while the current intraday price is used as the projected close for the unfinished Daily period. This allows the Daily basis and bands to update throughout the trading day rather than remaining fixed until the Daily candle closes.
The indicator is designed for use on intraday charts with TradingView’s RTH, ETH, or 24H session settings. Daily history is sourced from the symbol’s regular trading session, so overnight and extended-hours prices can update the projected Daily values without becoming separate completed Daily observations.
Daily rollover is based on the New York calendar date. On normal 24H weekdays, the projected Daily window advances at 00:00 ET. After a weekend, TradingView has no intervening Saturday bars and does not resume data until Sunday evening. Sunday 20:00 ET is therefore the first available Sunday candle, so the projection can reseed there using Friday’s completed RTH close. This does not create a Sunday RTH Daily candle. At Monday 00:00 ET, there may be no additional visible seed change because Sunday did not produce a completed RTH Daily candle.
At the first RTH bar, the script synchronizes the projection with the confirmed RTH Daily history. Higher-timeframe data requests are structured so unfinished Daily values are not inserted into earlier historical bars.
How to use it: The projected bands show where the Daily Bollinger Band would be if the current intraday price were the Daily close. They can therefore be used to view the developing Daily BB structure before the session has finished. The values remain projections until the applicable RTH Daily candle is complete.
This script uses the same RTH-based projected Daily framework as my Daily SMA indicator, but performs a distinct Bollinger Band calculation. In addition to the projected Daily mean, it calculates projected Daily variance and standard-deviation bands to produce the upper and lower envelope. This provides functionality beyond a moving-average variation and is intended for traders who want developing Daily Bollinger Band context visible directly on an intraday RTH, ETH, or 24H chart. Indicatore

TF: BB/KC and Potential Reversals (BBKC)TradingFlow: BB/KC and Potential Reversals (BBKC)
BBKC combines Bollinger Bands (BB) and a Keltner Channel (KC) in one clean overlay, then uses band re-entry and momentum conditions to highlight potential bullish and bearish reversals. Its purpose is to make volatility structure, trend behaviour, compression, expansion, and possible turning points easier to read without covering the chart with separate indicators.
The diamond markers are hints that price may be reacting after an extended move or that momentum may be fading. They are not automatic trade instructions, and they do not mean a reversal is confirmed.
A Unified BB / KC View
Bollinger Bands and Keltner Channels describe volatility in different ways:
• Bollinger Bands: use standard deviation, so their width changes as price movement expands or contracts.
• Keltner Channel: uses ATR around an EMA to create a smoother channel for reading trends and pullbacks.
BBKC plots both structures with one visual theme rather than stacking two unrelated indicators. The more visible aqua boundaries are the KC, while the lighter boundaries are the BB. Subtle shading makes it easier to see how the two envelopes contract and expand around price, and the full KC area can also be lightly shaded if preferred.
This merged presentation is useful even without the reversal markers. The slope and direction of the channels, the side of the channel where price is holding, and the way price reacts at the boundaries can all provide trend context.
Why the Default KC Multiplier Is 1.6
By default, the KC uses a 20-period EMA and an ATR multiplier of 1.6. Many modern Keltner Channel implementations use a 2.0 ATR setting. BBKC uses 1.6 to keep the boundaries somewhat closer to price, making routine pullbacks, boundary tests, and re-entry behaviour easier to see. This is a visual design choice, not a claim that 1.6 is inherently more accurate.
The multiplier is adjustable. Different instruments and trading styles may benefit from a wider or narrower channel, so 1.6 should be understood as a useful default rather than a universal optimum.
How to Read the Potential Reversal Markers
• Green diamond: a bullish potential reversal. Price has reacted from a lower volatility boundary and passed the enabled filters.
• Red diamond: a bearish potential reversal. Price has reacted from an upper volatility boundary and passed the enabled filters.
By default, the script looks for the close to cross back inside a lower or upper KC or BB boundary. An optional rejection rule also checks whether the current or preceding candle touched or pierced a Bollinger Band before the current candle closed back inside.
The optional filters are designed to reduce ordinary boundary crossings:
• Volatility context: one of the two preceding closes must have been outside the corresponding boundary of a separate ATR-based Volatility Channel.
• RSI momentum: RSI must be below the bullish threshold or above the bearish threshold. Both levels are adjustable.
• Stoch RSI extreme: within a recent validity window, at least one completed bar must have both smoothed K and D in the 90/10 extreme zone. The window is adjustable and defaults to the two bars before the potential reversal; the current re-entry bar is excluded.
Potential reversal conditions are confirmed at bar close. The separate Volatility Channel can remain hidden while its values are still used by the filter; display it when you want to inspect those boundaries on the chart.
What a Marker Can and Cannot Mean
A potential reversal may become a major trend reversal, but it may also be only a small pullback, a pause within the existing trend, or a failed signal followed by continuation. The script detects a filtered move back from a volatility boundary; it cannot know in advance which outcome will follow.
The marker is therefore more useful as a prompt to investigate the chart than as a standalone entry command. A marker appearing against a strong trend should generally require more evidence than one appearing at a well-established structural level after an exhausted move.
Practical Reading Process
1. Read the slope and position of the BB / KC structure to understand the current trend and volatility regime.
2. Note whether the BB is compressing inside the KC or expanding beyond it.
3. When a diamond appears, check whether it is located near meaningful market structure rather than evaluating the marker in isolation.
4. Look for confirmation through price action, trend structure, support and resistance, or a failed breakout.
5. Add independent context such as volume profile, high- and low-volume areas, and the reaction around important support or resistance levels.
6. Define invalidation and risk before considering an entry.
Alerts
Alerts can be created for bullish potential reversals, bearish potential reversals, or either direction. They use the same final confirmed conditions and remain available when chart markers are hidden. For live use, “Once Per Bar Close” is recommended.
Important
BBKC is a chart-reading and opportunity-screening tool. Its markers are filtered potential reversals, not probabilities, guaranteed turning points, or complete trading systems. Settings behave differently across instruments and timeframes. Always combine the output with broader trend analysis, market structure, volume context, support and resistance, and appropriate risk management.
---
TradingFlow: BB/KC and Potential Reversals (BBKC)
BBKC 把布林通道(Bollinger Bands,BB)與肯特納通道(Keltner Channel,KC)整合在同一張主圖,並根據價格重新進入通道及動能條件,標示潛在的多頭和空頭反轉。它讓波動、趨勢、收縮、擴張和可能的轉折位置更容易判讀,不用另外疊加兩個指標。
菱形標記只是一個提示:價格經過一段延伸後,可能開始回頭,或原有動能正在減弱。它不是自動交易指令,也不代表反轉已經確認。
整合的 BB / KC 顯示
BB 與 KC 以不同方式描述波動:
• 布林通道: 使用標準差,會隨價格波動的擴大和收窄而改變。
• 肯特納通道: 以 EMA 為中心,利用 ATR 建立較平滑的通道,適合觀察趨勢與回調。
BBKC 用統一的配色呈現兩者。較清晰的水藍色邊界是 KC,較淡的邊界是 BB。淡色填充可幫助觀察兩組通道如何隨價格收縮和擴張,也可選擇顯示整個 KC 範圍。
即使不看反轉標記,這組通道本身也能幫助判斷趨勢。可留意通道斜率、價格主要停留在哪一側,以及價格接近邊界時的反應。
為何 KC 預設倍數是 1.6
KC 預設使用 20 週期 EMA 和 1.6 倍 ATR。現代 KC 指標常見的 ATR 設定是 2.0;BBKC 改用 1.6,讓邊界稍微靠近價格,更容易看到一般回調、邊界測試及價格重新進入通道的情況。這是為了方便讀圖,並不代表 1.6 本身更準確。
倍數可以自行修改。不同市場、時間週期和交易方式可能適合不同寬度,因此 1.6 只是實用的起始設定,並非所有情況下的最佳值。
如何閱讀潛在反轉標記
• 綠色菱形: 多頭潛在反轉。價格從下方邊界回升,並通過已啟用的過濾條件。
• 紅色菱形: 空頭潛在反轉。價格從上方邊界回落,並通過已啟用的過濾條件。
預設會尋找收盤價重新進入 KC 或 BB 邊界的情況。也可加入額外條件:目前或前一根 K 線先觸及/突破 BB,然後目前 K 線收回通道內。
各項過濾器用於減少普通邊界穿越造成的雜訊:
• 波動背景: 前兩根 K 線中,至少一根的收盤價必須曾位於另一組 ATR 波動通道的相應邊界之外。
• RSI 動能: 多頭標記要求 RSI 偏低,空頭標記要求 RSI 偏高;門檻可自行調整。
• Stoch RSI 極端值: 在近期有效期內,至少一根已完成 K 線的平滑 K、D 必須同時進入 90/10 極端區域。有效期可以調整;預設檢查潛在反轉前的兩根 K 線,不包括目前重新進入通道的 K 線。
潛在反轉條件只會在 K 線收盤後確認。另一組 Volatility Channel 即使隱藏,其數值仍可用於過濾;如想直接查看這些邊界,可在設定中顯示它。
標記可能代表甚麼
潛在反轉可能最終發展成主要趨勢反轉,也可能只是一個小型回調、原有趨勢中的短暫停頓,甚至是錯誤提示,之後價格繼續沿原方向運行。這套判斷只能找出價格從波動邊界回頭的跡象,無法預先知道之後會出現哪一種結果。
標記的作用是提醒你多看一眼,而不是叫你立即進場。逆著強勁趨勢出現時,通常需要更多確認;若它出現在明確的支撐、阻力或區間邊緣,而且此前走勢已有明顯延伸,才更值得留意。
實用判讀流程
1. 先閱讀 BB / KC 的斜率及價格位置,判斷目前趨勢與波動狀態。
2. 觀察 BB 正在 KC 內部收縮,還是向 KC 外部擴張。
3. 菱形出現時,先看它是否接近支撐、阻力或區間邊緣,不要只看標記本身。
4. 利用價格行為、趨勢結構、支撐阻力或假突破尋找確認。
5. 配合成交量分布(Volume Profile)、高/低成交量區,以及重要支撐阻力附近的反應。
6. 考慮進場前,先定義失效位置及風險。
警報
如需追蹤,可分別在多頭潛在反轉、空頭潛在反轉,或兩者任一出現時建立警報。警報只會在收盤條件確認後觸發;隱藏圖表上的菱形標記不會影響警報。即時使用時,建議選擇「Once Per Bar Close」。
重要說明
BBKC 是圖表判讀及機會篩選工具。標記只表示經過條件過濾的潛在反轉,不代表任何勝率,也不是必然轉折或完整交易系統。不同市場和時間週期的表現可能不同。使用時仍要結合趨勢、市場結構、成交量、支撐阻力和風險管理。
---
TradingFlow: BB/KC and Potential Reversals (BBKC)
BBKCは、ボリンジャーバンド(BB)とケルトナーチャネル(KC)を1つの見やすいオーバーレイに統合し、バンドへの再進入とモメンタム条件から、強気・弱気の潜在的な反転を表示します。複数の指標を重ねてチャートを複雑にすることなく、ボラティリティ構造、トレンド、収縮、拡大、転換候補を読みやすくすることが目的です。
ひし形のマーカーは、伸びた値動きが反応し始めた、またはモメンタムが弱まりつつある可能性を知らせるヒントです。自動売買の指示ではなく、反転が確定したことも意味しません。
BBとKCを統合した表示
BBとKCは異なる方法でボラティリティを表します。
• ボリンジャーバンド: 標準偏差を使うため、価格のばらつきの変化に反応します。
• ケルトナーチャネル: EMAを中心にATRで幅を作る、より滑らかなチャネルです。トレンドや押し戻りの確認に使えます。
BBKCは両者を共通の配色で整理して表示します。より明瞭なアクア色の境界がKC、薄い境界がBBです。控えめな色付けにより、2つのチャネルが価格の周囲で収縮・拡大する様子を見やすくし、必要に応じてKC全体の範囲も薄く表示できます。
この統合表示は、反転マーカーを使わない場合にも有用です。チャネルの傾き、価格が維持されている側、境界での反応から、トレンドの背景を読み取れます。
KCのデフォルト倍率が1.6である理由
KCは、デフォルトで20期間EMAと1.6倍のATRを使用します。現代的なKCでは2.0倍のATRもよく使われますが、BBKCは境界を価格に少し近づけ、通常の押し戻り、境界テスト、チャネルへの再進入を見やすくするために1.6倍を採用しています。これは見やすさのための設計であり、1.6倍のほうが本質的に正確という意味ではありません。
倍率は調整可能です。銘柄、時間軸、取引スタイルによって適切な幅は異なるため、1.6は実用的な初期値であり、すべての市場に共通する最適値ではありません。
潜在リバーサル・マーカーの見方
• 緑のひし形: 強気の潜在リバーサル。価格が下側のボラティリティ境界から反応し、有効なフィルターを通過した状態です。
• 赤のひし形: 弱気の潜在リバーサル。価格が上側のボラティリティ境界から反応し、有効なフィルターを通過した状態です。
デフォルトでは、終値がKCまたはBBの境界内へ戻る動きを検出します。追加条件では、現在または直前の足がBBに到達・突破し、その後に現在の終値がバンド内へ戻った場合も候補にできます。
各フィルターは、通常の境界通過によるノイズを抑えるために使用します。
• ボラティリティ背景: 直前2本のうち少なくとも1本の終値が、別のATRベースのVolatility Channelの対応する境界より外側であることを要求します。
• RSIモメンタム: 強気ではRSIが下側しきい値未満、弱気では上側しきい値を超えていることを要求します。どちらもしきい値を調整できます。
• Stoch RSIの極端値: 直近の有効期間内で、少なくとも1本の確定足において平滑化されたKとDが同時に90/10の極端ゾーンへ入っていることを要求します。有効期間は調整でき、デフォルトでは潜在リバーサル前の2本を確認します。現在の再進入足は含めません。
潜在リバーサルの条件は足の確定時にのみ成立します。Volatility Channelは非表示でもフィルターに使われ、必要に応じてチャート上に境界を表示できます。
マーカーが意味する可能性
潜在的な反転は、大きなトレンド転換につながる場合もあれば、小さな押し戻り、既存トレンド内の一時停止、または誤ったシグナルとなってそのままトレンドが継続する場合もあります。検出しているのは、フィルターを通過したボラティリティ境界からの戻りです。その後の結果を事前に判断することはできません。
そのため、マーカーは単独のエントリー指示ではなく、チャートを詳しく確認するためのヒントとして使うのが適切です。強いトレンドに逆らうマーカーには、明確な構造水準で伸び切った後に出るマーカーよりも多くの確認が必要です。
実践的な読み方
1. BB / KCの傾きと価格位置から、現在のトレンドとボラティリティ状態を確認します。
2. BBがKCの内側で収縮しているか、外側へ拡大しているかを確認します。
3. ひし形が出たら、重要な市場構造の近くにあるかを確認し、マーカーだけで判断しないようにします。
4. プライスアクション、トレンド構造、サポートとレジスタンス、または失敗したブレイクから確認を探します。
5. ボリュームプロファイル、高・低出来高帯、重要なサポート/レジスタンスでの反応など、独立した情報を組み合わせます。
6. エントリーを検討する前に、無効化水準とリスクを定義します。
アラート
強気、弱気、またはいずれかの方向に潜在リバーサルが現れた場合のアラートを作成できます。どれも同じ足の確定条件で作動し、チャート上のマーカーを非表示にしても機能します。リアルタイムでは「Once Per Bar Close」の使用を推奨します。
重要
BBKCはチャート分析と候補抽出のためのツールです。マーカーはフィルターを通過した潜在的な反転を示すものであり、確率、保証された転換点、または完全な売買システムではありません。銘柄や時間軸によって挙動は異なります。より広いトレンド分析、市場構造、出来高、サポートとレジスタンス、適切なリスク管理と組み合わせて使用してください。
Indicatore

Squeeze AI - Breakout Direction Probability [Dots3Red]🗜️ SQUEEZE AI - BREAKOUT DIRECTION PROBABILITY
A squeeze tells you volatility is loading. It has never told you which way it's going to release. This script fixes that second half of the problem - not by predicting the future, but by remembering the past. Every completed squeeze on your chart becomes a measured data point, and when a new squeeze fires, the script reports what the most similar past squeezes actually did.
✨ WHY THIS MATTERS
Bollinger-inside-Keltner squeeze detection has existed for years, and every version of it does the same thing: flags that a squeeze is happening, then flags that it released. What happens next has always been left to the trader's judgment.
This script keeps score instead. It records the character of every squeeze that completes — how long it ran, how tight it got, what volume and momentum looked like — and pairs that with what price genuinely did afterward. When the next squeeze fires, it doesn't guess; it looks up the most similar squeezes this chart has actually produced and reports their real outcomes.
📊 ▲ 68% | +2.1 ATR | N=34
That reads as: of the 34 most similar past squeezes on this chart, 68% broke upward, averaging a 2.1 ATR move. Measured history, not a formula assuming squeezes behave a certain way.
⚙️ HOW IT WORKS
🗜️ Squeeze detection — the standard definition: Bollinger Bands (mean ± standard deviation) compress fully inside Keltner Channels (mean ± ATR). The moment BB's upper band drops below KC's upper band and BB's lower band rises above KC's lower band, a squeeze is active. A minimum-duration filter discards brief compressions too short to carry real information.
📐 Compression depth — beyond simple on/off, the script tracks how tight the squeeze actually gets: 0% means BB has barely tucked inside KC, approaching 100% means BB has nearly collapsed to a point. This becomes one of the features used for matching, since a shallow squeeze and an extreme one are genuinely different situations.
🧠 The KNN engine — every completed squeeze is stored as five measurements: duration, compression depth, average volume behavior during the squeeze, momentum at release, and volatility context. When it resolves, the actual outcome — direction and distance in ATR — is recorded against those five measurements. A new squeeze is compared against this stored history, and the K most similar past squeezes vote on direction and expected distance.
🔮 Live anticipation — while a squeeze is still compressing, before it even releases, an optional live label shows the KNN's current lean based on the squeeze's characteristics so far. This updates as the compression develops, so you're not waiting for the release to get a read.
🔒 Non-repainting — squeeze tracking, firing, and outcome grading all happen only on confirmed bars. The live anticipation label is explicitly a live-state readout (clearly distinguished from the historical fire labels) and is deleted and redrawn each update rather than left as a permanent mark.
🧭 HOW TO USE
1️⃣ Wait for the sample count. Early on a fresh chart, fire labels will show "Training… (4/12)" instead of a probability. The engine needs a real base of completed squeezes before its reads mean anything — don't trust a probability built on a handful of samples.
2️⃣ Read the N, not just the percentage. "▲ 68% | N=34" is a meaningfully different statement than "▲ 68% | N=8" — the first is a real pattern, the second could easily be noise. The script always shows N specifically so you can judge that yourself.
3️⃣ Watch the live anticipation label as the squeeze develops. A squeeze's characteristics (duration, compression, volume) can shift the KNN lean while it's still compressing — the live label lets you see that lean forming before release, not just after.
4️⃣ Check the dashboard's global stat for chart-level context. Beyond any single squeeze, the dashboard tracks what percentage of every recorded squeeze on this chart broke upward overall — useful context for whether this instrument has had a directional bias in its squeeze behavior.
5️⃣ Tune the minimum squeeze duration to the timeframe. A 4-bar minimum on a daily chart and a 4-bar minimum on a 1-minute chart represent very different amounts of real compression — adjust it to the timeframe you're actually trading.
🛠️ SETTINGS
🗜️ Squeeze Detection
• BB Length / Multiplier, KC Length / Multiplier — standard Bollinger and Keltner parameters
• Min Squeeze Duration — shortest compression the script will bother recording
📊 KNN Engine
• Outcome Window — bars after release over which direction and distance are measured
• K Neighbors — how many similar past squeezes vote on the current one
• Max / Min Training Samples — memory cap and the minimum before probabilities display
• ATR Baseline Period — the volatility-context window used in matching
🎨 Visualization
• Fill between BB — boolean to control area fill
• Squeeze Background Tint, Squeeze Zone Box — two independent ways to mark the active compression, usable together or separately
• Fire Labels with Probability — the KNN readout shown on release
• Live Anticipation Label — the developing-squeeze readout described above
🖥️ Dashboard
• Show/hide, position — current squeeze state and duration, compression %, live KNN read, and chart-wide sample totals
EXAMPLE (area fill between BB bands)
📝 NOTES
Squeeze frequency varies enormously by instrument and timeframe — a fast-moving asset will accumulate the sample count needed for meaningful probabilities much faster than a slow one. On a new chart, expect several squeezes to pass before the KNN read becomes genuinely informative rather than a placeholder.
⚠️ DISCLAIMER
This is an analytical and visualization tool. It does not generate trade signals and does not constitute financial advice. Historical squeeze outcomes do not guarantee how any future squeeze will resolve. Indicatore

BB Squeeze Histogram
BB Squeeze Histogram (BBSH) — User Manual
Companion indicator to Bollinger-Bands.Multi_Choice (BBMC). Plots the width of the Bollinger envelope as a MACD-style histogram, signed by which side of the basis MA price is on.
1. What It Shows
Two things are encoded into one histogram:
Above / below the neutral line — whether price is currently above or below the basis moving average. The neutral line is 0 in raw mode, 50 in normalized mode.
Bar length from the neutral line — how wide the Bollinger envelope currently is (the distance between the upper and lower band, at your chosen standard-deviation multiple). Long bars = wide bands = high volatility. Short bars hugging the neutral line = tight bands = low volatility / squeeze.
Put together, a bar answers two questions at once: which side of trend is price on, and how stretched or compressed is the market right now.
2. Reading the Colors
Bars use a 4-color scheme, same idea as a standard MACD histogram:
Color
Meaning
Bright teal
Above neutral, band width expanding vs. the prior bar
Pale teal
Above neutral, band width contracting vs. the prior bar
Bright red
Below neutral, band width expanding vs. the prior bar
Pale red/pink
Below neutral, band width contracting vs. the prior bar
Bright bars mean volatility is actively growing on that side of the trend. Pale bars mean the move is losing steam or the range is tightening — often the first sign a squeeze is building.
3. Extra Plots on the Panel
Neutral line — gray line at 0 (raw mode) or 50 (normalized mode). Crossings mark price crossing the basis MA.
Red line (Avg Positive Column) — the running average width of only the positive (above-neutral) bars, over the "Column average lookback" period. Shows what a "normal" bullish-side expansion looks like recently. Bars poking well above this line are expanding harder than usual.
Green line (Avg Negative Column) — same idea, mirrored for the negative (below-neutral) bars.
Yellow dots on the neutral line — squeeze markers. Appear when the current band width is the tightest reading over the "Squeeze lookback" period — i.e., the bands are as compressed as they've been in a while. These tend to precede expansion moves.
4. Inputs
Input
Default
What it does
Source
ohlc4
Price series used for the basis MA and standard deviation calc
Length
20
Lookback for both the basis MA and the standard deviation
Band SD (± this value)
3.0
The standard-deviation multiple defining the band edges (matches your BBMC R3/S3 by default)
ALMA offset
0.89
Only used if MA Type = ALMA
ALMA sigma
5
Only used if MA Type = ALMA
Normalize to 0-100 scale
off
See Section 5
Normalize rank lookback
200
Bars of width history the 0-100 rank is measured against (normalized mode only)
Squeeze lookback
100
Bars used to detect the "tightest width" for the yellow squeeze dots
Column average lookback
100
Bars used to compute the red/green average-column lines
MA Type
VWMA
Basis moving average type — SMA, EMA, RMA, WMA, VWMA, VWAP, HMA, SWMA, or ALMA
5. Normalize Toggle — Important
Off (default): the histogram plots raw dollar-width — literally (upper band − lower band). Values are in the same units as price, so a reading of "8,000" on BTC/USD means the envelope is $8,000 wide. The neutral line sits at 0.
On: the histogram is rescaled to a bounded 0–100 oscillator with 50 as the neutral level. The current band width is percentile-ranked against its own history over the "Normalize rank lookback" period (default 200 bars), producing a 0–100 rank. That rank is halved to a 0–50 magnitude and then measured out from 50 — upward when price is above the basis MA, downward when below.
Reading the normalized scale:
Reading
Meaning
Near 100
Price above the basis MA, band width at the widest end of its recent history
~75
Price above basis, width around the middle of its historical range
Near 50
Squeeze — width at the tightest end of its history, regardless of side
~25
Price below basis, width around the middle of its historical range
Near 0
Price below the basis MA, band width at the widest end of its recent history
Note that the distance from 50 is the volatility read and the side of 50 is the trend read — they are independent. A reading of 52 and a reading of 48 both describe a tightly squeezed market; they just differ on which side of the MA price closed.
Because the value is a percentile rank, it is self-scaling: readings are directly comparable across assets, timeframes, and price regimes without retuning. The trade-off is that it tells you where width sits relative to its own recent history, not its absolute size — a 95 reading in a quiet chop regime may be a smaller dollar-width than a 60 reading during a volatile stretch. Shortening the rank lookback makes the oscillator more reactive to recent regime; lengthening it gives a more stable long-run reference.
Match your basis MA type/length here to your BBMC settings if you want the neutral-line crossings on this panel to line up exactly with the white basis line's color flips on your main BBMC chart.
6. Suggested Ways to Use It
Trend confirmation: treat neutral-line position the same way you'd treat price vs. the BBMC basis line — histogram above neutral supports a long bias, below neutral supports a short bias.
Squeeze setups: watch for yellow dots (tight width) followed by a color shift from pale to bright — that transition often marks the start of a breakout move out of consolidation.
Exhaustion reads: when bars run well past the red or green average line, the current expansion is unusually large relative to its own recent history — often a point where trend continuation odds start to fade and mean-reversion becomes more likely.
Divergence: if price makes a new high/low but the histogram's peak height is smaller than the prior swing's, the expansion behind the move is weaker than last time — a classic momentum-divergence tell, same logic as reading MACD histogram divergence against price.
7. Notes / Limitations
This is a volatility/width indicator, not a standalone directional signal — it's meant to be read alongside price structure or your BBMC chart, not in isolation.
The squeeze marker and average-column lines both depend on their lookback inputs; shortening them makes the indicator more reactive to recent bars, lengthening them smooths it out but reacts slower to regime changes.
Normalize should generally stay consistent once you've picked it — the raw and normalized histograms are not on comparable scales, and the red/green average lines are computed from whichever mode is active. The squeeze dots are always derived from raw band width, so they mark the same bars in either mode. Indicatore

MAs BB Lines_wt [WynTrader]MAs BB Lines --- Published : 2026-08-08
This indicator draws on the classical moving-average-and-Bollinger-Bands framework commonly taught by many specialist authors, to combine an 18-day Bollinger Band setting with a set of key moving averages (21, 50, 100, 200) to read trend direction, volatility, and potential support/resistance zones together. This script builds on that same general approach with a fully customizable, five-MA overlay and an added forward-projection layer.
Features:
📊 5 Independent Moving Averages
Each MA has its own length and type (SMA, EMA, RMA, VWMA, HMA), fully customizable to fit any trading style.
- MA1 (default: 8 EMA) — plotted as stepline for fast reaction visibility
- MA2 (default: 21 SMA), - MA3 (default: 50 SMA), - MA4 (default: 100 SMA) and - MA5 (default: 200 SMA)
📈 Bollinger Bands
Middle line 18-period, 2.0 deviation bands (basis, upper, lower) to frame volatility and price extremes around the trend structure.
🔮 Forward Projection Lines
Dashed projection lines extend from end of lines into future bars, based on each MA's recent slope (lookback-configurable). This gives traders a visual read on where each average is heading if current momentum persists.
- Lookback period: 3–10 bars (controls slope sensitivity)
- Forward projection length: 5–30 bars
- Projections can be toggled on/off
How to use it:
Watch for convergence or crossing of the moving averages and their projected paths — these often mark potential inflection points. Use the Bollinger Bands to gauge whether price is stretched relative to trend. Combine short-term (MA1) and long-term (MA5) MA slopes to confirm trend direction and strength.
Notes:
- Overlay indicator, works on any timeframe and instrument
- All moving average types and lengths are fully adjustable in settings
- Projection lines are visual guides based on recent slope, not predictive signals — always confirm with price action and other analysis
- Conceptual framework inspired by moving-average/Bollinger-Band methods commonly taught by several specialist authors and used by many professionals to identify support and resistance pivots. Indicatore

DNSE VN301!, Bollinger Bands Break Out Strategy "Bollinger Bands Breakout with SMA Trend Filter" is a volatility breakout strategy designed to capture strong directional price movements when price breaks outside its recent trading range. The strategy uses Bollinger Bands, constructed from an SMA(20) and two standard deviations, to identify bullish breakouts when price closes above the upper band and bearish breakouts when price closes below the lower band.
To improve signal quality, the strategy incorporates an optional SMA(200) trend filter, allowing Long trades only when the SMA is rising and Short trades only when it is falling. By combining volatility-based breakout signals with long-term trend confirmation, the strategy seeks to reduce false breakouts during ranging markets while participating in sustained intraday trends. It also includes configurable stop loss, take profit, trading session filters, automatic end-of-day position closure, and trend reversal exits for disciplined risk management.
Strategy settings and configuration:
Chart timeframe: recommended 5-minute chart
Position size: 3 contracts
Bollinger Bands length: 20
Bollinger Bands multiplier: 2.0
SMA length: 200
Stop loss: 10 points
Take profit: disabled
SMA trend filter: On / Off
Take profit: On / Off
Time filter: On / Off
Trading session: 09:00 – 14:30
Trade direction: Long / Short / Both
Default script settings:
The strategy calculates Bollinger Bands using the SMA(20) of the closing price. The upper and lower bands are created by adding or subtracting two standard deviations around the middle line.
When volatility increases, the Bollinger Bands expand. When the market is quiet or moving sideways, the bands contract.
When the closing price breaks above the upper Bollinger Band, buying pressure may be taking control. When the closing price breaks below the lower Bollinger Band, selling pressure may be taking control.
When the SMA(200) trend filter is enabled, the script only allows Long trades when SMA(200) is rising and only allows Short trades when SMA(200) is falling. When the SMA filter is disabled, the strategy can trade both directions based only on Bollinger Bands breakout signals.
Users can add the built-in Bollinger Bands indicator on TradingView with Length 20 and Multiplier 2.0 to visually monitor the signal on the price chart.
Entry and exit rules:
Long entry:
Closing price > upper Bollinger Band
AND SMA(200) is rising, if the SMA filter is enabled
AND the signal appears during the trading session
AND trade direction allows Long entries
Long exit:
Stop loss: 10 points from entry price
Take profit: disabled by default
Closing price touches or breaks below the lower Bollinger Band
SMA(200) turns downward, if the SMA filter is enabled
Reversal when a valid Short signal appears
Automatic position close at the end of the trading session
Short entry:
Closing price < lower Bollinger Band
AND SMA(200) is falling, if the SMA filter is enabled
AND the signal appears during the trading session
AND trade direction allows Short entries
Short exit:
Stop loss: 10 points from entry price
Take profit: disabled by default
Closing price touches or breaks above the upper Bollinger Band
SMA(200) turns upward, if the SMA filter is enabled
Reversal when a valid Long signal appears
Automatic position close at the end of the trading session
Risk disclaimer:
Futures trading involves a high level of risk and prices can move sharply. This script is provided for reference, research, and backtesting purposes only. Users should fully understand derivatives trading, their own risk tolerance, and the strategy logic before applying it to live trading.
All investment decisions are the responsibility of the user. phaisinh.online is not responsible for any losses arising from the use of this strategy in real trading. Past performance does not guarantee future results.
____________________________________________________________________
"Bollinger Bands Breakout với Bộ lọc Xu hướng SMA" là một chiến lược giao dịch theo xu hướng dựa trên sự bứt phá của biến động giá, được thiết kế nhằm nắm bắt các chuyển động mạnh theo một hướng khi giá vượt ra khỏi vùng dao động gần nhất. Chiến lược sử dụng Bollinger Bands, được xây dựng từ SMA(20) và 2 độ lệch chuẩn, để xác định tín hiệu mua khi giá đóng cửa vượt lên trên dải trên và tín hiệu bán khi giá đóng cửa xuống dưới dải dưới.
Để nâng cao chất lượng tín hiệu, chiến lược tích hợp bộ lọc xu hướng SMA(200) (có thể bật hoặc tắt), chỉ cho phép mở vị thế Long khi SMA đang dốc lên và vị thế Short khi SMA đang dốc xuống. Bằng cách kết hợp tín hiệu bứt phá theo biến động của Bollinger Bands với xác nhận xu hướng dài hạn, chiến lược hướng tới việc giảm thiểu các tín hiệu phá vỡ giả trong giai đoạn thị trường đi ngang, đồng thời tận dụng các xu hướng intraday kéo dài. Ngoài ra, chiến lược còn bao gồm các tùy chọn Stop Loss, Take Profit, bộ lọc khung thời gian giao dịch, cơ chế tự động đóng toàn bộ vị thế khi kết thúc phiên, cùng với điều kiện thoát lệnh khi xu hướng SMA đảo chiều, nhằm đảm bảo quản trị rủi ro một cách chặt chẽ và có kỷ luật.
Cài đặt & cấu hình chiến lược:
Biểu đồ: khuyến nghị khung 5 phút
Khối lượng giao dịch: 3 hợp đồng
Chu kỳ Bollinger Bands: 20
Hệ số nhân Bollinger Bands: 2.0
Chu kỳ SMA: 200
Cắt lỗ: 10 điểm
Chốt lời: tắt
Bộ lọc xu hướng SMA: Bật / Tắt
Dùng chốt lời: Bật / Tắt
Bộ lọc giờ: Bật / Tắt
Khung giờ giao dịch: 09:00 – 14:30
Chiều giao dịch: Mua / Bán / Cả hai
Cài đặt mặc định của script:
Chiến lược tính toán Bollinger Bands dựa trên đường SMA(20) của giá đóng cửa. Dải trên và dải dưới được tạo bằng cách cộng hoặc trừ hai độ lệch chuẩn quanh đường giữa.
Khi biến động tăng mạnh, hai dải Bollinger Bands sẽ mở rộng. Khi thị trường đi ngang hoặc biến động thấp, hai dải sẽ co hẹp lại.
Khi giá đóng cửa vượt lên trên dải trên Bollinger Bands, lực mua có thể đang chiếm ưu thế. Khi giá đóng cửa phá xuống dưới dải dưới Bollinger Bands, lực bán có thể đang chiếm ưu thế.
Khi bật bộ lọc xu hướng SMA(200), script chỉ cho phép lệnh Mua khi SMA(200) dốc lên và chỉ cho phép lệnh Bán khi SMA(200) dốc xuống. Khi tắt bộ lọc SMA, chiến lược có thể giao dịch cả hai chiều chỉ dựa trên tín hiệu breakout của Bollinger Bands.
Người dùng có thể thêm chỉ báo Bollinger Bands có sẵn trên TradingView với tham số Length 20 và Multiplier 2.0 để quan sát tín hiệu trực quan trên biểu đồ giá.
Điều kiện vào và thoát lệnh:
Vào lệnh Mua:
Giá đóng cửa > dải trên Bollinger Bands
VÀ SMA(200) dốc lên, nếu bật bộ lọc SMA
VÀ tín hiệu xuất hiện trong khung giờ giao dịch
VÀ chiều giao dịch cho phép lệnh Mua
Thoát lệnh Mua:
Cắt lỗ: 10 điểm từ giá vào lệnh
Chốt lời: không dùng theo mặc định
Giá đóng cửa chạm hoặc phá xuống dải dưới Bollinger Bands
SMA(200) đảo chiều xuống, nếu bật bộ lọc SMA
Đảo chiều khi xuất hiện tín hiệu Bán hợp lệ
Tự động đóng lệnh khi hết khung giờ giao dịch
Vào lệnh Bán:
Giá đóng cửa < dải dưới Bollinger Bands
VÀ SMA(200) dốc xuống, nếu bật bộ lọc SMA
VÀ tín hiệu xuất hiện trong khung giờ giao dịch
VÀ chiều giao dịch cho phép lệnh Bán
Thoát lệnh Bán:
Cắt lỗ: 10 điểm từ giá vào lệnh
Chốt lời: không dùng theo mặc định
Giá đóng cửa chạm hoặc phá lên dải trên Bollinger Bands
SMA(200) đảo chiều lên, nếu bật bộ lọc SMA
Đảo chiều khi xuất hiện tín hiệu Mua hợp lệ
Tự động đóng lệnh khi hết khung giờ giao dịch
Tuyên bố rủi ro:
Giao dịch hợp đồng tương lai có mức độ rủi ro cao và giá có thể biến động mạnh. Script này chỉ phục vụ mục đích tham khảo, nghiên cứu và kiểm thử. Người dùng cần hiểu rõ giao dịch phái sinh, khẩu vị rủi ro cá nhân và logic của chiến lược trước khi áp dụng vào giao dịch thực tế.
Mọi quyết định đầu tư thuộc trách nhiệm của người dùng. phaisinh.online không chịu trách nhiệm cho bất kỳ khoản lỗ nào phát sinh từ việc sử dụng chiến lược này trong giao dịch thực tế. Hiệu quả trong quá khứ không đảm bảo kết quả trong tương lai.
Strategia

Institutional SMC & Order Flow Matrix PROInstitutional SMC & Order Flow Matrix PRO
Institutional SMC & Order Flow Matrix PRO is a clean, modern, and highly versatile technical charting tool engineered for traders practicing Smart Money Concepts and Order Flow Trading. Built with a focus on visual clarity, it eliminates unnecessary chart clutter by utilizing auto mitigating execution zones, swing anchored market structure lines, and an intelligent trend heatmap.
Key Features Overview
1. Precision Anchored Market Structure
Tracks Break of Structure and Change of Character signals with extreme precision. Lines originate directly from actual swing high or low pivot prices, while structure text labels sit neatly in the center of lines to prevent candle overlap.
2. Smart Auto Mitigating Order Block Zones
Automatically maps active institutional order blocks and imbalance execution zones. Mitigated zones automatically vanish from your chart once price fills the imbalance, keeping your workspace clean and professional.
3. Institutional Candle Heatmap
Features dynamic candlestick coloring driven by macro structural pivots. Bullish trend phases render in clean vibrant green, bearish phases in deep red, and high momentum displacement candles highlight in glowing gold.
4. Major Intermediate Term High and Low Badges
Automatically detects macro structural extremes. Displays solid red Intermediate Term High badges at major resistance tops and green Intermediate Term Low badges at major support bottoms.
5. Complete Manual Customization Suite
Includes comprehensive user settings for every element. Customize line styles, line thickness, border widths, box transparency, text alignment, text colors, and font sizes.
How to Use
Step 1: Identify Macro Trend Bias
Observe the Institutional Candle Heatmap theme to quickly determine current directional order flow.
Step 2: Monitor Centered Structure Signals
Look for precise Break of Structure lines and Change of Character signals anchored directly from swing points.
Step 3: Spot Gold Displacement Candles
Identify gold highlighted expansion candles that create fresh institutional order blocks.
Step 4: Trade Active Execution Zones
Utilize unmitigated bullish and bearish order block zones for high probability entries.
Settings Overview
Market Structure Settings
- Show Market Structure: Toggle structural line displays.
- Line Style and Thickness: Choose between Solid, Dashed, or Dotted lines with adjustable width.
Order Block Zone Settings
- Show Active Order Blocks: Toggle order block rectangles.
- Zone Fill Transparency: Adjust fill opacity from 0 to 100.
- Zone Text Settings: Customize display text, text alignment, font size, and text color.
Major Pivot Settings
- Show Major ITH / ITL Badges: Toggle visibility of macro pivot badges.
- Sensitivity: Adjust pivot lookback sensitivity.
Candle Heatmap Settings
- Enable Trend Candle Heatmap: Toggle dynamic trend candles and gold displacement highlights.
Disclaimer
This indicator is built strictly for educational, analytical, and charting enhancement purposes. It does not provide financial advice, trade recommendations, or guaranteed results. Always apply proper risk management principles. Indicatore

Bolinger Bands Range RSI Oscillator [ChartPrime]🔶 OVERVIEW
Traditional oscillators live in a separate sub-window beneath your price chart, forcing you to constantly split your focus between market structure and momentum data. The BB Range RSI Oscillator solves this by projecting Relative Strength Index momentum directly onto an adaptive Bollinger Bands channel right on your main chart layout.
This indicator normalizes standard RSI readings and maps them directly into price coordinates, letting you track momentum extremes, zone expansions, and automated structural divergences directly over the candles.
🔶 HOW IT WORKS
The indicator executes its structural calculations through a multi-tier transformation pipeline:
Adaptive Channel Matrix: The engine computes a moving average basis and applies a standard deviation multiplier to project upper and lower outer boundaries, alongside half-deviation warning lines, framing the primary price canvas.
Normalized RSI Mapping: Instead of rendering a separate panel, raw RSI values are normalized on a standardized scale and mapped directly relative to the middle basis and band width, translating momentum oscillations into exact price-level coordinates.
Dynamic Transparency Engine: The core oscillator line features a dynamic fade factor based on its distance from the center, shifting opacities to visually emphasize when momentum is pushing toward outer band extremes.
Automated Pivot Divergence Logic: The script evaluates pivot points on the mapped oscillator coordinates against price highs and lows. It measures exact bar spacing intervals to flag regular and prime momentum divergences.
🔶 KEY FEATURES
On-Chart Core Oscillator: Plots a fluid momentum curve directly onto the price candles, complete with an optional smoothing signal line to track trend momentum changes.
Dynamic Zone Shading: Automatically fills the upper and lower channel boundaries with custom color fills when the oscillator breaks past half-deviation or outer band extremes.
Automated Divergence Callouts: Pins custom signal badges (+ Bull, Bull, Bear, + Bear) directly onto historical pivot points when structural momentum divergences are detected.
Customizable Palette & Layout: Full user control over band lengths, RSI lookbacks, divergence parameters, and accent color schemes to fit your preferred charting setup.
🔶 TRADING APPLICATIONS
Extreme Band Rejection Entries: When the core oscillator pushes outside the outer Bollinger Band boundaries and flashes zone shading, look for price action reversal confirmations to catch institutional exhaustion moves.
Momentum Divergence Reversals: Utilize the automated Bullish and Bearish divergence tags to spot hidden shifts in market pressure. A regular or prime divergence near outer bands often signals an impending trend reversal.
Signal Line Crossovers: Enable the signal line to track short-term momentum shifts relative to the core mapped oscillator, giving you clean cross-over execution triggers.
🔶 SETTINGS
Bollinger Bands Settings (Length / Multiplier): Controls the lookback window and standard deviation width of the primary channel boundaries.
RSI Oscillator Settings (Period Length / Signal Line): Adjusts the sensitivity of the underlying momentum engine and configures the optional signal line length and styling.
Divergence Settings (Pivot Lookbacks / Min-Max Bars): Fine-tunes the strictness and spacing constraints used by the pivot detection engine to filter out noise.
🔶 CONCLUSION
The BB Range RSI Oscillator unifies volatility bands and momentum oscillators into a single, cohesive on-chart tool. By mapping RSI directly to price structure, it gives you a clean, distraction-free environment for spotting momentum extremes and institutional divergence setups. Indicatore