Indicatore

Indicatore

Indicatore

Indicatore

Indicatore

Indicatore

Indicatore

Indicatore

Indicatore

Indicatore

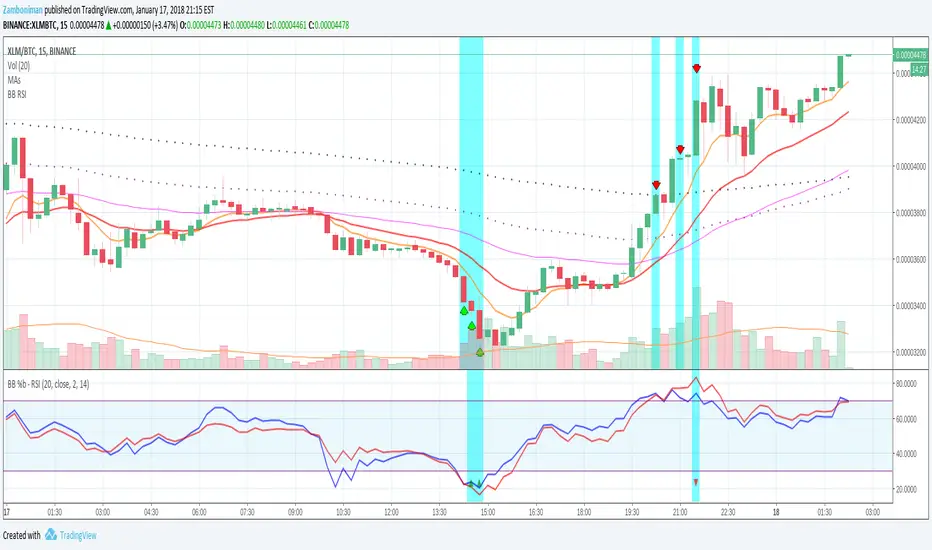
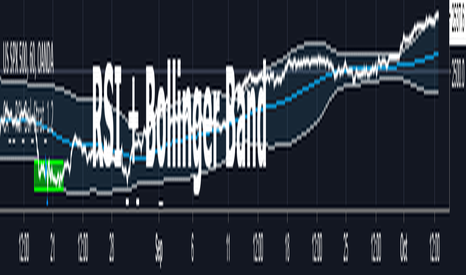
Bollinger Bands %b & RSI & Stochastic Smoothed Indicator & AlertThis indicator displays RSI, a normalized Bollinger Band &b (Usual 0 -1 range of BB normalized to the OBOS range of RSI), and a normalized smoothed Stochastic (again, normalized to the OBOS of RSI) simultaneously with a single indicator.
It also displays buy and sell signals based upon the above.
The stochastic can be turned on and off, and the sell signal calculation will be changed accordingly (Stochastic not used to calculate buy signal).
All periods, OBOS levels, deviation, etc, are user adjustable. The buy and sell arrows can be optionally turned off.
The indicator supports alerts for the buy and sell signals.
This is a considerably rewritten, cleaned up, and updated version of my BB %b & RSI Indicator and Alert with many more features, and including a stochastic.
This indicator is mainly for use with Cryptocurrencies in shorter time periods to display possible trade opportunities. Can also be used with Forex.
Indicatore

Indicatore

Indicatore

Indicatore

Indicatore

Indicatore

Indicatore
Indicatore

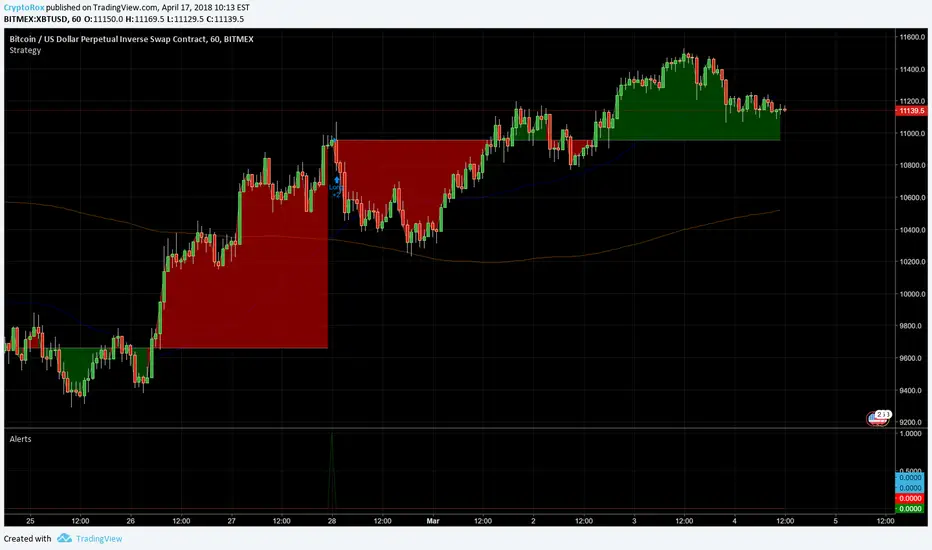
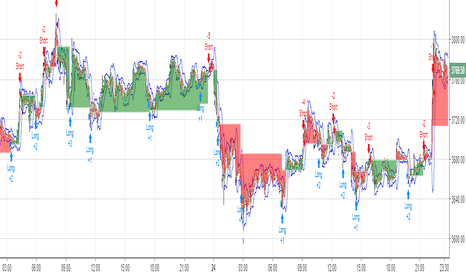
Bollinger + RSI, Double Strategy Long-Only (by ChartArt) v1.2This strategy uses the RSI indicator together with the Bollinger Bands to go long when the price is below the lower Bollinger Band (and to close the long trade when this value is above the upper Bollinger band).
This simple strategy only places a long, when both the RSI and the Bollinger Bands indicators are at the same time in a oversold condition.
In this new version 1.2 the strategy was simplified even more than before by going long-only, which made the strategy more successful in backtesting than the previous version (that older version also opened short trades).
This strategy does not repaint and was updated to PineScript version 3.
All trading involves high risk; past performance is not necessarily indicative of future results. Hypothetical or simulated performance results have certain inherent limitations. Unlike an actual performance record, simulated results do not represent actual trading. Also, since the trades have not actually been executed, the results may have under- or over-compensated for the impact, if any, of certain market factors, such as lack of liquidity. Simulated trading programs in general are also subject to the fact that they are designed with the benefit of hindsight. No representation is being made that any account will or is likely to achieve profits or losses similar to those shown.
P.S. For advanced users: If you want also be able to short with the same strategy approach, then please use my older version 1.1:
Strategia
Indicatore

Strategia
Indicatore

Indicatore