Indicatore
Indicatori di ampiezza
VWAP Upper Band 2 ScreenerVWAP Upper Band 2 Screener, determine length of time a stock has been rising. an increasing volatility will indicate VWAP in upper band 2
Indicatore
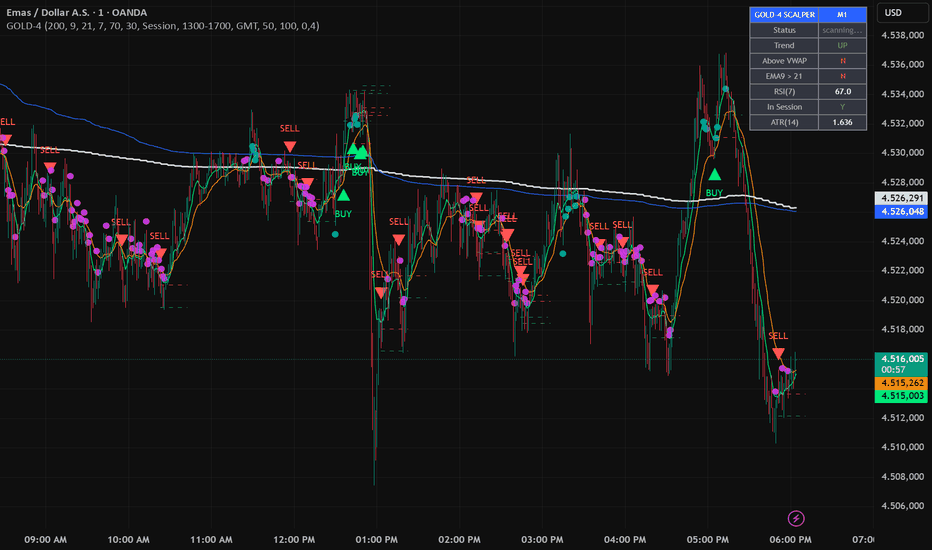
Gold Trading Assistant v2.0new update for Gold Trading Assistant v1, as this one giving signals for daily and scalping traders
Indicatore
Multi 20 EMA (Any timeframe by CSP)multi ema having 20 ema of different adjustable timeframe like 1m,1hout,day.week,month
Indicatore
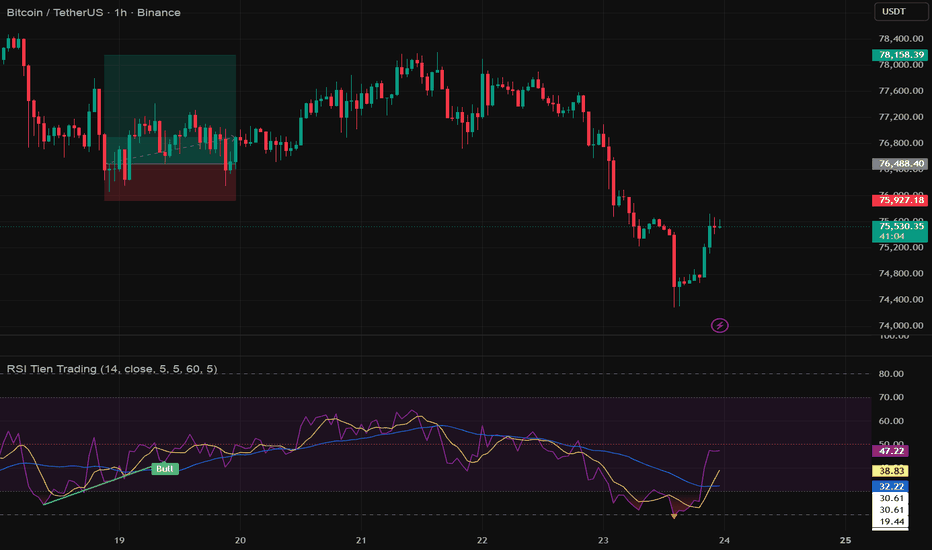
BTC 4H RSI + Bullish EngulfingLong-Einstieg
RSI ist überverkauft (< 30)
Es bildet sich eine bullische Engulfing Candle
Einstieg bei Kerzenschluss der Engulfing Candle
Stop Loss
Unter dem Tief der Engulfing Candle
Zusätzlich kleiner Puffer (z.B. 0,5 %)
Take Profit
Nächstes relevantes Volume High
Mindestens Risk/Reward 1:2
Strategia
Multi 20 EMA (Any timeframe)this indicator show 10,20,50,100,200 ema of any time frame like 1minute,1hour,daily,weekly,monthluy
Indicatore
Household Equity Allocation -- Positioning Gauge█ OVERVIEW
This indicator plots, in its own pane, the percentage of United States household financial assets held in corporate equities, requested live from the Federal Reserve Z.1 financial accounts. It ranks the current reading against an embedded multi-decade history, classifies it into posture zones, and reports an indicative long-horizon estimate, presenting household equity positioning as a slow, low-frequency context gauge rather than a price-derived trading signal.
█ HISTORY / BACKGROUND
The series shown is published by the Federal Reserve Board in the Z.1 Financial Accounts of the United States, formerly the Flow of Funds, available quarterly since 1945. It measures households' directly and indirectly held corporate equities as a share of their financial assets. Its use as a forward-looking context measure was popularized by the analyst writing as Philosophical Economics in 2013, who examined its historical relationship with subsequent long-horizon equity returns and contrasted it with Robert Shiller's cyclically adjusted price-to-earnings ratio.
The conceptual basis is an accounting identity rather than a behavioral model: investors in aggregate must hold the entire outstanding supply of equities, so the equity share of household assets can rise only when equity prices rise relative to the supply of other assets. The measure is therefore a positioning and relative-valuation reading expressed in committed dollars, not a sentiment survey. The script applies no proprietary transformation to the series; it requests the published values and contextualizes them.
█ HOW IT WORKS
- The script requests the series named by the FRED series input (default FRED:BOGZ1FL153064486Q) with request.security at a quarterly (3M) resolution, lookahead disabled and gaps off, taking the published close as the current allocation reading.
- A fixed baseline of annual year-end values from 1945 through 2025 is loaded once into an array on the first bar. After a hardcoded cutoff (Q4 2025) the script appends each new distinct live reading to that array, so the baseline extends automatically as new quarters are published.
- A percentile routine counts the baseline entries less than or equal to the current reading and returns that count as a percentage of the array size, giving the reading's full-history percentile.
- The reading is classified into one of four zones by comparison against the three threshold inputs: below Bottom-quintile , below Top-quintile , below Above historical range , or at or above it. Each zone maps to a color and a posture label.
- An indicative estimate is computed as a fixed linear function of the reading, with intercept 12.338 and slope -0.3978, using constants hardcoded in the script. When the reading exceeds the in-sample maximum of 38.7, the estimate is marked as an extrapolation.
- The allocation is drawn as a line colored by the active zone. Three dashed horizontal lines mark the thresholds, and an optional background tint shades the pane by zone. An optional table in the top right reports the current value, its full-history percentile, the posture, the indicative estimate (flagged when extrapolated), the in-sample maximum, and the data source. The table is built only on the last bar.
█ HOW TO USE
The output is read from the pane and the table.
- The line and its color show where positioning currently sits: green for the lowest band, gold for a neutral band, amber for an elevated band, and red for a reading above the historical range. The posture label in the table names the same state.
- The dashed lines are the zone thresholds, and the optional background tint repeats the active zone for quick reading.
- The table states the current value, its percentile against the full history, the posture, and the indicative long-horizon estimate, with a flag when that estimate is extrapolated beyond the historical range.
Recommended timeframe: the underlying data is quarterly and the script requests it at a quarterly resolution regardless of the chart's timeframe, so the displayed value is identical on every chart timeframe. A monthly or weekly chart on a long-history instrument is suggested only so the plotted line spans a useful visual range; the value and table do not depend on the chart timeframe or the chart symbol. Because the series is slow and lagged, it is intended for strategic, low-frequency context, not intraday or short-term use.
█ SETTINGS
- FRED series (symbol, default FRED:BOGZ1FL153064486Q): the economic series the script requests and contextualizes.
- Shade posture zones (on or off, default on): toggles the background tint that colors the pane by the active zone.
- Show info table (on or off, default on): toggles the top-right summary table.
- Bottom-quintile (cheap) below (number, default 14.0): the upper bound of the lowest zone, in percent.
- Top-quintile (underweight) above (number, default 28.0): the level above which the reading is treated as elevated.
- Above historical range above (number, default 39.0): the level above which the reading is treated as beyond the historical range.
█ WHAT MAKES IT ORIGINAL
The script does not compute a price-based study. It is a self-contained method for contextualizing a single external economic series on a chart. Its construction is specific: it pulls the series live through request.security; it ranks the current reading against a historical distribution embedded directly in the script and extended automatically after a cutoff date, so the percentile is point-in-time and does not depend on how much chart history is loaded; it maps the reading to posture zones by user thresholds; and it computes an indicative estimate from a fixed linear fit while explicitly flagging when the current reading lies beyond the data range that produced the fit. The combination of an embedded, self-extending baseline for percentile ranking, the posture zoning, and the extrapolation flag, presented together for this macro series in one pane and table, is what distinguishes it. It applies no proprietary formula on price; the contribution is the contextualization method.
█ NOTES / LIMITATIONS
- Data dependence: the script plots an external economic series, not chart price, and requires access to the configured economic symbol through your data subscription. If the symbol cannot be resolved the request returns na, the line does not plot, and the table shows n/a.
- Chart history and rendering: the percentile baseline and the table are independent of chart history because the baseline is embedded in the script, but the plotted line spans only the bars loaded on the chart, so on a short chart the visible line is short. The table is built only on the last bar.
- Frequency and revision: the source is quarterly and reported with a lag, so the value changes only when a new quarter is published, and the most recent value can be revised by the source.
- Request behavior: the series is requested with lookahead disabled, so no future data is placed on historical bars, and values are carried forward between releases. Historical readings do not repaint; only the most recent reading can change as the source releases or revises a quarter.
- Baseline granularity and cutoff: the embedded baseline holds one value per year (annual year-end) from 1945 through 2025, and live values are appended only after the hardcoded Q4 2025 cutoff, so the percentile reference is annual before that date and extends quarterly thereafter.
- Extrapolation: the indicative estimate is fit over readings up to 38.7, and current readings exceed that, so the estimate lies outside the fitted range and is flagged as such.
- Symbol scope: the script is independent of the chart symbol and can be applied to any chart, since it does not read the chart's price.
This script displays historical economic data and a derived estimate for research and educational purposes. It is not investment advice.
Indicatore
HAP 3 Pressure BandsHAP 3D Pressure Bands
HAP (Hybrid Adaptive Pressure Bands) is a price-overlay indicator designed to visualize momentum pressure, volatility compression, and expansion directly on the chart without requiring a separate oscillator panel.
Unlike traditional Bollinger Bands, which are built purely from price volatility, HAP derives its structure from RSI behavior and projects that information back onto the price chart. This creates a dynamic pressure field that adapts to both momentum and volatility conditions.
The indicator calculates an RSI-based equilibrium zone and transforms it into a price-scaled band structure. The result is a visual representation of market pressure, allowing traders to identify periods of contraction, expansion, and potential breakout conditions.
━━━━━━━━━━━━━━━━━━━━
HOW IT WORKS
━━━━━━━━━━━━━━━━━━━━
• RSI Engine
The core of the indicator is built around RSI. The average RSI and its standard deviation create an adaptive momentum envelope.
• Dynamic Price Projection
Instead of displaying RSI in a separate panel, HAP converts RSI deviations into price-scaled bands using market volatility. This projects momentum information directly onto the chart.
• 3D Pressure Bands
The layered fills create a depth effect that highlights areas of compression and expansion. The visual intensity increases as pressure builds inside the structure.
• Squeeze Detection
When band width contracts below its historical average, the indicator enters a squeeze state. This represents reduced volatility and potential energy accumulation.
• Release Signals
A squeeze release occurs when the market exits a compressed state. These events often precede strong directional moves and can help traders identify expansion phases.
━━━━━━━━━━━━━━━━━━━━
HOW TO USE
━━━━━━━━━━━━━━━━━━━━
Bullish Conditions:
• Price breaks and holds above the upper pressure band.
• Squeeze releases upward.
• RSI pressure expands after a compression phase.
Bearish Conditions:
• Price breaks and holds below the lower pressure band.
• Squeeze releases downward.
• Momentum pressure expands to the downside.
Neutral Conditions:
• Price remains inside the band structure.
• Market is balancing between buyers and sellers.
• Compression may be building for a future breakout.
━━━━━━━━━━━━━━━━━━━━
INTERPRETATION
━━━━━━━━━━━━━━━━━━━━
The bands should not be viewed as traditional support and resistance levels. Instead, they represent dynamic pressure zones where market participants are either accumulating energy or releasing it.
Narrow bands indicate compression.
Wide bands indicate expansion.
Breakouts outside the pressure field suggest a potential shift in market control.
HAP is not intended to predict future price movements. It is designed to visualize the relationship between momentum and volatility in a way that is intuitive, clean, and directly integrated into the price chart.
Best used alongside trend analysis, market structure, volume studies, and higher timeframe confirmation.
HAP 3D Pressure Bands
HAP (Hybrid Adaptive Pressure Bands), momentum baskısını, volatilite sıkışmasını ve genişlemesini doğrudan fiyat grafiği üzerinde göstermek amacıyla tasarlanmış bir fiyat üstü (overlay) göstergedir.
Klasik Bollinger Bantları yalnızca fiyat volatilitesine dayanırken, HAP yapısını RSI davranışından oluşturur ve bu bilgiyi tekrar fiyat grafiğine taşır. Böylece hem momentum hem de volatiliteyi dikkate alan dinamik bir baskı alanı oluşturur.
Gösterge, RSI'ın ortalama ve standart sapma yapısını kullanarak bir denge bölgesi hesaplar. Daha sonra bu yapı fiyat ölçeğine dönüştürülerek grafik üzerine yerleştirilir. Sonuç olarak yatırımcılar piyasadaki sıkışma, genişleme ve olası kırılım bölgelerini daha net görebilir.
━━━━━━━━━━━━━━━━━━━━
NASIL ÇALIŞIR?
━━━━━━━━━━━━━━━━━━━━
• RSI Motoru
Göstergenin temelinde RSI bulunur. RSI'ın ortalaması ve standart sapması adaptif bir momentum zarfı oluşturur.
• Dinamik Fiyat Projeksiyonu
RSI ayrı bir panelde gösterilmek yerine, fiyat volatilitesi kullanılarak fiyat grafiğine dönüştürülür. Böylece momentum bilgisi doğrudan fiyatın üzerinde görüntülenir.
• 3D Baskı Bantları
Katmanlı dolgu yapısı sıkışma ve genişleme bölgelerini görsel olarak daha belirgin hale getirir. Baskı arttıkça bantların görsel yoğunluğu da artar.
• Sıkışma (Squeeze) Tespiti
Bant genişliği kendi tarihsel ortalamasının altına düştüğünde gösterge sıkışma durumuna geçer. Bu durum genellikle volatilitenin azaldığını ve enerjinin biriktiğini gösterir.
• Release (Boşalma) Sinyalleri
Sıkışma sona erdiğinde oluşan release sinyalleri, piyasanın yeni bir hareket başlatabileceğini gösterir. Bu bölgeler çoğu zaman güçlü yönlü hareketlerin başlangıç noktaları olabilir.
━━━━━━━━━━━━━━━━━━━━
NASIL KULLANILIR?
━━━━━━━━━━━━━━━━━━━━
Yükseliş Senaryosu:
• Fiyat üst baskı bandının üzerine çıkar ve üzerinde tutunur.
• Squeeze yukarı yönlü sonlanır.
• Momentum baskısı sıkışma sonrasında genişlemeye başlar.
Düşüş Senaryosu:
• Fiyat alt baskı bandının altına iner ve altında kalır.
• Squeeze aşağı yönlü sonlanır.
• Momentum baskısı aşağı yönde genişler.
Nötr Senaryo:
• Fiyat bant yapısının içinde hareket eder.
• Alıcı ve satıcılar arasında denge oluşur.
• Gelecekteki olası kırılım için enerji birikiyor olabilir.
━━━━━━━━━━━━━━━━━━━━
YORUMLAMA
━━━━━━━━━━━━━━━━━━━━
Bu bantlar klasik destek ve direnç bölgeleri olarak değerlendirilmemelidir. HAP'ın amacı fiyatın etrafındaki baskı alanlarını göstermek ve piyasanın enerji biriktirdiği veya enerjiyi serbest bıraktığı bölgeleri görselleştirmektir.
Dar bantlar sıkışmayı,
Geniş bantlar genişlemeyi,
Bant dışı hareketler ise olası kontrol değişimini ifade eder.
HAP geleceği tahmin etmeyi amaçlayan bir gösterge değildir. Amaç, momentum ile volatilite arasındaki ilişkiyi sade, görsel ve anlaşılır bir yapıda fiyat grafiğinin üzerine taşımaktır.
En iyi sonuçlar trend analizi, piyasa yapısı, hacim çalışmaları ve üst zaman dilimi teyitleri ile birlikte kullanıldığında elde edilir.
Indicatore
Generalized Fisher Transform [LB] Concept
The Generalized Fisher Transform extends John F. Ehlers' classic Fisher Transform (2002) by introducing an adjustable shape parameter that controls the sensitivity profile of the transformation. While the original Fisher Transform maps any normalized input to a near‑Gaussian output to highlight statistical extremes, this generalized version allows traders to emphasize central regions (shape < 1) or extreme tails (shape > 1) depending on their strategy.
Mathematical Foundation
The indicator first normalizes price to a bounded range using a rolling min‑max window of length N :
x = 2 × (P - L_min) / (H_max - L_min) - 1
A signed power is then applied with a shape factor p :
x_p = sign(x) × |x|^p
The generalized Fisher Transform is computed as :
F = 0.5 × ln( (1 + x_p) / (1 - x_p) )
When p = 1 , the formula reduces to the classic Fisher Transform. Values of p < 1 amplify sensitivity near zero (central price region), while p > 1 amplify sensitivity near the edges (extreme price region). The result is smoothed by an EMA for noise reduction.
What Problem Does It Solve ?
Classic oscillators such as RSI or Stochastic use fixed non‑linear mappings that cannot adapt to different market regimes or trader preferences. The classic Fisher Transform offers a single sensitivity profile. The Generalized Fisher Transform solves this by exposing the shape parameter p , giving traders direct control over where the indicator is most responsive — near the mean or near the extremes — without changing the underlying logic or introducing additional indicators.
How To Interpret
The indicator operates in two selectable modes :
Extremes Mode – the background turns red when Fisher exceeds the upper threshold (statistically overbought), and green when it drops below the lower threshold (statistically oversold). These zones suggest potential mean‑reversion.
Direction Mode – the background turns cyan when Fisher is above zero (bullish bias) and orange when below zero (bearish bias). This mode is suited for trend‑following or directional confirmation.
In both modes, the Fisher line crossing zero indicates a shift in the price distribution relative to its recent range.
Parameters
Source – price data used for the calculation (default: close).
Normalization Period – number of bars used to compute the rolling min‑max for the normalization.
Shape Factor – exponent applied to the normalized price before the Fisher transform. 1 = classic Fisher, < 1 = center‑sensitive, > 1 = tail‑sensitive.
Smoothing Period – EMA length applied to the raw Fisher output.
Coloration Mode – switches between "Extremes" (overbought/oversold highlighting) and "Direction" (bullish/bearish highlighting).
Upper Threshold – Fisher level above which the background turns red in Extremes mode.
Lower Threshold – Fisher level below which the background turns green in Extremes mode.
Reference
Ehlers J.F., "Using the Fisher Transform", Technical Analysis of Stocks & Commodities, Vol. 20, No. 11, pp. 40‑45, November 2002.
Ehlers J.F., "Cybernetic Analysis for Stocks and Futures", Chapter 4 – The Fisher Transform, John Wiley & Sons, 2004.
Indicatore
OBV StdDev Trend BreakoutOverview
OBV StdDev Trend Breakout is a volume-based trend indicator built on On-Balance Volume. It compares OBV against its moving average and applies standard deviation bands to identify meaningful breakout conditions, then uses the OBV relationship to its average as the trend filter to confirm bullish or bearish bias.
How It Works
The indicator calculates upper and lower standard deviation bands around OBV. A bullish signal is triggered when OBV breaks above the prior upper band while remaining above its moving average, indicating expanding upside volume pressure with trend confirmation. A bearish signal is triggered when OBV breaks below the prior lower band while remaining below its moving average, indicating expanding downside volume pressure with trend confirmation. Once a bias is established, it persists until the opposing condition is met.
Visual Features
OBV line color updates dynamically based on the current bullish or bearish state.
Upper and lower standard deviation bands are calculated and used internally for breakout logic.
A normalized OBV baseline at 1 provides a clean reference for whether OBV is above or below its average.
Candle colors update to reflect the current OBV bias on the chart.
Inputs
SMA Period - controls the moving average length used as the trend baseline.
Standard Deviation Length - controls the lookback for standard deviation band calculation.
Standard Deviation Multiplier - adjusts the width of the bands.
Alerts
Bullish OBV Breakout: OBV breaks above the upper standard deviation band and remains above its moving average.
Bearish OBV Breakout: OBV breaks below the lower standard deviation band and remains below its moving average.
Indicatore
Rainbow Moving Average with Crossover SignalsRainbow Moving Average is a trend-following indicator designed to visualize market structure, momentum shifts, and moving average alignment through a layered MA system.
This version combines multiple moving averages into a dynamic “rainbow” structure while adding automatic crossover signal detection for improved trend confirmation and timing.
## Features
* 7 configurable Moving Averages
* Supports multiple MA types:
* EMA
* SMA
* HMA
* RMA (SMMA)
* WMA
* VWMA
* Colored rainbow visualization for trend clarity
* Bullish crossover detection
* Bearish crossover detection
* Visual signal dots directly on the chart:
* Green dot = bullish crossover
* Red dot = bearish crossover
* Built-in TradingView alert conditions
## How It Works
The indicator monitors the crossover between the fast moving average (MA1) and the slower moving average (MA2).
* When MA1 crosses above MA2:
* A green dot appears below the candle
* Indicates potential bullish momentum
* When MA1 crosses below MA2:
* A red dot appears above the candle
* Indicates potential bearish momentum
The rainbow structure helps traders quickly identify:
* Trend direction
* Momentum acceleration
* Compression and expansion phases
* Potential reversals
## Best Use Cases
This indicator can be used for:
* Trend following
* Intraday trading
* Swing trading
* Momentum analysis
* Market structure confirmation
Works effectively on:
* Forex
* Indices
* Crypto
* Stocks
* Futures
## Alerts
TradingView alert conditions are included for both bullish and bearish crossover events, allowing full automation compatibility.
## Disclaimer
This indicator is intended for educational and analytical purposes only. Always use proper risk management and combine signals with additional confirmation tools before making trading decisions.
Indicatore
Mean Reversion ZonesMean Reversion Zones is an indicator that helps evaluate how far price has deviated from the balance line.
The indicator builds a dynamic mean-reversion channel around the calculated balance line. The upper red zones show areas where price has deviated above balance. The lower green zones show areas where price has deviated below balance. The central grey area represents the balance zone, where price is closer to its current average value.
This tool is designed to help traders read market context, identify stretched price conditions, and understand where the market is currently located: near balance, above balance, below balance, or inside an extreme deviation zone.
How it works
The script uses endpoint kernel smoothing to calculate a non-repainting balance line. Around this line, it builds several adaptive zones based on the mean absolute deviation of price from balance and current volatility conditions.
The channel can work in two width modes:
Fixed : the channel width is calculated based on the selected multiplier.
Adaptive : the channel expands and contracts depending on the current ATR compared with its average value.
The zones are divided into several areas:
Balance Zone : price is close to its average value.
Upper Risk Zone : price has deviated above balance.
Upper Extreme / Outer Risk Zone : price is strongly stretched to the upside.
Lower Opportunity Zone : price has deviated below balance.
Lower Extreme / Outer Opportunity Zone : price is strongly stretched to the downside.
Extreme dots
Red dots appear only when price reaches the upper extreme area or moves above the outer upper zone.
Green dots appear only when price reaches the lower extreme area or moves below the outer lower zone.
These dots are not trading signals. They are visual markers showing that price has reached a statistically stretched area relative to the current balance line.
Dashboard
The Dashboard briefly shows the current market context:
Zone : the current position of price inside the channel.
Reading : a simple text description of the current deviation.
Trend : EMA-based trend context: Uptrend, Downtrend, or Sideways.
Volatility : current ATR compared with its average value.
Hint : an educational context hint, not a trading recommendation.
How to use
The indicator may be useful for traders who want to answer several questions:
1. Is price close to balance or already far away from it?
2. Has the market deviated upward or downward?
3. Is the current deviation moving with the trend or against it?
4. Is volatility normal, high, or extreme?
5. Is it better to wait for price to return closer to balance before making a decision?
Important limitations
The indicator does not predict future price movement.
Upper zones are not automatic short signals. Lower zones are not automatic long signals. Extreme dots are not entry signals. They only show that price is currently stretched relative to the calculated balance line.
Mean-reversion tools can remain in a stretched condition for a long time during strong trends. Therefore, this indicator should always be used together with market structure analysis, trend analysis, volume, risk management, and your own trading plan.
Alerts
The script includes alerts for the following events:
Price enters the upper risk zone.
Price enters the extreme upper risk zone.
Price moves above the outer upper risk zone.
Price enters the lower opportunity zone.
Price enters the extreme lower opportunity zone.
Price moves below the outer lower opportunity zone.
Price returns to the balance zone.
These alerts are intended only for tracking market context and should not be treated as standalone trading signals.
Indicatore
CLEAN Combo Signal EditionHauptfunktionen
Der Indikator erkennt mögliche Einstiege durch:
BUY-Signale
Bounce aus einer Demand-Zone
Reclaim über EMA 21
EMA 5 / EMA 21 Bull-Cross
Breakout über eine Supply-Zone
Bestätigung durch SMA 9 Momentum
SELL-Signale
Ablehnung an einer Supply-Zone
Bruch einer Demand-Zone
EMA 5 / EMA 21 Bear-Cross
Bestätigung durch SMA 9 Momentum
Enthaltene Filter
Der Indikator nutzt mehrere Filter, um schlechte Signale zu reduzieren:
SMA 9 Momentum-Filter
Volumenfilter
ADX-Trendstärke
Seitwärtsphasen-Blocker
EMA 200 Trendfilter
HTF-Bestätigung
BUY nahe Supply blockieren
SELL nahe Demand optional blockieren
BUY/SELL Cooldown, um doppelte Signale im gleichen Impuls zu vermeiden
Zonen-Logik
Demand- und Supply-Zonen werden automatisch anhand von Pivot-Strukturen und erhöhtem Volumen erkannt.
Grüne Zonen zeigen mögliche Käuferbereiche.
Rote Zonen zeigen mögliche Verkäuferbereiche.
BUY-Signale werden bevorzugt in oder nahe Demand-Zonen gesucht.
SELL-Signale werden bevorzugt in oder nahe Supply-Zonen oder nach Bruch einer Demand-Zone gesucht.
Indicatore
Ultimate PA Confirm + Auto TP/SL (M5/M15) by TURBO TRADERKey Features
M5 / M15 Price Action Detection: Automatically scans and detects high-probability Bullish/Bearish Engulfing and Pin Bar patterns on lower timeframes.
1-Bar Confirmation Logic (No Repaint): Signals are strictly calculated and printed on the open of the next candle after the confirmation bar closes. This guarantees 100% fixed, non-repainting signals.
Dynamic Auto TP1 / TP2 Levels: Profit targets are entirely volatility-based, calculated dynamically using the actual measured range (High to Low) of the trigger Price Action candle.
SL Buffer (+300 Pips/Points): Automatically places the Stop Loss 300 pips/points below the low (for Buys) or above the high (for Sells) of the PA candle. This structural buffer protects your trades from market noise and stop hunts.
Visuals on the Chart
Once applied, the indicator projects 3 dynamic, color-coded levels on your chart:
🔴 Red Line = Stop Loss (SL with buffer)
🟢 Green Line = Take Profit 1 (TP1)
🔵 Blue Line = Take Profit 2 (TP2)
All levels are recalculated and locked instantly whenever a fresh "BUY CONFIRM" or "SELL CONFIRM" printed signal occurs.
Fully Customizable Settings
Simply double-click the indicator on your chart to open the Settings menu. From there, you can fine-tune:
Candle Proportions: Adjust body-to-wick ratios to make the Price Action scanner more strict or aggressive.
Risk-to-Reward Multipliers: Modify TP1 and TP2 targets.
SL Buffer Size: Scale the 300-pip default buffer up or down depending on current market volatility or the asset's spread.
Built to handle high-velocity markets—fast execution, zero lag!
Indicatore
P&D Short Signal v4.0 [4H]═══════════════════════════════════════════════════════════
TRADINGVIEW PUBLISH — P&D Short Signal v4.0
Author: Kevko87 | Open Source
═══════════════════════════════════════════════════════════
TITLE:
P&D Short Signal v4.0 — Pump & Dump Distribution Detector
───────────────────────────────────────────────────────────
SHORT DESCRIPTION (shown in search):
───────────────────────────────────────────────────────────
Detects post-pump distribution phases on crypto futures using
OBV, RSI divergence, MFI, and Delta-Volume across 4H / 1H / Daily.
Generates Tier 1 and Tier 2 short signals with auto TP/SL levels.
───────────────────────────────────────────────────────────
FULL DESCRIPTION:
───────────────────────────────────────────────────────────
## P&D Short Signal v4.0
This indicator identifies **post-pump distribution phases** on crypto
perpetual futures, designed to catch the dump after a Pump & Dump cycle.
Built and validated on Bitget Futures over 30+ live trading sessions.
---
### How it works
The indicator uses a **multi-timeframe confluence approach**:
- **4H** — Base timeframe (OBV slope, RSI, MFI, Delta-Volume)
- **1H** — OBV confirmation
- **Daily** — Gate-keeper: coins with Daily OBV > 500M are skipped
(high OBV = genuine buying pressure = no short)
A signal fires only when multiple conditions align simultaneously,
filtering out noise and false setups.
---
### Signal Tiers
**🔴 TIER 1 — High Confidence (≥85%)**
- Daily OBV < 500M (gate-keeper passes)
- 4H OBV falling + 1H OBV falling (distribution confirmed)
- RSI > 65 AND (bearish divergence OR below MA)
- MFI > 75 AND falling for 2+ bars
- Delta-Volume negative (optional, toggleable)
**🟠 TIER 2 — Moderate Confidence (~70%)**
- Daily OBV < 500M
- 4H OBV falling
- RSI > 65
- MFI > 65 AND falling
**🔴 MFI Extreme Background Alert**
- MFI ≥ 85 and falling with valid Daily OBV
- Precursor warning — check OBV manually
---
### Auto TP / SL
On every signal, the indicator automatically plots:
- **SL**: Entry High + ATR × 3 (default)
- **TP1**: −15% | **TP2**: −25% | **TP3**: −40% | **TP4**: −60%
All levels fully adjustable via inputs.
---
### Status Table (top right)
Live dashboard showing the current state of all filters:
D-OBV · OBV 4H · OBV 1H · RSI · MFI · Delta · D-RSI · Signal · Trade
---
### Alerts
Three built-in alert conditions:
- 🔴 TIER 1 SHORT
- 🟠 TIER 2 SHORT
- ⚠️ MFI EXTREME
Set alerts via TradingView's alert manager on any ticker.
---
### Recommended Usage
- **Market**: Crypto perpetual futures (Bitget, Bybit, Binance)
- **Timeframe**: 4H (indicator is built for 4H, do not use on other TFs)
- **Best targets**: Low-cap coins after +30–50% pumps within 24h
- **Risk management**: Always use the auto-generated SL. DCA entries
recommended for high-ATR setups.
---
### Key Filter: Daily OBV Gate
The most important filter in this system. If Daily OBV > 500M,
the move has genuine buying pressure behind it — shorting against
that is high risk. The indicator automatically skips these coins.
---
### Inputs
| Parameter | Default | Description |
|-----------|---------|-------------|
| Daily OBV Max | 500M | Skip coins above this OBV |
| OBV Slope Bars | 3 | Lookback for OBV direction |
| RSI Length | 14 | Standard RSI period |
| RSI Min for Entry | 65 | Minimum RSI for overbought |
| Divergence Lookback | 5 | Bars for price/RSI divergence |
| MFI Length | 14 | Standard MFI period |
| MFI Min Tier 1 | 75 | MFI threshold for Tier 1 |
| MFI Min Tier 2 | 65 | MFI threshold for Tier 2 |
| MFI Extreme | 85 | Background alert level |
| SL ATR Multiplier | 3.0 | Stop loss distance |
| TP1–TP4 | 15/25/40/60% | Take profit levels |
---
### Changelog
**v4.0**
- Base timeframe changed from 1H to 4H (higher win rate in backtesting)
- 5 bars on 4H = 20h = one full pump cycle captured
- Tier 1: RSI divergence OR below MA (previously required both)
- MTF structure: 4H base / 1H confirmation / Daily gate-keeper
- Status table added
---
*Open source. Use at your own risk. Not financial advice.*
*Built by Kevko87 — validated on live crypto futures trading.*
Indicatore
Rajiv Fibonacci OTERajiv Fibonacci OTE RR System
The Rajiv Fibonacci OTE RR System is a smart multi-timeframe trading indicator designed for intraday and swing trading.
It combines Higher Timeframe Fibonacci retracement, OTE (Optimal Trade Entry) zone, and ATR-based Risk Management to generate high-probability BUY and SELL setups with automatic Entry, Stoploss, and Target levels.
Main Features
1. Multi-Timeframe Fibonacci
The script automatically calculates Fibonacci retracement levels from a higher timeframe candle.
Default HTF:
Daily timeframe (D)
Key levels:
0.50
0.618
0.786
These levels help identify:
institutional retracement zones
pullback entries
continuation setups
2. OTE Zone (Optimal Trade Entry)
The indicator highlights the:
0.618 to 0.786 Fibonacci zone
This zone is considered a:
smart money retracement area
institutional entry zone
trend continuation zone
Yellow shaded area visually marks the OTE region.
3. Automatic BUY & SELL Signals
BUY Signal
Generated when:
price crosses above 0.618 Fib level
price remains above 0.50 level
SELL Signal
Generated when:
price crosses below 0.618 Fib level
price remains below 0.50 level
Signals appear directly on chart.
4. ATR-Based Stoploss
The script uses:
SL=Entry±(ATR×Multiplier)
This creates dynamic stoploss levels based on market volatility.
Benefits:
adaptive risk control
works in all market conditions
avoids fixed stoploss problems
5. Risk Reward Targets
The indicator automatically calculates:
Target 1 → Risk Reward 1:2
Target 2 → Risk Reward 1:3
Target 3 → Risk Reward 1:4
Formula:
Target=Entry±(Risk×RR)
This ensures:
proper trade management
disciplined exits
professional risk handling
6. Automatic Lines
The script draws live chart levels for:
Entry
Stoploss
TP 1:2
TP 1:3
TP 1:4
This helps traders visualize:
trade structure
risk zones
reward zones
7. Alerts Included
Built-in TradingView alerts:
BUY Signal
SELL Signal
Useful for:
mobile notifications
automation
scanner setups
Best Timeframes
Recommended:
5 Min
15 Min
30 Min
1 Hour
Best suited for:
NSE Stocks
BankNifty
Nifty
Futures
Intraday Momentum Trading
Trading Style
Works best in:
trending markets
pullback continuation setups
momentum breakout conditions
Avoid during:
extremely sideways markets
low volatility sessions
Strategy Logic
The indicator follows:
Higher timeframe trend
Fibonacci retracement
OTE institutional zone
ATR volatility stoploss
Fixed professional risk reward
Indicatore
RSI Lead MomentumRSI Lead Momentum Engine is an advanced evolution of the classic RSI specifically designed for scalping and day trading on fast-moving markets such as Nasdaq (NQ), US100, CFD indices, and futures.
Unlike traditional RSI indicators that mainly react after price movement occurs, this indicator is designed to detect situations where RSI momentum leads the actual price structure.
Its primary objective is to identify pre-impulsive market phases in order to provide early entries before major directional expansions.
## Core Concept
The indicator analyzes the structural disconnection between:
* RSI structure,
* RSI slope,
* momentum acceleration,
* and real price structure.
The “RSI Lead” engine specifically detects situations where:
* RSI breaks a previous swing low or swing high,
* RSI momentum accelerates aggressively,
* while price has not yet confirmed the breakout or breakdown.
This behavior frequently appears on fast algorithmic markets and can signal:
* upcoming bullish or bearish continuation,
* volatility expansion phases,
* institutional momentum building before visible price displacement.
## Features
### RSI Lead Momentum Engine
Early signal detection:
* Early SELL
* Early BUY
Based on:
* RSI structural breaks,
* momentum acceleration,
* price compression,
* price lag versus RSI.
### RSI Divergences
Built-in detection:
* Regular Bullish
* Regular Bearish
### Compression & Momentum Explosion
Detection of:
* volatility compression,
* explosive momentum expansion.
### Dynamic RSI Coloring
Automatic RSI coloring based on:
* bullish momentum,
* bearish momentum,
* acceleration,
* breakout conditions.
### Detection Modes
* FAST → ultra-reactive mode for aggressive scalping.
* CONFIRMED → cleaner signals with additional price confirmation.
## Optimized For
* Nasdaq / NQ
* US100
* 1m / 2m / 5m scalping
* Momentum day trading
* Continuation setups
* Early entries
* Fast breakdowns and breakouts
## Indicator Philosophy
This indicator does not treat RSI as a simple overbought/oversold oscillator.
Instead, RSI is treated as:
an advanced directional pressure engine capable of anticipating certain price displacements before they become visually obvious on the chart.
The core of the algorithm is therefore based on:
detecting momentum displacement before price displacement.
Indicatore
Indicatore
Trend Pulse OBVTrend Pulse OBV Strategy
Trend Pulse OBV is an educational long-only strategy designed to study trend-channel breakouts that are confirmed by volume flow and a higher-level regime filter.
The strategy combines three main ideas:
1. A Trend Pulse Channel breakout.
2. OBV confirmation using On-Balance Volume relative to its EMA.
3. A regime filter using price relative to an EMA.
The purpose of the script is to test whether upside breakouts above an adaptive channel are more selective when confirmed by both volume accumulation and broader trend direction.
This is a strategy script for research, backtesting, and forward-testing only. It is not financial advice, does not predict future price movement, and does not guarantee profitable results. Historical strategy results are hypothetical and can differ significantly from live trading because of slippage, commissions, liquidity, spread, execution quality, timeframe selection, and market regime changes.
Core concept
The strategy is built around a Trend Pulse Channel. The channel uses a smoothed filter based on the selected source price and a filtered true-range calculation to create an upper breakout band.
A long entry can occur when price crosses above the Trend Pulse Channel upper band, but only if the selected confirmation filters are satisfied.
The strategy does not open short positions.
Entry logic
A long entry occurs when all selected conditions are satisfied:
* Price crosses above the Trend Pulse Channel upper band.
* Price is within the selected date range.
* The regime filter is satisfied, if enabled.
* The OBV confirmation filter is satisfied, if enabled.
* No long position is already open.
The strategy is designed to avoid entering every channel breakout. Instead, it requires confirmation that price is breaking out while broader trend and volume conditions support the move.
Trend Pulse Channel
The Trend Pulse Channel is calculated from:
* A selected source price, default HLC3.
* A multi-pole smoothing filter.
* A filtered true-range stream.
* A range multiplier used to define the upper band.
The upper channel band is used as the breakout trigger.
The midline is used as a possible exit reference when the midline exit is enabled.
OBV confirmation filter
The OBV filter compares On-Balance Volume to an EMA of OBV.
When the filter is enabled, long entries are allowed only when OBV is above its EMA. This is intended to require evidence that volume flow supports the upside breakout.
This does not guarantee continuation. It only adds a volume-based confirmation condition to the channel breakout.
Regime filter
The regime filter compares price to a selected EMA.
When enabled, long entries require price to be above the regime EMA. This is intended to reduce long entries during weaker or downward market environments.
The regime EMA can also be used as an exit condition if the regime exit is enabled.
Lag Mode
Lag Mode applies a zero-lag style pre-transform to both the price source and the true-range stream before they are filtered.
This can make the Trend Pulse Channel respond faster to new price movement, but it can also increase sensitivity and may create more false signals in choppy markets.
Exit logic
The strategy has multiple exit mechanisms:
1. ATR stop
At entry, the script calculates a fixed stop price using the previous bar’s ATR multiplied by the selected ATR stop multiplier. This stop remains fixed after entry.
2. Midline exit
When enabled, the strategy exits if price closes below the Trend Pulse Channel midline.
3. Regime EMA exit
When enabled, the strategy exits if price closes below the regime EMA.
The first active exit condition to trigger can close the position.
Risk and position sizing
The default strategy uses percent-of-equity position sizing.
Users should review the default order size carefully before publishing or relying on backtest results. A large percent-of-equity allocation can make historical results look stronger or weaker than they would under more conservative risk assumptions.
For public publication, users should use realistic position sizing, commission, and slippage assumptions that match the market being tested.
Default strategy properties
The script uses the following strategy properties:
* Initial capital: 1,000
* Position sizing: percent of equity
* Default order size: 70% of equity
* Commission: 0.1%
* Slippage: defined in the strategy settings
* Pyramiding: 1
* Fill orders on standard OHLC: enabled
* Calculate on every tick: disabled
* Calculate on order fills: disabled
* Bar magnifier: disabled
* Process orders on close: disabled
* Long-only execution
These values are provided for testing and can be changed by the user. They should not be interpreted as recommended risk settings.
Important backtesting note
TradingView strategy results are simulations based on historical chart data. They are not live trading results.
Backtest results can change significantly depending on:
* Symbol.
* Timeframe.
* Date range.
* Liquidity.
* Spread.
* Commission.
* Slippage.
* Position size.
* Trend Pulse period.
* Number of poles.
* Range multiplier.
* Lag Mode setting.
* OBV EMA length.
* Regime EMA length.
* ATR length.
* ATR stop multiplier.
* Exit settings.
* Market regime.
Users should test the strategy on a sufficiently large number of trades and across different market conditions before drawing conclusions. A small sample of trades is not enough to evaluate a strategy reliably.
How to use it
A practical workflow is:
1. Select the symbol and timeframe to test.
2. Use a realistic date range that includes different market regimes.
3. Confirm that the strategy produces a sufficient number of trades.
4. Adjust commission and slippage to reflect the market being tested.
5. Review whether the percent-of-equity order size is suitable.
6. Compare results with the OBV filter on and off.
7. Compare results with the regime filter on and off.
8. Compare exits using the midline exit, regime exit, and ATR stop behavior.
9. Forward-test before considering any real-world use.
Inputs
Date Range
* Start Date: first date included in the backtest.
* End Date: last date included in the backtest.
Trend Pulse Channel
* Source: price source used in the channel calculation.
* Poles: smoothing pole count used by the filter.
* Period: main channel smoothing period.
* Range Multiplier: controls the distance of the upper channel band.
* Lag Mode: applies the zero-lag pre-transform before filtering.
OBV Confirmation Filter
* Require OBV > EMA(OBV, N): enables or disables OBV confirmation.
* OBV EMA Length: EMA length applied to OBV.
Regime Filter
* Require close > regime EMA: enables or disables the regime filter.
* Regime EMA Length: EMA length used for the regime filter.
Exit Logic
* Exit on close < TPC midline: exits when price closes below the channel midline.
* Exit on close < regime EMA: exits when price closes below the regime EMA.
Risk — ATR Stop
* ATR Length: ATR period used for stop calculation.
* ATR Stop Multiplier: ATR multiplier used to set the fixed stop distance at entry.
Visual elements
The strategy plots:
* Trend Pulse Channel upper band.
* Trend Pulse Channel midline.
* Regime EMA.
* Long entry markers.
* Long exit markers.
Limitations
This strategy is long-only and does not evaluate short trades.
The strategy can underperform during sideways, choppy, low-volume, or news-driven conditions.
OBV confirmation can reduce some weak breakouts, but it cannot eliminate false breakouts.
The regime EMA is a lagging trend filter and may delay entries or exits.
The ATR stop is fixed at entry and may not adapt to changing volatility after the trade opens.
A breakout above the channel does not guarantee trend continuation.
No backtest can guarantee future performance.
Recommended use
Trend Pulse OBV is used as an educational framework for studying channel breakout behavior with volume-flow confirmation and regime filtering.
It should be used with realistic backtesting assumptions, conservative position sizing, and independent validation before any trading decision.
Strategia
V2 Institutional MACD (Z-Score Edition) [VolumeVigilante]all the credit goes to . I just added an automation for the scanning of higher timeframes. See www.tradingview.com for the original
Indicatore
Compass | AnonycryptousCompass | Anonycryptous
Description & user manual
Credits
The weekly psychological level calculation in this indicator is based on open-source code originally published on TradingView. The original script was created by plasmapug. Continued development was done by infernixx, Peshocore, and xtech5192 in collaboration with TradersReality. Significant modifications have been made to integrate this component into the Compass framework.
Why this indicator is different
Most indicators answer one question. A moving average tells you the trend direction. An oscillator tells you momentum. A session box tells you the time. A volume indicator tells you participation. Each one is useful. None of them tells you where you are.
Before placing a trade, a trader needs to answer several questions simultaneously. What session is active and what does that mean for the type of price action to expect? Where does the macro trend stand? Is volume confirming the move or contradicting it? Are there open imbalances nearby that price may return to? How much of the day's expected range has already been consumed? Where are the key structural levels — pivots, the daily open, prior week references?
Answering each of these questions separately requires stacking tool after tool until the chart becomes unreadable. Compass answers all of them at once.
It is not a signal indicator. It does not fire arrows or tell you when to buy or sell. What it does is something more fundamental: it gives you a complete read of the market environment before any decision is made. Sessions, trend, volume, imbalances, range levels, pivots, psychological references — all in one overlay, all configurable, all on one chart.
The design philosophy is orientation first. Decision second. Compass tells you where you are. What you do with that is your responsibility.
Important notice
Compass does not generate trading signals.
It does not tell you when to buy or sell.
It does not predict market direction.
It does not replace your trading strategy or your own analysis.
All illustrative examples in this manual are for educational purposes only and are not trading recommendations.
All trading decisions remain entirely with the user.
Always apply your own judgment and manage your own risk.
1. Overview
Compass is a comprehensive market context indicator that combines eleven independent analysis frameworks into one unified overlay. Every component is individually toggleable. Six presets are included for different trading styles, from fast scalping to full multi-component analysis.
What it includes:
- Five-EMA suite with adaptive cloud around the EMA 50
- EMA crossover system with configurable signals and candle coloring
- Stochastic RSI background alerts with four alert types and RSI divergence detection
- PVSRA volume vector candle analysis with zone tracking and configurable thresholds
- Eight global market sessions with automatic DST awareness
- Average daily, weekly, and monthly range levels with 50% midpoints
- Classic pivot points with mid-point levels
- Daily open reference line with historical opens
- Fair value gap detection with partial absorption tracking
- Weekly psychological level tracking
- Live dashboard with eighteen data points across all active components
2. EMA suite
Five exponential moving averages are plotted simultaneously: EMA 5, EMA 13, EMA 50, EMA 200, and EMA 800. Together they cover short-term momentum, medium-term trend direction, macro trend, and long-term structural bias.
The EMA 50 is wrapped in a dynamic cloud calculated from two standard deviations of price. The cloud expands during volatility and contracts during consolidation. A widening cloud indicates active price discovery. A thinning cloud indicates equilibrium or compression before a directional move.
The EMA 200 is the primary macro bias filter. Price above it defines a broadly bullish environment. Price below it defines a broadly bearish environment. This is shown in the dashboard at all times.
The EMA 800 provides long-term structural context, particularly useful on mid to higher timeframes where it marks the gravitational center of multi-month price structure.
All five EMA lengths are configurable. Each has individual color and transparency controls. An EMA label option displays the current value at the right edge of each line.
3. EMA cross system
The EMA cross tracks a configurable fast EMA crossing a configurable slow EMA and marks the crossover bar. All candles after a cross continue in the direction of that cross until the opposite cross fires.
Three display modes are available: show both the fast and slow EMA lines, show a single consolidated EMA line, or hide the EMA lines entirely while keeping the crossover signals visible.
This component is a trend state indicator, not a trade trigger. A bull cross does not mean buy. It means the short-term trend has shifted upward relative to the medium-term average.
Signals and candle coloring can be toggled independently.
4. Stochastic RSI
The stochastic RSI component runs a standard stochastic RSI calculation and generates background color alerts based on crossover conditions at configurable band levels.
Four alert types are available, each independently toggleable:
Middle band crossover — K line crosses D line near the 50 level. Indicates a possible trend shift in momentum.
Overbought/oversold crossover — K line crosses D line from overbought or oversold territory. Indicates a potential reversal from an extreme.
Entering overbought — K line crosses above the upper band. Indicates that momentum has moved into overbought territory.
Entering oversold — K line crosses below the lower band. Indicates that momentum has moved into oversold territory.
The dashboard displays the current stochastic RSI state and the RSI value. RSI appears in green when above the midline and in red when below. Regular bullish and bearish divergence is detected automatically and shown in the dashboard as a directional label. When divergence is active, a thin reference line appears on the price chart marking the divergence candles.
5. PVSRA volume vector analysis
PVSRA analysis colors candles based on volume relative to the 10-bar average and the relationship between volume and candle spread.
Four vector types:
Green vector — bullish bar where volume is at or above the green/red threshold (default 200% of the 10-bar average), or where volume multiplied by spread is the highest of the last 10 bars. Indicates strong bullish institutional participation.
Red vector — same conditions on a bearish bar. Indicates strong bearish institutional participation.
Blue vector — bullish bar where volume is at or above the blue/violet threshold (default 150% of average). Indicates elevated bullish volume below the institutional threshold.
Violet vector — same conditions on a bearish bar. Indicates elevated bearish volume.
Grey — no vector conditions met. Normal volume.
Both thresholds are configurable directly from the settings panel. Blue and violet signals are strictly exclusive from green and red — a bar cannot qualify for both simultaneously.
Vector candle zones draw boxes at each vector candle location and remain active until price moves through the zone, marking areas where elevated institutional activity was detected at the time the candle formed.
The PVSRA override input allows a different symbol to be used for the volume calculation. This is useful when the charted instrument has unreliable volume data, such as CFDs, perpetual swaps, or instruments where the primary volume is on a related market.
6. Market sessions
Eight global trading sessions are tracked simultaneously, each with automatic DST awareness. Sessions are displayed as expanding boxes with high and low lines and a real-time label showing the session open.
Sessions included:
- London: 08:00–16:30 UTC
- New York: 14:30–21:00 UTC
- Tokyo: 00:00–06:00 UTC
- Hong Kong: 01:30–08:00 UTC
- Sydney: 22:00–06:00 UTC
- EU brinks: 08:00–09:00 UTC
- US brinks: 14:00–15:00 UTC
- Frankfurt: 07:00–16:30 UTC
DST is handled automatically for London, New York, and Sydney. No manual adjustment is needed. Each session can be toggled individually, and box color, transparency, and label color are fully configurable per session.
Session context matters because market behavior differs significantly depending on which participants are active. London and New York overlap produces the highest volume and fastest price movement. Tokyo and Sydney sessions tend to consolidate. The brinks windows mark the transition periods where session highs and lows often form.
7. Range levels
Three statistical range frameworks measure the expected price range for the current period based on historical averages.
Average daily range (ADR) — the expected high and low for the current trading day. When price reaches the ADR level, the day's expected range has been consumed. Moves beyond the ADR are extension moves that occur with lower statistical probability and often mean-revert. The dashboard shows ADR % used — how much of today's expected range has already been consumed. Above 80% indicates the day is approaching its expected limit.
Average weekly range (AWR) — the same concept applied to the current week. Useful for assessing how much room the week has left to move.
Average monthly range (AMR) — the same concept applied to the current month. Provides macro context for position sizing and target expectations.
Each framework includes a 50% midpoint level marking the center of the expected range. The ADR measure from daily open option calculates the range starting from that day's open price rather than the statistical high, making the levels static for the entire day.
All three frameworks have individual lookback period inputs, color controls, line styles, and label toggles.
8. Pivot points
Classic pivot points are calculated from the prior day's high, low, and close. Levels include PP, R1/S1, R2/S2, R3/S3, and M mid-point levels between each major level.
Pivot points provide structural reference for the current session. Price above PP defines a broadly bullish day structure. R levels act as potential resistance targets. S levels act as potential support targets. M levels provide intermediate precision references between major pivots.
All levels can be toggled individually. Lines extend rightward from the prior session and can optionally extend in both directions. Each level has individual color and line style controls.
9. Daily open
A horizontal line marks the current day's opening price. This is one of the most referenced structural levels among short-term traders because it defines the starting point for the day's price discovery.
Price above the daily open reflects a bullish session bias. Price below reflects a bearish session bias. When price oscillates around the daily open without committing direction, the session is in balance — a lower probability environment for trend trades.
Historical daily opens can optionally be shown as reference for prior day context.
10. Fair value gaps
A fair value gap is a three-bar imbalance where price moved through a range without leaving two-sided trade — the low of the upper candle is above the high of the lower candle (bullish gap) or vice versa (bearish gap). These areas represent unfinished business where the market may return to achieve balance.
Gaps are filtered by a minimum width threshold expressed as a multiple of ATR. Gaps narrower than the threshold are excluded. Partial absorption is tracked — as price returns into the gap, the fill color changes to show how much of the imbalance has been recovered.
Fully mitigated gaps can be kept on the chart as historical reference or deleted automatically to maintain a clean view.
11. Psychological levels
Weekly psychological levels mark the prior week's high and low as calculated by a specific session-anchored method. These levels represent deliberate structural references where participants have previously committed size — breakouts and rejections around these levels tend to be more intentional than random price noise.
Three GMT offset options accommodate the session anchor calculation for different global market structures. Two mode options are available: crypto (weekly reset on Saturday Sydney open) and forex (weekly reset on Monday Tokyo open).
12. Settings reference
Preset
- Custom: full manual control over all settings.
- Clean scalper: sessions, EMA suite, FVG, subtle candle coloring. Low noise.
- Full context: everything on, medium transparency. Best for analysis.
- Signal focus: EMA cross, stoch RSI background, PVSRA bar color prominent. Rest subtle.
- Minimal: sessions, daily open, ADR only. No signals.
- PVSRA pro: PVSRA and vector candle zones central. EMA 200 and 800 only.
Global settings
- Master opacity offset (custom preset only): shifts all transparency values simultaneously.
- Show bull/bear label text: shows or hides text on EMA cross signal triangles.
EMA suite
- Show EMA suite and labels
- Individual EMA color and transparency controls
- EMA cloud fill and border transparency
- EMA line width
EMA cross
- Show EMA cross signals
- Fast EMA, slow EMA, and consolidated EMA lengths
- Show both EMAs or consolidated only
- Bull, bear, and neutral colors and transparency
- Cross EMA line width
Stochastic RSI
- Show stochastic RSI background alerts
- RSI length and stochastic length
- Overbought and oversold band levels
- Individual alert type toggles (four types)
- Alert colors and transparency
- RSI divergence lookback period
- Divergence line color and width
PVSRA
- Vector colors (red, green, violet, blue, regular up/down)
- Green/red threshold (× average volume, default 2.0)
- Blue/violet threshold (× average volume, default 1.5)
- Include spread filter for green/red classification
- Override symbol toggle and input
- Show vector candle zones with transparency and width settings
Candle coloring
- Enable candle coloring
- Coloring mode: EMA cross / PVSRA / EMA 200 / off
- Bull and bear candle color and transparency
Market sessions
- Show market sessions
- Session timezone
- Show sessions on weekends
- Session high/low line style and width
- Per session: toggle, box color, transparency, label color
Range levels
- Show ADR, AWR, AMR (individual toggles)
- Lookback periods for each
- Show 50% midpoint levels
- Measure from daily open (ADR only)
- Color, transparency, line width, line style, labels
Pivot points
- Show PP, R1/S1, R2/S2, R3/S3, M levels individually
- Show labels
- Extend lines both directions
- Individual level colors and line styles
- Pivot line width
Daily open
- Show daily open
- Show label
- Show historical daily opens
- Color, transparency, line width
Fair value gaps
- Show fair value gaps
- Width filter (ATR multiplier)
- Extend to current bar
- Bullish and bearish FVG colors
- Mitigation fill colors
- Keep historical FVGs after mitigation
Psychological levels
- Show psy levels and labels
- Show historical psy levels
- GMT offset (GMT+1, GMT+2, GMT+3)
- Psy type: crypto or forex
- High and low colors and transparency
Dashboard
- Show dashboard
- Position: top left, top right, bottom left, bottom right
- Size: tiny, small, normal
13. Dashboard reference
The dashboard provides eighteen live data points across all active components:
Session — the currently active market session.
EMA cross — current EMA cross direction: bull or bear.
EMA 200 — whether price is above or below the EMA 200.
Stoch RSI — current stochastic RSI condition.
RSI — current RSI value, colored green above midline and red below.
RSI divergence — active bullish or bearish divergence, or none.
PVSRA — current candle vector type.
ADR % used — how much of today's expected daily range has been consumed.
FVG active — count of open unmitigated fair value gaps and mitigation percentage.
Psy level — whether price is above or below the prior week's psychological level.
Timezone — active session timezone setting.
VCZ active — count of active vector candle zones above and below current price.
Pivot PP — current pivot point value.
Daily open — current daily open price and direction.
14. How to use
14.1 Initial setup
Select a preset that matches your primary trading style. Adjust the session timezone to match your location or your primary exchange. If you trade an instrument with unreliable volume data, enable the PVSRA override and set it to a correlated liquid instrument. Set the ADR lookback period to your preference — 14 days is a standard starting point. For FVGs, set the width filter to 0.5 or higher to exclude minor gaps.
14.2 Reading the dashboard
The dashboard is the fastest way to orient yourself on a new chart or a new session. Check session, EMA cross direction, EMA 200 position, stoch RSI state, and ADR consumed before anything else. Five seconds to a full picture of where the market stands.
14.3 Reading the chart
Check EMA alignment. When EMA 13, EMA 50, and EMA 200 are stacked in the same direction, the trend is more significant than a single crossover. Divergence between them reflects a transition or competing timeframe pressures.
Check ADR percentage. Below 50% means the day has statistical room to move. Above 80% means the day is near its expected limit and extension moves are less probable.
Look for open FVGs near current price. An unmitigated FVG in the direction of the prevailing trend is a precision reference area where price has historically returned.
Check the psy level. If price is approaching the prior week's high or low, be aware that participant behavior around those references tends to be deliberate.
14.4 Timeframe guide
1 minute to 3 minutes — clean scalper preset, candle coloring set to EMA cross.
5 minutes to 15 minutes — clean scalper or signal focus preset.
30 minutes to 1 hour — full context preset, use ADR and pivot points.
4 hours to daily — full context or minimal preset.
14.5 Tips
PVSRA override — use when your broker's volume data is unreliable, when you trade a CFD or derivative with synthetic volume, or when you want spot market volume for a futures chart.
Master opacity offset — adding 10 to 20 increases overall transparency and dims the chart if it feels cluttered. Subtracting 10 to 20 makes all elements more prominent. This shifts all transparency values simultaneously without changing individual settings. Only active in custom preset.
Not every component needs to be active at once. Most traders will find three to four components provide the context they need for their specific setup.
15. Disclaimer
This indicator is provided for educational and informational purposes only.
Nothing in this document constitutes financial advice or any form of trading recommendation.
Trading financial instruments involves substantial risk of loss.
Past performance is not indicative of future results.
You may lose all of your invested capital.
All trading decisions are made entirely by the user.
Use at your own discretion.
Indicatore
Indicatore
Volume Profile (Session-Based)A basic volume indicator that shows where buyers and sellers are, is very customizable and helps a lot with having market bias, it also uses labeled lines to show you point of control and session highs and lows.
Indicatore