OBV with Kalman Filter Improv [TechnicalZen]Reversals, Breakouts & Re-Entries: OBV with Kalman Filter Improv
What This Indicator Does
This indicator transforms On-Balance Volume into a visual momentum instrument. Raw OBV is normalized to a 0-100 scale, rendered as stair-step candles with a continuous color gradient, and overlaid with a dual Kalman-filtered ribbon that tracks the flow trend with adaptive precision.
The result is a single pane that answers three questions at a glance: Is volume flow accumulating or distributing? How strong is the conviction? Where are the reversal, breakout, and re-entry points?
No footprint data required. No premium subscription needed. Pure price action and volume.
━━━━━━━━━━━━━━━━━━━━━━━━━━━━━━
Why OBV Matters More Than Raw Volume
Raw volume bars tell you how much traded. They do not tell you which direction the volume was pushing. A high-volume bar during a selloff looks identical to a high-volume bar during a breakout rally.
On-Balance Volume assigns direction. When price closes up, the bar's volume is added. When price closes down, it is subtracted. The running total — OBV — reveals the persistent pressure beneath the surface. Rising OBV with flat price means accumulation. Falling OBV with rising price means distribution. These divergences are invisible on a standard volume histogram.
This indicator takes OBV further by normalizing it into a bounded oscillator, smoothing it for clarity, and applying Kalman filtering for adaptive trend detection.
━━━━━━━━━━━━━━━━━━━━━━━━━━━━━━
How It Works
The indicator processes OBV through four stages.
Stage 1 — Normalize to 0-100
Raw OBV is an unbounded cumulative number that grows indefinitely. This makes it difficult to compare across time periods or instruments. The indicator applies a rolling min-max normalization over a configurable lookback window (default 100 bars), mapping OBV into a 0-100 scale.
At 100, OBV is at its highest point within the lookback. At 0, its lowest. At 50, it sits at the midpoint of its recent range. This creates a bounded oscillator from a trending series.
Stage 2 — Stair-Step Candles
The normalized OBV is rendered as candles where each bar's open equals the previous bar's close. This creates seamless stair-step blocks with no gaps and no overlaps. The candles show the direction and magnitude of each bar's contribution to the flow — a tall green block means a strong volume push upward, a tall red block means aggressive selling pressure.
Stage 3 — Position-Based Color Gradient
Candle color is determined by where the candle sits in the 0-100 range, not merely whether it went up or down:
Bright green (above 70) — strong bullish accumulation zone
Yellow-green (50-70) — moderate bullish flow
Yellow (around 50) — neutral, transition zone
Orange (30-50) — weakening flow, bearish lean
Red (below 30) — strong bearish distribution zone
This gradient reveals the market's volume state at a glance. Candles clustered at the top in green signal sustained accumulation. Candles dropping through yellow into red signal a regime shift.
Stage 4 — Dual Kalman Ribbon
Two Kalman-filtered lines track the normalized OBV at different speeds:
Short KF (default 20) — responsive to recent flow shifts
Long KF (default 80) — tracks the underlying flow trend
When the short line is above the long line, the ribbon fills bullish. When below, bearish. The Kalman filter adapts its responsiveness automatically — smoothing through noise while responding quickly to genuine regime changes. This is fundamentally superior to any fixed-length moving average.
━━━━━━━━━━━━━━━━━━━━━━━━━━━━━━
Reading the Three Signals
Reversals
A reversal signal appears when candles have been clustered at one extreme (above 70 or below 30) and begin migrating toward the midline. The color gradient shifts — green fading to yellow, or red fading to orange. The Kalman ribbon begins to narrow as the short line approaches the long line. When the ribbon flips color, the reversal is confirmed by volume flow, not just price action.
Breakouts
A breakout appears as a large candle that punches through the 70 or 30 threshold line with expanding body size. The Kalman ribbon is already aligned in the breakout direction (short above long for bullish, below for bearish). This confirms that volume flow is supporting the price move — not just a wick or a fake breakout.
Re-Entries
After a breakout, price often pulls back. During a healthy pullback, the candles dip toward the midline (50) but the Kalman ribbon stays in the trend direction . Candles may turn yellow briefly but do not reach the opposite extreme. When candles resume their original color and move away from the midline, that is the re-entry — volume flow confirms the trend is intact.
━━━━━━━━━━━━━━━━━━━━━━━━━━━━━━
Why Kalman Filtering — Not EMA, SMA, or Hull
Traditional moving averages apply a fixed smoothing recipe regardless of market conditions. In a quiet market, they lag. In a volatile market, they whipsaw. The trader is forced to manually change the length setting as conditions change.
The Kalman filter solves this structurally. It maintains an internal estimate of both the value and its uncertainty . On every bar, it computes a gain that automatically balances between trusting the new data and trusting its prediction. When data is noisy, the gain drops and the filter smooths aggressively. When a genuine shift occurs, the gain rises and the filter responds immediately.
Two parameters control this behavior:
R (Measurement Noise) — how much noise is expected in each bar's data. Higher values produce smoother output.
Q (Process Noise) — how quickly the underlying trend is expected to change. Higher values allow faster adaptation.
The dual-line ribbon (short KF vs long KF) combines the adaptive smoothing with trend direction detection. The crossover of two Kalman-filtered lines is more reliable than traditional MA crossovers because the filter has already absorbed the noise before the crossover happens.
━━━━━━━━━━━━━━━━━━━━━━━━━━━━━━
Reading the Indicator
The Candles
Green blocks at top — strong sustained buying pressure. Trend is healthy.
Red blocks at bottom — strong sustained selling. Downtrend confirmed by volume.
Yellow/orange blocks at midline — indecision. Flow is balanced. Wait for direction.
Color transition — the gradient shift (green to yellow, or red to orange) often leads price by several bars.
The Kalman Ribbon
Green fill (short above long) — volume flow trend is bullish
Red fill (short below long) — volume flow trend is bearish
Ribbon narrowing — trend weakening, potential flip ahead
Ribbon widening — trend conviction increasing
The Threshold Lines
70 line — overbought in volume flow terms. Sustained presence above = strong trend, not necessarily a sell signal.
50 line — equilibrium. Transitions through this level signal regime changes.
30 line — oversold in volume flow terms. Sustained presence below = strong downtrend.
Line colors match the candle gradient — they shift with the regime.
━━━━━━━━━━━━━━━━━━━━━━━━━━━━━━
Key Settings
Normalization Lookback (default: 100)
Rolling window for min-max scaling. Higher values produce smoother oscillation with fewer extremes. Lower values make the indicator more reactive to recent volume changes.
HA Smoothing Passes (default: 1)
Number of additional smoothing passes on the normalized OBV. 1 = standard stair-step. 2-3 = smoother candles with less noise.
Short KF / Long KF Length (default: 20 / 80)
Controls the responsiveness of the two Kalman lines. The gap between them determines how quickly the ribbon detects trend changes.
Measurement Noise R (default: 0.01)
Higher = smoother Kalman output. Lower = more reactive to each bar.
Process Noise Q (default: 0.10)
Higher = faster adaptation to regime shifts. Lower = more rigid trend following.
Upper / Lower Threshold (default: 70 / 30)
Defines the overbought/oversold boundaries for the volume flow oscillator.
━━━━━━━━━━━━━━━━━━━━━━━━━━━━━━
Divergence — The Most Powerful Signal
When price makes a new high but the OBV candles fail to reach the upper zone (or are falling), volume is not confirming the move. This bearish divergence often precedes reversals by several bars. The Kalman ribbon will begin narrowing before the price chart shows any weakness.
Conversely, when price makes a new low but OBV candles hold above the lower zone or begin rising, that is bullish divergence — accumulation is happening beneath the surface.
The gradient coloring makes these divergences immediately visible. Price may look strong, but if the candles are orange instead of green, the volume story disagrees.
━━━━━━━━━━━━━━━━━━━━━━━━━━━━━━
What This Indicator Is Not
It does not generate automated buy or sell signals . It provides visual regime information for the trader to interpret.
It does not use footprint or order flow data . It is built on standard OBV which infers direction from price close. For actual bid/ask decomposition, a footprint-based indicator is required.
It does not predict future price direction . It reveals the current state and trend of volume flow. What the market does with that flow is never guaranteed.
It is not a standalone trading system . It is a confirmation and divergence detection tool designed to complement price action analysis.
━━━━━━━━━━━━━━━━━━━━━━━━━━━━━━
Disclaimer
This indicator is provided for educational and informational purposes only. It is not financial advice, and it does not constitute a recommendation to buy, sell, or hold any financial instrument.
All trading involves risk. Past performance of any signal, regime detection system, or volume analysis mechanism does not guarantee future results. The normalized OBV readings, Kalman-filtered trend lines, and color gradient zones represent a computational assessment of publicly available price and volume data. They are not predictions and should not be treated as certainties.
On-Balance Volume assigns all of a bar's volume to one direction based solely on whether the close was higher or lower than the previous close. This is an approximation. A bar that closes up by one tick with heavy selling throughout will register as entirely bullish volume in OBV. Traders should be aware of this limitation.
The Kalman filter parameters (R and Q) affect responsiveness. Poorly tuned parameters can produce either excessive lag or excessive noise. The default values are designed for general use but may require adjustment for specific instruments or timeframes.
No indicator, algorithm, or model can account for all market variables including liquidity events, news-driven gaps, exchange outages, or sudden regime changes. Traders should always use independent risk management, position sizing, and their own judgment before entering any trade.
By using this indicator, you acknowledge that you are solely responsible for your own trading decisions and that the authors accept no liability for any losses incurred.
Indicatore

Indicatore

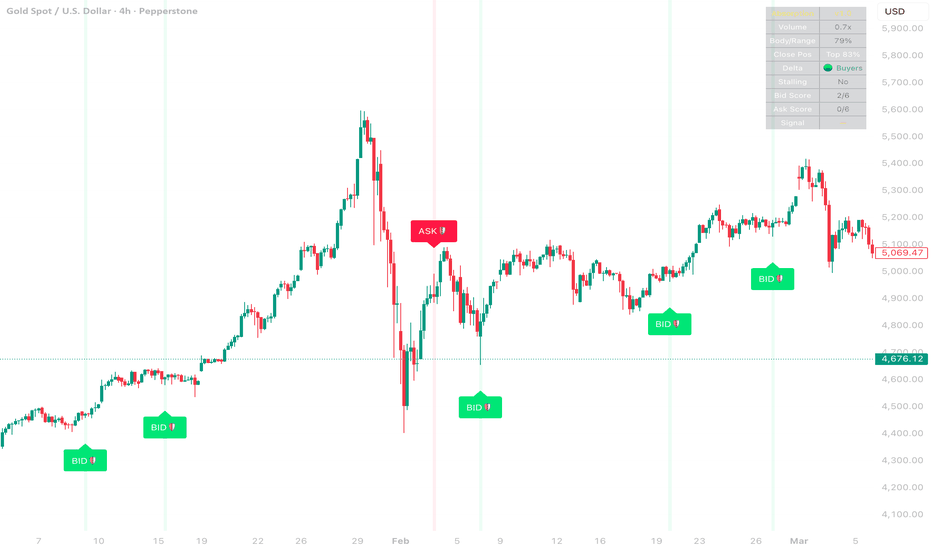
Absorption Detector 2.0Detects institutional absorption patterns where large orders defend key price levels. Approximates order flow concepts using standard OHLCV data — no Level 2 or DOM data required.
What is Absorption?
Absorption occurs when one side of the market (buyers or sellers) aggressively attacks a price level, but price refuses to move. This happens because a large institutional order is sitting at that level, absorbing all incoming market orders. It's one of the strongest signals of institutional defense.
Two Types of Absorption:
BID Absorption (Bullish) — Sellers are aggressively hitting bids, volume is high, but price won't drop. Buyers are absorbing all selling pressure, defending support. Look for long entries after confirmation.
ASK Absorption (Bearish) — Buyers are aggressively hitting asks, volume is high, but price won't rise. Sellers are absorbing all buying pressure, defending resistance. Look for short entries after confirmation.
Signal Strength:
BID / ASK (small) — Basic absorption detected. Score 1-3.
BID🛡️ / ASK🛡️ (medium) — Strong absorption. Score 4. Multiple conditions confirmed.
BID🛡️🛡️ / ASK🛡️🛡️ (large) — Extreme absorption. Score 5+. Highest conviction signal.
x2+ (triangle) — Multiple tests at the same price level. The more times a level is tested and holds, the stronger the defense.
Scoring System (0-6):
The indicator scores each bar across five dimensions: volume intensity relative to average, body-to-range ratio (tiny body = tug of war), price stalling with high volume over multiple bars, close position combined with delta direction, and reversal candle confirmation.
Info Panel:
Real-time display of volume ratio, body/range percentage, candle close position, approximate delta direction, stalling detection, bid/ask absorption scores, and current signal status.
How to Use:
When you see a BID signal at a support level, it suggests buyers are defending. Wait for the next candle to confirm the bounce before entering long. When you see an ASK signal at resistance, sellers are defending. Wait for confirmation before entering short. Signals with the shield emoji and x2+ multiple tests are highest conviction.
Features:
- Works on any instrument, any timeframe
- Approximates institutional absorption without Level 2 data
- Three signal strength levels with scoring system
- Multiple test detection at the same price level
- Real-time info panel with absorption metrics
- Bar coloring and background highlights
- Built-in alert conditions for all signal types
Note:
This indicator approximates absorption using volume and price action. For true absorption confirmation, cross-reference with a DOM or Bookmap if available. Best results on instruments with reliable volume data (futures, stocks). CFD users should lower the Volume Spike Multiplier in settings. Indicatore
Indicatore

Indicatore

Indicatore

Probability Live Table (Juan)The Probability Table Live is an advanced indicator for TradingView designed to display real-time probabilities of price movement for any currency pair and timeframe. This tool organizes the information into a clear and visual table, using intuitive colors to quickly interpret trend strength and the likelihood of continuation or retracement.
🔹 What the chart includes:
Mode → Indicates the current trend: UPTREND or DOWNTREND
Continuation Rate (Cont. Rate) → Probability that the trend will continue strong (30–95%)
Probability Retest → Probability that the price will safely retrace to the key zone (EMA50), adjusted for momentum and distance
Valid Lows / Valid Highs → Count of reliable recent swings (max. 100)
Breakout → Number of confirmed recent breakouts, filtered by strength and relevance
Streak → Streak of candles in the direction of the trend, shown as a %
BOS / CHOCH → Signals for Break of Structure and Change of Character, with dynamic probability
🌈 Dynamic colors: Green → strong and favorable conditions Yellow → medium conditions Red → weak or cautionary conditions Light Blue → recent swings and breakouts 💡 Advantages: Live bar-by-bar predictions. Real and dynamic probabilities for quick decision-making. Compatible with any pair and timeframe. Ideal for fund traders, swing traders, and day traders. With this chart, you can see at a glance the strength of the trend, the probability of continuation or retracement, and market structure signals, all in a single, easy-to-read visual panel. Indicatore

Indicatore
Indicatore

Scalper Pro 3 Min GoldDesigned specifically for low-timeframe scalping (ideal for 1m and 3m charts, especially on XAUUSD/Gold), the Scalper Pro 3 Min Gold is an advanced market structure breakout indicator that filters out market noise to catch explosive momentum.
Instead of giving a signal at every minor high/low cross, this script uses strict logic to ensure you only enter high-probability setups. It automatically calculates your risk and visualizes the exact Entry, Stop Loss, and Take Profit zones directly on your chart.
Key Features:
Smart Structure Breakouts: Uses internal Pivot High/Low calculations to identify true Market Structure Shifts (MSS). Stop losses are dynamically placed at the most recent logical swing low/high, not just the previous candle wick.
Consolidation Filter (Anti-Chop): The indicator analyzes the recent ATR. It requires the price to be in a tight accumulation/consolidation zone before a breakout occurs. This keeps you out of choppy, sideways markets and fakeouts.
Cooldown System: Prevents overtrading. After a valid signal is fired, the indicator enters a customizable "cooldown" period where it ignores erratic back-to-back signals.
Auto Risk:Reward Projection: Instantly draws professional Stop Loss (Red) and Target (Teal) boxes with clean labels based on your selected R:R multiplier (Default is 1:2).
How to Use:
Apply to a 1-minute or 3-minute chart (Highly optimized for Gold).
Wait for the indicator to draw the Entry/Target boxes.
The Stop Loss is automatically placed at the safest structural pivot. Execute your trade and let the price run to the projected Teal target zone.
Fully customizable inputs allow you to adjust the R:R ratio, consolidation strictness, and cooldown length to fit your personal scalping strategy. Indicatore

IB & OPR ASIA EU USTitle: Advanced Multi-Session Box: IB & OPR (Asia, London, New York)
Description: The Advanced Multi-Session Box: IB & OPR indicator is a versatile, streamlined tool designed specifically for Intraday Traders, Scalpers, and SMC/ICT practitioners. It visually maps out the Opening Price Range (OPR) and Initial Balance (IB) of the three major global trading sessions: Asia, Europe (London), and the US (New York).
Understanding the initial range of these key sessions is critical, as they commonly dictate liquidity pools, intraday support/resistance boundaries, and the directional bias for the rest of the trading day.
🌟 Key Features
✅ Three Core Sessions: Independently configure and toggle the Asia, Europe, and US sessions to match your trading schedule.
✅ Dynamic Timezones: Customize the specific start/end times and timezones (UTC offsets) for each session separately to align with your local broker.
✅ Projected Range Extensions: Optionally extend the session box (High/Low boundaries) forward throughout the current trading day to easily spot late-session breakouts, retests, or liquidity sweeps.
✅ Advanced Midline (50% Equilibrium): Displays a customizable median line inside each session box. The Equilibrium level acts as an excellent dynamic take-profit target or pivot zone.
✅ Smart History Management: Keep your chart perfectly clean! Choose to display only the sessions from "Today", "Two Days", the past "Week", or "All" history to prevent visual clutter.
✅ Deep Visual Customization: Every visual aspect is tweakable. Adjust the box opacity, fill color, border styles, text labels, label alignments, label sizes, and colors directly from the settings menu.
💡 How to Use
Initial Balance Breakouts: The high or low of an established Opening Price Range acts as a crucial line in the sand. A strong 15m or 1H candle close outside the box often signals a trend continuation, while a swift rejection back inside signals a mean-reversion setup.
Equilibrium Bounces: Price frequently respects the median line (50% of the session's range) during consolidations. Use it as a dynamic support or resistance validation point.
Liquidity Sweeps: Observe how the US session interacts with the established highs and lows of the Asian or European session. A quick sweep of the Asian high right at the London or NY open offers a classic "Judas Swing" trading setup.
Note: This indicator employs modern, highly optimized internal logic to manage TradingView's object limits effortlessly, ensuring zero lag on your charts while maintaining visual accuracy. Indicatore

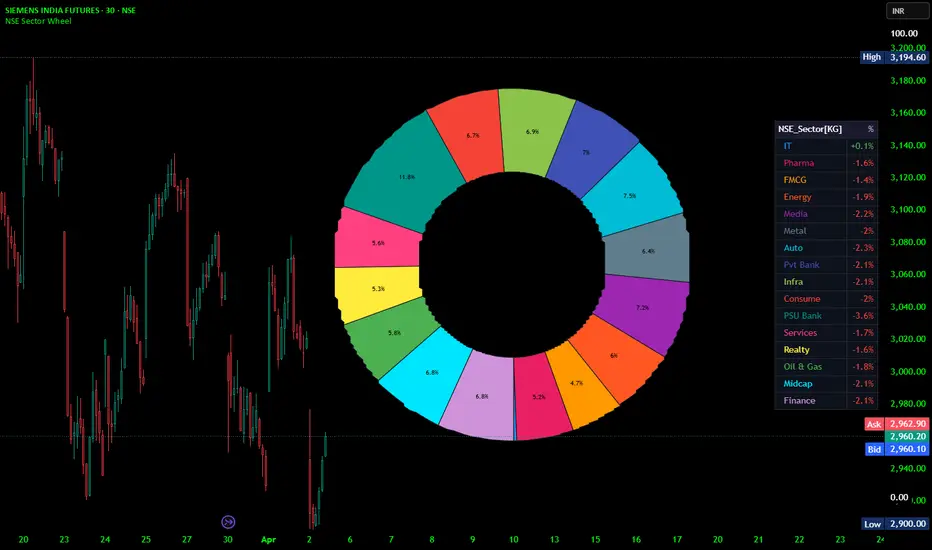
NSE Sector Wheel - DonutThis script generates a donut‑style wheel chart overlaid on a price chart. Its purpose is to visually compare the relative price movements of 16 major NSE (National Stock Exchange of India) sector indices. The size of each donut slice represents the absolute percentage change of that sector over a selected intraday timeframe (relative to the previous day’s close). A legend table next to the donut shows the sector names and the signed percentage change (green for positive, red for negative). The chart is static – it appears fixed on the screen, anchored to the last bar, and does not scroll with the price chart.
User Inputs:
The script provides two adjustable inputs:
Timeframe – The intra‑period used to fetch the current closing price for each sector (e.g., “3” for 3 minutes, “60” for 1 hour). The previous day’s close is always taken from the daily timeframe.
Horizontal Offset – A number of bars (default 60) that shifts the donut chart horizontally to the right from the last bar. This prevents the wheel from overlapping with price action.
Data Sources – NSE Sector Indices
The script tracks the following 16 sector indices (represented by their TradingView symbols):
IT (CNXIT)
Pharma (CNXPHARMA)
FMCG (CNXFMCG)
Energy (CNXENERGY)
Media (CNXMEDIA)
Metal (CNXMETAL)
Auto (CNXAUTO)
Private Bank (NIFTYPVTBANK)
Infrastructure (CNXINFRA)
Consumption (CNXCONSUMPTION)
PSU Bank (CNXPSUBANK)
Services (CNXSERVICE)
Realty (CNXREALTY)
Oil & Gas (NIFTY_OIL_AND_GAS)
Midcap (CNXMIDCAP)
Finance (CNXFINANCE)
Calculations:-
For every sector, the script performs two distinct calculations using the chosen intraday timeframe and the daily previous close:
Absolute percentage change – The absolute value of the percent difference between the current intraday close and the previous day’s close. This value determines the angular size (weight) of the slice in the donut chart. It is always non‑negative.
Signed percentage change – The actual percent difference (can be positive or negative). This is used only for display in the legend table, where positive changes appear in green with a “+” sign and negative changes in red.
The script sums all 16 absolute percentage changes to obtain a total movement value. Each sector’s slice angle is then computed as:
slice angle = (sector’s absolute change / total movement) × 360°
If the total movement is zero (no change in any sector), all slices receive an equal share of 22.5° (360° / 16).
Donut Chart Rendering
The donut chart is drawn only on the last bar of the chart (the most recent completed bar). On each new bar, the previous frame’s polylines and labels are deleted and redrawn from scratch.
Fixed Position:
The wheel is placed at a fixed chart coordinate that does not move when the user scrolls left or right:
Center X = last bar index + horizontal offset
Center Y = 50 (fixed vertical position, using the chart’s percentage scale from 0 to 100)
Inner radius = 20 units
Outer radius = 38 units
Because the Y‑axis is artificially fixed by two invisible plotted lines at 0 and 100, the donut remains at the same vertical position regardless of price levels.
Drawing the Slices>>>>>>>>>>
Each slice is drawn as a filled polygonal arc:
The script calculates the starting angle and ending angle for the slice based on the cumulative sum of previous slice angles.
It then generates a series of points along the outer radius (from start to end) and back along the inner radius (from end to start), forming a closed shape.
The slice is filled with a predefined, distinct colour (e.g., blue for IT, pink for Pharma, orange for FMCG, etc.).
A thin dark outline separates adjacent slices.
Percentage Labels Inside Slices>>>>>>>>>>
If a slice’s angular span is 14 degrees or larger, the script places a centered label inside the slice. The label shows the slice’s percentage of the total absolute movement (rounded to one decimal, e.g., “12.3%”). The label background is transparent, and the text is black. The position is calculated using the midpoint angle of the slice and the average of the inner and outer radii.
Legend Table>>>>>>>>>>>
To the right of the donut chart (positioned in the middle‑right of the chart window), the script draws a two‑column table with 17 rows (header + 16 sectors).
Column 1 – Sector name, colored with the same colour as the corresponding donut slice.
Column 2 – Signed percentage change, formatted to one decimal with a “+” sign for positive values. The text colour is green for gains and red for losses.
The table has a dark background, a subtle frame, and uses a normal font size. The header row displays “NSE_Sector ” and “%”.
Execution Flow >>>>>>>>>>>>
On every bar, the script fetches the previous day’s close for all 16 sectors (once per bar, from the daily timeframe).
It then fetches the current close for each sector using the user‑selected intraday timeframe.
It computes both absolute and signed percentage changes.It calculates the total absolute change and the angular span for each sector.
Only on the last bar:
It clears any previously drawn donut slices and labels.
It draws each slice as a filled arc, from the starting angle to the ending angle.
For slices wide enough, it adds a percentage label.
It builds or updates the legend table with the latest signed changes.
The donut chart remains visible at the same screen location until a new bar forms, at which point it is redrawn with updated data.
Practical Use:
Traders and investors can quickly see which NSE sectors are moving the most (in absolute terms) during the selected intraday period – the larger the slice, the greater the movement regardless of direction. The legend table then reveals whether that movement was positive or negative. This helps identify sector rotation, emerging strength or weakness, and relative volatility among Indian equity sectors.
Disclaimer:
This description is provided for educational and informational purposes only. The script described is a technical analysis tool for the Trading View platform. It does not constitute financial advice, trading recommendations, or investment guidance. Past performance and sector movements do not guarantee future results. Users should conduct their own research and consult with qualified financial advisors before making any trading decisions.
Indicatore

Indicatore

Indicatore
volatility 3.3The indicator is designed to identify high-probability trend reversals and breakouts by combining Price Action (EMA and ATR) with Market Volatility (India VIX). It dynamically adjusts its sensitivity based on how "nervous" the market is.
Key Components
1. Dynamic Support & Resistance (Adaptive Bands)
EMA 25: Acts as the baseline for the medium-term trend.
VIX-Adjusted ATR: Unlike standard bands, these expand or contract based on the VIX Ratio (VIX / VIX\_EMA).
If the VIX is high, the bands widen to avoid "noise."
If the VIX is low, the bands tighten to catch breakouts early.
2. VIX Filter (The Safety Switch)
VIX Spiking: If the VIX jumps suddenly (> 0.8\% above its average), the indicator blocks BUY signals. This prevents entering a trade during a "panic" move where prices often crash.
Short Confirmation: Sell signals are prioritized when VIX is higher than its average, indicating rising fear.
3. Signal Logic
BULLISH (BUY): Price closes above the Upper Band + VIX is stable (not spiking).
BEARISH (SELL): Price closes below the Lower Band + VIX is rising.
EXIT: The trend is neutralized (Sideways) if the price touches the EMA 25 line.
Visual Features
Dashboard: A real-time table showing the current trend, VIX status (High Vol vs. Stable), and your entry price.
Background Coloring: Green for Bullish zones, Red for Bearish zones, and Gray for Sideways/Neutral zones.
Asset Selection: Quickly toggle between Nifty, BankNifty, FinNifty, HDFC Bank, Reliance, and ICICI Bank. Indicatore

Indicatore
Indicatore

Indicatore

Indicatore

Indicatore

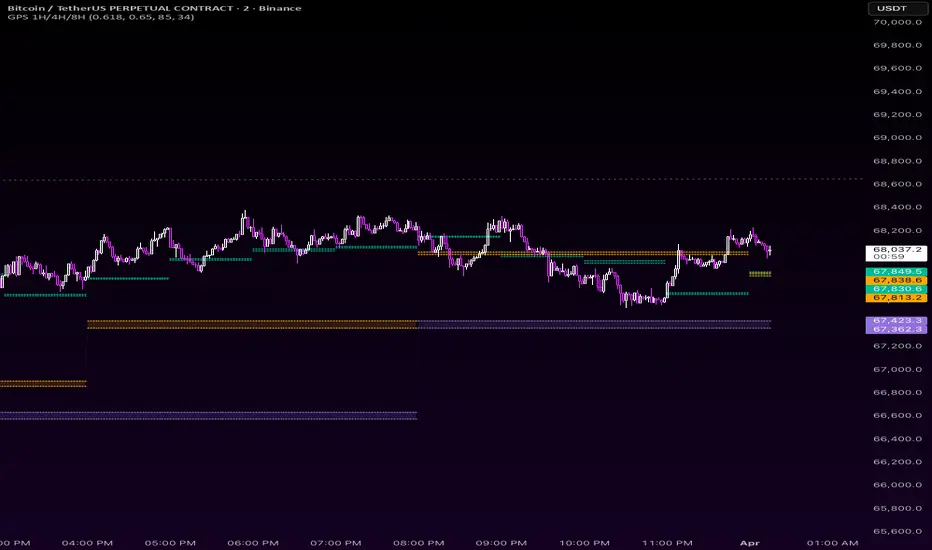
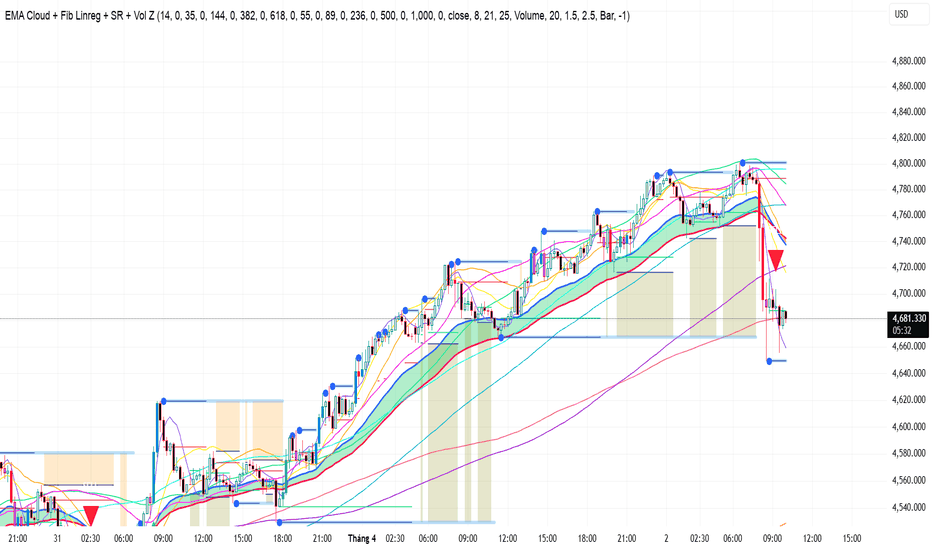
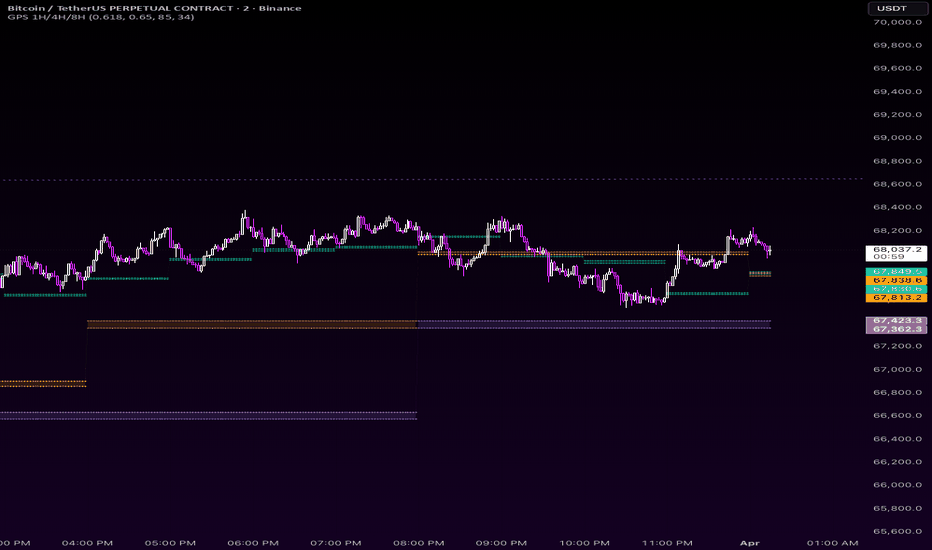
Golden Pocket Syndicate Mini (GPSM)This indicator is an overlay toolkit that combines multi-timeframe Golden Pocket-style zones (Fibonacci-derived ranges between user-defined high/low ratios), optional GP-anchored VWAPs that reset when price interacts with the matching zone, and a confluence framework with optional visuals (signals, divergences, order-block-style markers, sweeps, trails). It is intended to help traders see where higher-timeframe ranges and optional filters overlap on the chart—not to automate trading or promise outcomes.
What it does
Pulls prior completed higher-timeframe highs/lows via request.security() and derives upper/lower pocket levels from your fib inputs.
Plots pocket bands (and fills where used) for the timeframes you enable.
Optionally plots volume-weighted averages anchored to touches of the corresponding pocket.
Combines user-toggled filters into a confluence score and optional bull/bear markers; all signal logic can be turned off in settings.
How to use
Open settings, enable only the pocket timeframes and visuals you need. Adjust fib inputs, touch tolerance, and filter groups to match your process. If you use alerts, treat them as notifications only—confirm every trade in your own plan.
Important limitations
This is not financial, investment, or tax advice. Markets involve risk; past or hypothetical chart behavior does not guarantee future results.
Higher-timeframe data and request.security() behavior depend on symbol, session, and chart timeframe. Validate outputs on your instruments before relying on them.
Scripts cannot execute orders; you are responsible for compliance, sizing, and risk.
Companion
For separate 1H / 4H / 8H pocket bands (to reduce plot limits when combined with heavy scripts), use the author’s “Golden Pocket Syndicate mini” (GPSM) publication if offered.
Golden Pocket Syndicate mini (GPSM) — public description
Use this in the publication description field (English first).
GPSM is a lightweight companion overlay focused on 1-hour, 4-hour, and 8-hour Golden Pocket-style zones: two fib ratios applied to the prior completed bar’s range on each timeframe, with optional filled bands and optional GP-anchored VWAPs (off by default) that reset when price touches the matching pocket. The 1-hour band can optionally switch color using a simple prior closed 1H close vs EMA rule so you can see a regime-style split at a glance.
What it does
Uses request.security() on "60", "240", and "480" minute timeframes with the same prior-bar anchoring idea as the author’s main GPS Pro script.
Keeps the script small so it can run alongside heavier indicators without hitting Pine’s plot limits as quickly.
How to use
Add it to your chart, toggle 1H/4H/8H zones and fills, then optionally enable individual VWAPs. Match fib settings to your main workflow if you use GPS Pro on the same chart.
Important limitations
Not financial advice. No performance or profitability claims. Past chart behavior does not predict future prices.
HTF behavior varies by symbol and session (especially 8H). Confirm levels on your market.
You are solely responsible for trading decisions and risk.
Relationship to GPS Pro
GPSM does not duplicate the full confluence, SMC filters, or alerts stack from GPS Pro; it is meant as a focused HTF pocket + optional VWAP add-on. Indicatore
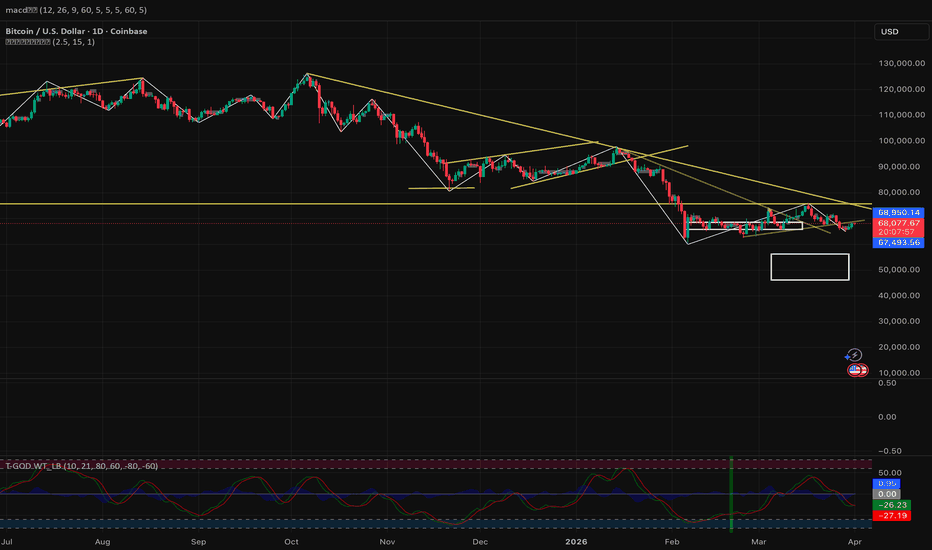
Simplified Pivot Zone & ZigZag IndicatorSimplified Pivot Zone & ZigZag Indicator (中樞簡易版 by OldGrumpyCat)
This indicator is a streamlined technical analysis tool that combines a dynamic adaptive pivot zone with an integrated ZigZag swing structure overlay. It is designed to help traders identify key areas of price equilibrium, significant swing highs and lows, and potential trend reversals — all within a single, lightweight script.
The pivot zone is constructed by computing a cumulative average deviation of price from a dynamically adjusted baseline. This produces an upper and lower band that forms a shaded central zone, visually highlighting regions where price has historically found support or resistance. The width of this zone scales with the user-defined Size parameter, making it adaptable to different instruments and timeframes.
The ZigZag component automatically connects significant swing highs and lows based on a configurable lookback depth (Depth) and deviation threshold. This makes it straightforward to read market structure, identify the prevailing trend direction, and map out wave sequences for further analysis. A Repaint toggle is provided: when enabled, the ZigZag updates dynamically on the current bar for real-time feedback; when disabled, lines are only drawn upon confirmed bar closes, eliminating repainting artifacts.
All visual elements — including the pivot zone fill color, line segment color, zone width, and line thickness — are fully customizable through the indicator's input panel, ensuring seamless integration with any chart theme or trading workflow. Indicatore
Indicatore