XauLabs Liquidity LevelsENGLISH
What it does
Most tools draw every swing high and low the same way. This one counts. A level touched four times without being broken is not the same object as a level touched once, and the script says so on the chart: line thickness and shading grow with the number of touches, and the count is written next to each zone. It also draws the diagonal along which lows keep rising — the sloping counterpart of a horizontal level — and marks the places where the two meet.
How it works (full method)
Confirmed pivots only. A swing is registered when it dominates a set number of bars on both sides (8 by default). The right-hand bars are what make the tool non-repainting: a level appears with that delay and never moves afterwards. The dashboard states the delay in plain sight.
Grouping into zones. Each new pivot is compared to existing levels. If it falls within a tolerance expressed in ATR (0.12 by default), it counts as the same zone and the counter increases. The zone is drawn as a band spanning the actual spread between its touches — equal highs and equal lows are rarely exactly equal, and the band shows the real width.
Weight by touches. Border, shading and the printed count all scale with the number of touches. Two touches is a pair of equal highs; four is a wall the market keeps returning to. By default only zones with at least two touches are displayed — single pivots are noise.
Sweeps are marked, not erased. When price wicks beyond a zone and closes back inside, the zone turns dotted grey and is labelled swept. It stays on the chart: what happened is part of the reading. Single-touch levels are never labelled swept — that is an ordinary break of structure, not a liquidity event.
Liquidity trendline. The script searches all pairs of confirmed pivots for the ascending line that the most lows have respected, with a tolerance of its own (0.5 ATR by default) because a diagonal spanning hours cannot hug prices to the cent. A low sitting above the line is not a violation — only a low clearly beneath it invalidates the line. Where several candidates tie, the oldest anchor wins, so the line starts at the origin of the move. The touch count is printed at its right end.
Confluence. When the projected diagonal reaches a horizontal zone, both are recoloured and marked. That intersection is where a horizontal cluster and a sloping one arrive together.
Recovery. If price closes below the diagonal, the script frames the area between the break and the current low, and names it: the diagonal and the equal lows have to be reworked.
Housekeeping. Zones further than a set distance from price, or older than a set number of bars, are removed. Beyond the display cap, the least-touched zones go first — an accumulation zone far from price outranks an isolated pivot nearby.
On what "liquidity" means here
The script measures touches, which is observable. The idea that stop orders accumulate behind repeatedly defended levels is an interpretation of that measurement, and a common one, but it is not something a chart can prove. The distinction matters: what you see counted is real, what it implies about resting orders is a reading.
No repainting
Pivots are confirmed by the right-hand bars and never revised. Zones extend forward as bars close; sweeps are evaluated on closed bars only. The diagonal is recomputed on the last bar because new pivots can extend it, which is stated here rather than hidden.
Settings
Pivot width, equality tolerance, minimum touches, maximum zones, distance and age filters, sweep marking and quota, diagonal tolerance, anchor depth, projection length, confluence and recovery marking, colours, dashboard and text size.
Educational structural tool. It gives no buy or sell signals and makes no performance claim. Trading involves substantial risk of loss.
FRANÇAIS
Ce que fait l'indicateur
La plupart des outils dessinent tous les sommets et creux de la même façon. Celui-ci compte. Un niveau touché quatre fois sans être franchi n'est pas le même objet qu'un niveau touché une fois, et le script le dit sur le graphique : l'épaisseur et l'intensité augmentent avec le nombre de touches, et le compte est écrit à côté de chaque zone. Il trace aussi la diagonale le long de laquelle les creux montent — l'équivalent en pente d'un niveau horizontal — et marque les endroits où les deux se rejoignent.
Comment il fonctionne (méthode complète)
Uniquement des pivots confirmés. Un pivot est enregistré quand il domine un nombre fixé de bougies de chaque côté (8 par défaut). Ce sont les bougies de droite qui rendent l'outil non-repainting : un niveau apparaît avec ce délai et ne bouge plus ensuite. Le tableau de bord affiche ce délai en clair.
Regroupement en zones. Chaque nouveau pivot est comparé aux niveaux existants. S'il tombe dans une tolérance exprimée en ATR (0,12 par défaut), c'est la même zone et le compteur augmente. La zone est tracée comme une bande couvrant l'écart réel entre ses touches — des equal highs ne sont presque jamais exactement égaux, et la bande montre la largeur véritable.
Le poids vient des touches. Bordure, intensité et compte affiché suivent le nombre de touches. Deux touches, c'est une paire d'equal highs ; quatre, c'est un mur où le marché revient sans cesse. Par défaut, seules les zones à deux touches minimum s'affichent — un pivot isolé est du bruit.
Les balayages sont marqués, pas effacés. Quand le prix dépasse une zone en mèche et clôture en deçà, elle passe en gris pointillé avec la mention « balayé ». Elle reste au graphique : ce qui s'est passé fait partie de la lecture. Un niveau à une seule touche n'est jamais marqué balayé — c'est une cassure de structure ordinaire, pas un événement de liquidité.
Diagonale de liquidité. Le script examine toutes les paires de pivots confirmés pour retenir la droite ascendante que le plus de creux ont respectée, avec une tolérance qui lui est propre (0,5 ATR par défaut) : une diagonale qui traverse plusieurs heures ne peut pas coller au centime. Un creux situé au-dessus de la droite n'est pas une violation — seul un creux nettement dessous l'invalide. À égalité, l'ancrage le plus ancien gagne : la droite part de l'origine du mouvement. Le nombre de touches est écrit à son extrémité.
Confluence. Quand la diagonale projetée rejoint une zone horizontale, les deux sont recolorées et signalées. C'est l'endroit où un amas horizontal et un amas en pente arrivent ensemble.
Récupération. Si le prix clôture sous la diagonale, le script encadre la zone entre la cassure et le plus bas atteint depuis, et la nomme : la diagonale et les equal lows sont à retravailler.
Entretien. Les zones trop éloignées du prix ou trop anciennes disparaissent. Au-delà du plafond d'affichage, ce sont les moins touchées qui partent en premier — une zone d'accumulation lointaine vaut mieux qu'un pivot isolé tout proche.
Sur le mot « liquidité »
Le script mesure des touches, ce qui est observable. L'idée que des ordres stop s'accumulent derrière les niveaux défendus plusieurs fois est une interprétation de cette mesure, très répandue, mais qu'un graphique ne peut pas démontrer. La distinction compte : ce que vous voyez compté est réel, ce que cela suppose des ordres en attente est une lecture.
Aucun repaint
Les pivots sont confirmés par les bougies de droite et ne sont jamais révisés. Les zones s'étendent vers l'avant à mesure que les bougies clôturent ; les balayages sont évalués sur bougies closes uniquement. La diagonale est recalculée sur la dernière bougie parce que de nouveaux pivots peuvent la prolonger — c'est écrit ici plutôt que caché.
Réglages
Largeur de pivot, tolérance d'égalité, touches minimum, zones maximum, filtres de distance et d'âge, marquage et quota de balayages, tolérance de la diagonale, profondeur d'ancrage, longueur de projection, marquage des confluences et des récupérations, couleurs, tableau de bord et taille du texte.
Outil structurel à but éducatif. Il ne donne aucun signal d'achat ou de vente et ne formule aucune promesse de performance. Le trading comporte un risque de perte important. Indicatore

Reversal Pattern Auto Targets [JPT]
🔷 OVERVIEW
R eversal Pattern Auto Targets is an educational price action indicator that automatically detects potential Double Top, Double Bottom, Head & Shoulders, and Inverse Head & Shoulders reversal structures using confirmed swing points. When a valid reversal setup is confirmed, the indicator displays a complete trade framework including Entry, Stop Loss, TP1, TP2, and TP3 levels.
The indicator is designed to help traders visualize reversal structures and practice structured trade planning. It does not predict future price movement or guarantee profitable trades.
🔷 FEATURES
Automatic reversal pattern detection
Double Top & Double Bottom patterns
Head & Shoulders & Inverse Head & Shoulders
Bullish and bearish reversal signals
Entry, Stop Loss, TP1, TP2, and TP3 levels
ATR-based Stop Loss buffer
Risk/Reward-based target calculations
Optional EMA 50 & EMA 200 trend filter
Confirmed pivot-based structure
Optional pivot structure visualization
Extendable Entry, SL, and TP levels
Optional pattern labels
Alert conditions for reversal signals and TP1
Clean chart layout with minimal clutter
🔷 HOW IT WORKS
Detects confirmed swing highs and swing lows.
Compares confirmed pivot points to identify potential reversal structures.
Confirms Double Top and Double Bottom setups through neckline breaks.
Identifies potential Head & Shoulders and Inverse Head & Shoulders structures.
Applies the optional EMA trend filter when enabled.
Generates a bullish or bearish reversal signal after confirmation.
Calculates Entry, Stop Loss, and multiple Take Profit levels automatically.
Displays the trade framework directly on the chart.
🔷 HOW TO USE
Look for newly detected REV BUY or REV SELL signals.
Identify the displayed reversal pattern and review its structure.
Check the overall market trend before considering a setup.
Use the Entry, SL, TP1, TP2, and TP3 levels as a trade-planning reference.
Consider using the optional EMA 50/200 filter for additional trend context.
Combine the indicator with your own price-action confirmation and risk-management rules.
🔷 NOTES
Signals are based on confirmed pivot and price-action structures.
The indicator uses confirmed pivots and does not use lookahead logic.
Historical signals do not guarantee future performance.
Entry, SL, and TP levels are analytical references and should not be treated as guaranteed trade levels.
Market conditions can change quickly, so proper risk management is essential.
This indicator is intended for educational and analytical purposes only.
No indicator can guarantee successful trades, and this script should not be used as the sole basis for investment or trading decisions. Indicatore

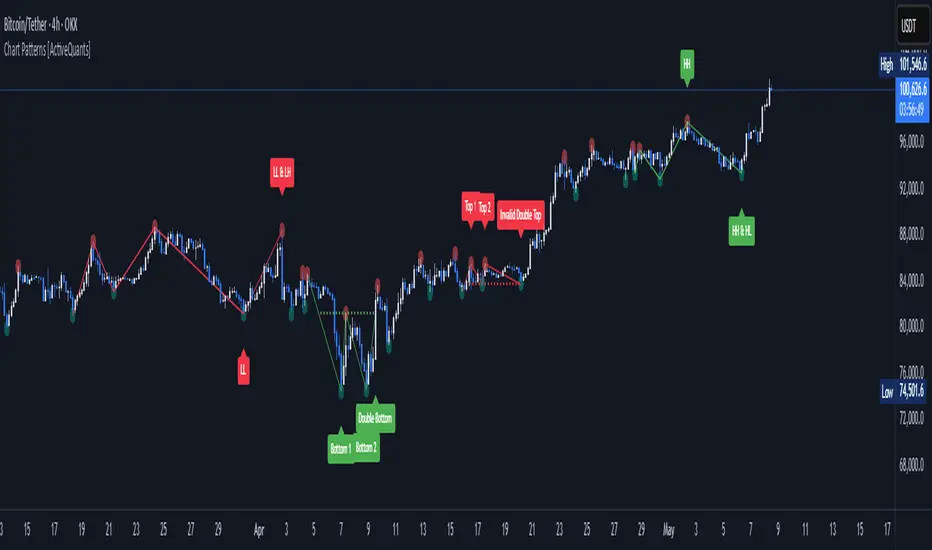
Double Tap Double Top/Bottom [Viprasol]Double Tap — Double Top / Double Bottom
═══════════════════════════════════════════════════════════
WHAT IT DOES
═══════════════════════════════════════════════════════════
Double Tap finds the two most reliable reversal patterns in classic technical analysis —
the Double Top (M) and Double Bottom (W) — draws them as they FORM, and on a confirmed
neckline break projects a complete trade map: Entry, Stop, and measured-move Target, then
tracks the outcome to ✓ or ✗. It keeps a history of recent patterns on the chart, not
just the latest one, so you can see how the tool reads structure over time.
═══════════════════════════════════════════════════════════
HOW THE PATTERN IS DETECTED
═══════════════════════════════════════════════════════════
1. Two confirmed swing highs (Double Top) or lows (Double Bottom) are found via a pivot
length you control.
2. The two extremes must match within a tolerance — a percentage of the pattern's height —
so the "double" is genuinely level, not a random pair of swings.
3. A valley (top) or peak (bottom) between them becomes the NECKLINE.
4. The pattern must span between your min and max width (bars) to filter noise.
5. While these conditions hold, the pattern is shown FORMING (a dotted preview). If price
breaks back past the twin extreme first, the setup is invalidated and the preview clears.
6. TRIGGER: a confirmed bar close through the neckline solidifies the pattern and prints
the trade levels.
Non-repainting: swings are confirmed pivots and the trigger evaluates on closed bars.
═══════════════════════════════════════════════════════════
THE TRADE MAP (drawn on every confirmed pattern)
═══════════════════════════════════════════════════════════
• ENTRY — the neckline-break close.
• STOP — beyond the higher top / lower bottom, padded by an ATR buffer.
• TARGET — the measured move: pattern height projected from the neckline (adjustable %).
On the chart: two peak markers with prices, a shaded pattern box, a dashed neckline, an
Entry line, and green/red TP/SL zones — all extending forward until price resolves them.
The pattern label then flips to ✓ (target hit) or ✗ (stop hit).
═══════════════════════════════════════════════════════════
FEATURES
═══════════════════════════════════════════════════════════
• Live "forming" preview so you see a pattern building before it triggers.
• Tracks multiple patterns across history (configurable how many to keep).
• Detect tops, bottoms, or both; full control of tolerance, pivot length, min/max width.
• Measured-move target (% of height) + ATR stop buffer.
• Dashboard: current status, active Entry / Target / Stop with % distance, and a running
hit rate (how often target was reached before stop, on the patterns shown).
• Alerts on Double Top / Double Bottom confirmation, plus a webhook-ready alert() message
(Text or JSON) carrying entry / stop / target.
═══════════════════════════════════════════════════════════
HOW TO USE
═══════════════════════════════════════════════════════════
1. Set Swing Length to the pattern size you want (larger = bigger, cleaner patterns).
2. Watch the dotted "forming" preview; act only on the confirmed neckline break.
3. Use the drawn Entry / Stop / Target as your plan; scale or exit at the target.
4. Tune Tolerance (how level the two extremes must be) to your market's character.
5. Set an alert on "Any alert() function call" for automation, or use the built-in
Double Top / Double Bottom conditions.
═══════════════════════════════════════════════════════════
HONEST LIMITATIONS
═══════════════════════════════════════════════════════════
• Pattern recognition is inherently subjective; this uses one consistent rule-based
definition — it won't catch every double a human would draw, and vice versa.
• The dashboard's hit rate is a simple tally of the patterns currently shown (target-before-
stop), not a full backtest — use it as a feel, not a performance guarantee.
• Swings confirm after the fact (pivot lookback), so patterns appear with a natural lag.
• This is a decision-support tool, not financial advice. Manage your own risk.
═══════════════════════════════════════════════════════════
CREDITS & ORIGINALITY
═══════════════════════════════════════════════════════════
The double top / double bottom is public, classic technical analysis; ATR is J. Welles
Wilder's public concept. Every line of Pine here — the pivot-pairing detection, the
tolerance/neckline/measured-move logic, the forming preview, the multi-pattern tracker,
and all visualization — is original Viprasol work written from scratch. No third-party
Pine code is reused.
Indicatore

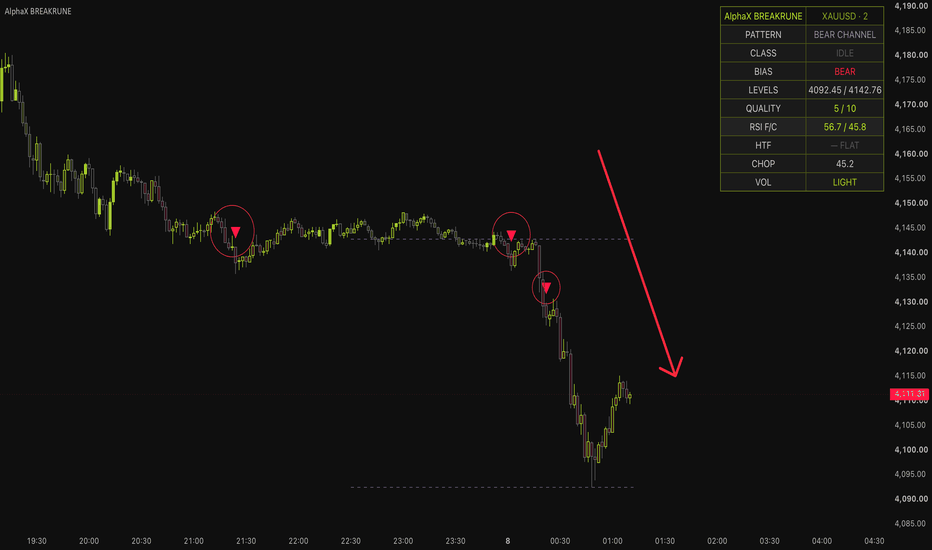
[ A L P H A X ] BREAKRUNE - Pattern Breakout RSI EngineAlphaX BREAKRUNE — Pattern Breakout Intelligence + RSI Trigger Engine: Real vs Fake Breakout Classification, Five-Pattern Detection, Fakeout Reversal Signals & Pending State Machine
AlphaX BREAKRUNE is a professional-grade breakout intelligence system built around a single foundational problem that defeats most breakout traders: the inability to distinguish a genuine structural breakout from a fakeout in real time. Most breakout indicators fire on any close beyond a pattern boundary — and then leave the trader holding a loss when price immediately reverses back inside the structure. BREAKRUNE solves this at the architectural level by separating breakout detection into three sequential phases — pattern recognition, breakout classification, and RSI trigger confirmation — and requiring all three to align before a signal fires. Every raw break is first classified as PENDING, then evaluated over a configurable decision window for either TRUE BREAK or FAKEOUT status using candle body and wick geometry, and only confirmed true breaks with RSI momentum alignment produce long or short entry signals. Fakeouts become their own opportunity: when a breakout is classified as fake, BREAKRUNE reverses the bias and watches for an RSI-confirmed trap reversal signal in the opposite direction. The result is a system that profits not just from real breakouts but also from the very fakeouts that trap the crowd — with the RSI trigger layer ensuring every entry has genuine momentum behind it. Designed for traders across crypto, forex, gold, and indices on any timeframe.
━━━━━━━━━━━━━━━━━━━━━━━━━━━━━━━━━━━━━━━━
🔮 The Core Philosophy — Three Phases Before a Signal
The fundamental failure of conventional breakout systems is compression of the detection and confirmation steps into a single bar event. Price closes above resistance — signal fires. This approach has no mechanism for distinguishing momentum breakouts from stop-hunt spikes, thin-market wicks, or false structural breaks that reverse immediately.
BREAKRUNE separates these into three distinct sequential phases that every potential signal must pass through:
Phase 1 — Pattern Recognition:
The system continuously scans the pivot structure to identify one of five major pattern types — Range, Double Top/Bottom, Triangle, Wedge, or Trend Channel. The detected pattern provides the structural context for the breakout evaluation: where the resistance and support levels are, what the directional bias of the formation is, and whether the pattern height meets the minimum size requirement for a qualified break.
Phase 2 — Breakout Classification:
When a raw break of the pattern boundary occurs, the system enters PENDING state. Over the next configurable bars (the fakeout decision window), it watches for one of two outcomes. If candles close back inside the structure with a significant rejection wick, the break is reclassified as FAKEOUT. If the required number of candles all close beyond the boundary without a wick rejection, the break is classified as TRUE BREAK. No premature signal fires during this window — the system waits for the evidence.
Phase 3 — RSI Trigger Confirmation:
Only after a TRUE BREAK or FAKEOUT classification does the RSI trigger layer evaluate. For true breaks, the Fast RSI must be above the configured long trigger (default: 55) with Core RSI above 50 and both RSI slopes positive. For fakeout reversals, the Fast RSI must cross the midline in the reversal direction with positive directional slope. Both must pass the quality score gate. Only then does a signal fire.
This three-phase architecture is what makes BREAKRUNE categorically different from breakout indicators that react to a single bar event.
━━━━━━━━━━━━━━━━━━━━━━━━━━━━━━━━━━━━━━━━
📐 Five-Pattern Detection Engine
BREAKRUNE continuously classifies the current market structure into one of five pattern types using the most recent confirmed pivot highs and lows. Every pattern provides resistance (res) and support (sup) levels used as the breakout boundaries.
Pattern detection uses:
Confirmed fractal pivot highs and lows (configurable pivot length, default: 5 bars each side), ATR-normalized tolerance values for determining flat vs sloped levels, and a minimum pattern height filter to eliminate micro-structures.
━━━━━━━━━━━━━━━━━━━━━━━━━━━━━━━━━━━━━━━━
Range:
Both the most recent pivot high and pivot low are within the flat level tolerance (default: 0.35× ATR) of their respective prior pivots — price has been oscillating between approximately horizontal support and resistance. The pattern bias is neutral (patBias = 0) — a range can break either direction. The resistance is the average of the two pivot highs; support is the average of the two pivot lows.
Double Top / Double Bottom:
Two pivot highs at approximately the same level (within flat tolerance) with the current price below both peaks — Double Top, bearish bias. Or two pivot lows at the same level with current price above — Double Bottom, bullish bias. The pattern height is the distance from the support/resistance level to the opposing pivot extreme. The directional bias (patBias) is set accordingly — bearish for Double Top, bullish for Double Bottom.
Triangle (Converging):
The pivot highs are trending lower (by more than the trend shift tolerance, default: 0.20× ATR, between consecutive highs) while the pivot lows are trending higher — a symmetrical converging triangle. No directional bias is set (patBias = 0) since triangles resolve in either direction. The resistance is the most recent pivot high; support is the most recent pivot low.
Wedge:
Both pivot highs and pivot lows are trending in the same direction. Rising Wedge: both highs and lows trending upward — despite the upward direction the narrowing structure is bearish (patBias = -1). Falling Wedge: both trending downward — bullish (patBias = 1). The wedge pattern is identified when the pivot-to-pivot shift exceeds the trend tolerance on both sides in the same direction.
Trend Channel:
Pivot highs are trending in one direction and pivot lows are trending in the same direction, but the high trend direction opposes the expected wedge classification — a parallel channel. The channel bias follows the direction of the trend (upward-sloping channel = bullish patBias, downward = bearish).
Pattern freshness filter:
All pivot-based pattern detections are subject to a maximum age constraint (default: 80 bars from the most recent contributing pivot). Patterns older than this threshold are excluded from pattern detection — the oldest pivot must be within the freshness window for the pattern to be considered current and relevant.
Pattern size validation:
The pattern height (distance from support to resistance) must meet or exceed the minimum pattern height in ATR multiples (default: 1.1× ATR). This sizeOk condition contributes 2 points to the quality score — the largest single weight component — and reflects that properly sized patterns have more institutional significance than micro-structures.
━━━━━━━━━━━━━━━━━━━━━━━━━━━━━━━━━━━━━━━━
⚡ The Breakout Classifier — PENDING → TRUE BREAK or FAKEOUT
When price closes beyond a pattern boundary by more than the break threshold (default: 0.12× ATR), a raw break event is registered and the breakout classifier enters PENDING state. From this moment, every bar within the fakeout decision window (default: 5 bars) is evaluated.
Raw break detection:
Long raw break: Close above the resistance level plus break threshold, with the pattern allowing long breaks (not a bearish pattern — Double Top and Rising Wedge suppress long breaks)
Short raw break: Close below the support level minus break threshold, with the pattern allowing short breaks
PENDING state variables stored at the break bar:
The direction (pendingDir), the exact level broken (pendingLvl), the bar index of the break (pendingBar), and the pattern name (pendingPat) are all stored in persistent variables. The PENDING state is displayed on the dashboard CLASS row as PENDING — visible awareness that a break has occurred and is being evaluated.
FAKEOUT classification:
Within the fakeout window (pendingAge ≤ fakeWindow), if price closes back inside the pattern:
For a long break fakeout: close falls back below the broken resistance level AND the upper wick of the current bar exceeds the configurable minimum wick rejection ratio (default: 45% of bar range) — the bar closed back inside with a dominant upper wick, confirming selling rejection of the attempted breakout
For a short break fakeout: close rises back above the broken support AND the lower wick exceeds the minimum ratio
When these conditions are met, pendingFake is set to true and the CLASS row displays FAKEOUT — the orange classification that activates the trap reversal signal pathway.
TRUE BREAK classification:
When the configurable number of consecutive candles (default: 2 bars) all close beyond the broken level — `ta.lowest(close, confirmBars) > pendingLvl` for longs, `ta.highest(close, confirmBars) < pendingLvl` for shorts — without any fakeout having been detected, pendingTrue is set to true and CLASS displays TRUE BREAK. The confirmed candles all remaining beyond the level eliminates the single-bar false breakout.
Window expiry:
If neither FAKEOUT nor TRUE BREAK is classified within the fakeout window, the pending state expires silently — pendingDir resets to zero, the level clears, and the system resumes scanning. This prevents stale pending states from generating signals long after the relevant price action has passed.
━━━━━━━━━━━━━━━━━━━━━━━━━━━━━━━━━━━━━━━━
📊 The RSI Trigger Layer — Momentum Gating on Classified Breaks
The RSI trigger layer is the final gate before a signal fires. It ensures every entry — whether on a true break or a fakeout reversal — has genuine momentum direction behind it at the moment of entry.
Dual RSI architecture:
Fast RSI (default: 7 periods) — the timing layer. Reacts quickly to price movement and provides the momentum trigger reading
Core RSI (default: 14 periods) — the confirmation layer. The intermediate momentum context that must agree with the fast RSI direction
RSI slope measurement:
Both RSI slopes are computed over the configurable slope bars (default: 3 bars) — the current RSI value minus the value N bars ago. A positive slope means RSI is accelerating; a negative slope means decelerating.
True Break Long RSI conditions (rsiLongOk):
Fast RSI above the long trigger threshold (default: 55) — momentum has already crossed into bullish territory
Core RSI above 50 — the intermediate RSI confirms the bullish bias
Fast RSI slope positive — momentum is still accelerating upward
Core RSI slope non-negative — intermediate momentum is not rolling over
True Break Short RSI conditions (rsiShortOk):
Fast RSI below the short trigger threshold (default: 45)
Core RSI below 50
Fast RSI slope negative
Core RSI slope non-positive
Fakeout Reversal RSI conditions:
Trap Long (rsiTrapLong): Fast RSI crosses above 50 (ta.crossover) with a positive slope — the RSI midline crossover after the fakeout confirms the reversal is gaining momentum
Trap Short (rsiTrapShort): Fast RSI crosses below 50 with a negative slope
Why the RSI trigger is a layer, not a gate: The RSI conditions are required for the signal to fire but are also the primary quality score component (2 points when fully met). This dual role means the RSI is simultaneously a hard entry requirement and a quality contributor — signals that barely pass the RSI threshold score lower than signals where momentum is strongly confirmed.
━━━━━━━━━━━━━━━━━━━━━━━━━━━━━━━━━━━━━━━━
🔀 The Fakeout Reversal — Trapping the Trap
The fakeout reversal is BREAKRUNE's most distinctive and high-reward signal type. When a long breakout is classified as FAKEOUT (price returned below resistance with a rejection wick), the crowd that bought the breakout is now trapped — holding longs above what has become confirmed resistance again. The RSI trap reversal watches for the Fast RSI to cross below 50 with negative slope: the momentum of the trapped buyers failing. When this occurs within the cooldown window, a short signal fires — entering precisely as the trapped longs begin capitulating.
Why fakeout reversals often produce the strongest moves: A failed breakout above resistance concentrates stop losses of all the breakout buyers just above the resistance level. As those stops are triggered on the reversal, they add selling pressure to the downside move — creating a self-reinforcing cascade. The fakeout reversal entry captures this cascade from near the top.
Enabling/disabling: The Enable Fakeout Reversal Signals setting (default: on) controls whether trap reversal signals are active. Disabling it restricts BREAKRUNE to true break signals only — appropriate for traders who prefer pure momentum continuation entries.
Visual differentiation: True break signals are rendered in the standard bull/bear score-based colors (yellow-green for longs, red for shorts). Fakeout reversal signals fire through the same triangle shapes but with the quality score reflecting the trap penalty — trap signals score 1 point on the setup component vs 2 for true breaks, naturally producing slightly lower overall scores that are reflected in the triangle's brightness.
━━━━━━━━━━━━━━━━━━━━━━━━━━━━━━━━━━━━━━━━
🏅 The 10-Point Quality Score
Every signal — true break or fakeout reversal — is scored through a 10-point composite system before it can fire. Signals below the minimum threshold (default: 5) are suppressed regardless of classification.
Score components:
Pattern Size (up to 2 points):
sizeOk (pattern height ≥ minimum ATR threshold) scores 2 points. A zero-score here (pattern too small) alone can suppress a signal by 2 points — the largest single deduction possible. Well-sized patterns carry proportionally more institutional significance and this component enforces that.
RSI Trigger Alignment (up to 2 points):
rsiLongOk (for long signals) or rsiShortOk (for short signals) scores 2 points. This is the second largest component — reflecting that genuine momentum confirmation at the moment of entry is as important as pattern quality. Signals where RSI barely meets the threshold (Fast RSI just above 55 with flat slope) score these 2 points; signals where RSI is not aligned at all score 0.
Signal Type (1–2 points):
True break signals score 2 points; fakeout reversal (trap) signals score 1 point. This weighting reflects the inherently lower confirmation of a reversal trade versus a confirmed structural continuation — the trap trade is valid but carries more uncertainty.
Volume Confirmation (1 point):
Current bar volume meets or exceeds the volume average × multiplier (default: 1.1×). When volume confirmation is disabled in settings, this point is always awarded.
Non-Chop Market (1 point):
Choppiness Index is below the configured threshold (default: 62.0). Also enforced as a hard gate — extreme chop blocks all signals regardless of score.
HTF Bias (up to 2 points):
When useHtf is on and the higher timeframe EMA structure agrees with the signal direction (htfBull for longs, htfBear for shorts), 2 points are awarded. When HTF is disabled, 1 neutral point is always given. When HTF opposes the signal and useHtf is on, 0 points. This component has the same maximum weight as RSI and pattern size — reflecting the institutional significance of macro directional alignment.
Grade-coded signal colors:
Score 8–10 → full brightness (colBull / colBear). Score 6–7 → slightly dimmer. Score below 6 → transparent-tinted version. The triangle color communicates quality at a glance without reading the dashboard.
━━━━━━━━━━━━━━━━━━━━━━━━━━━━━━━━━━━━━━━━
📊 Live Dashboard
The 10-row real-time dashboard displays the complete internal state of the breakout classifier and all filter conditions.
PATTERN — the current detected pattern: Range, Dbl Top, Dbl Bot, Triangle, Rising Wedge, Falling Wedge, Up Channel, Down Channel. Purple color. Updates on every bar as the pivot structure evolves
CLASS — the current breakout classification state: IDLE (no pending break), PENDING (raw break registered, evaluating), TRUE BREAK (confirmed continuation), FAKEOUT (rejection detected, reversal watching). Color-coded — yellow-green for TRUE BREAK, orange for FAKEOUT, neutral for IDLE/PENDING
BIAS — the directional bias: BULL (pendingDir=1 or patBias=1), BEAR (pendingDir=-1 or patBias=-1), or NEUTRAL. Yellow-green or red
LEVELS — the current support and resistance levels as a price pair (e.g., "2450.50 / 2490.25"). The exact boundaries the breakout classifier is watching
QUALITY — the live quality score out of 10. Yellow-green when at or above the minimum threshold, neutral otherwise
RSI F/C — the live Fast RSI and Core RSI values as a pair (e.g., "58.4 / 53.7"). Yellow-green when above 50, red when below
HTF — higher timeframe EMA structure: ▲ BULL, ▼ BEAR, or — FLAT
CHOP — live Choppiness Index value. Orange when above the block threshold
VOL — CONFIRMED (volume above threshold) or LIGHT (below threshold). Yellow-green or orange
━━━━━━━━━━━━━━━━━━━━━━━━━━━━━━━━━━━━━━━━
📈 Chart Visual System
Pattern Boundary Lines — when Show Pattern Boundary Lines is enabled, a resistance line (res, red-tinted) and support line (sup, yellow-green-tinted) are drawn from the pattern's origin bar to the current bar, showing the exact levels the breakout classifier is watching
▲ Triangle (below bar) — long signal. Full brightness yellow-green for score 8+, standard for 6–7, transparent-tinted for minimum score. Fires on both TRUE BREAK longs and FAKEOUT reversal longs (trap shorts become long entries)
▼ Triangle (above bar) — short signal with matching grade-coded coloring
✕ Cross (above bar, orange) — fakeout mark for a failed long breakout. Appears when Show Fakeout Marks is enabled and fakeLongNow fires. The orange × above the bar is the visual alert that a bull breakout has been rejected
✕ Cross (below bar, orange) — fakeout mark for a failed short breakout
Candle tinting — when Show Tint Candles by Active Bias is enabled, bars are tinted yellow-green (bias=1) or red (bias=-1) during active pending or pattern-biased periods. The tint shows the directional context continuously, not just at signal bars
SL Line (red dashed) — when Show SL + TP1 + TP2 is on, the ATR-based stop loss level extending guideExtend bars forward
TP1 Line (lime dotted) — first take profit at 1.8× ATR from entry
TP2 Line (bright yellow-green dashed, width 2) — second take profit at 3.0× ATR from entry
━━━━━━━━━━━━━━━━━━━━━━━━━━━━━━━━━━━━━━━━
🚀 How to Trade with AlphaX BREAKRUNE — Step by Step
Step 1 — Read the Pattern and Levels
Check the PATTERN row on the dashboard — what structure is the system currently detecting? A Triangle or Wedge has directional bias; a Range or Double Top/Bottom has a directional expectation. Understanding the pattern context helps you assess which breakout direction is more probable
Check the LEVELS row — note the exact support and resistance prices. These are the lines the classifier is watching. If price is approaching resistance, a long break event may be imminent
Check BIAS — if it already shows BULL or BEAR from the pattern's directional classification, the system has a pre-existing directional lean before any break occurs
Step 2 — Monitor the Breakout Classification
When CLASS changes from IDLE to PENDING, a raw break has occurred. Watch the dashboard closely over the next fakeWindow bars — CLASS will shift to either TRUE BREAK or FAKEOUT
If CLASS shows FAKEOUT with an orange × appearing on the chart, the fakeout reversal pathway has activated. Check RSI F/C — is the Fast RSI approaching or crossing the 50 midline in the reversal direction?
If CLASS shows TRUE BREAK, check RSI F/C — is Fast RSI above 55 (long) or below 45 (short) with Core RSI confirming and slopes positive? If yes, a signal is likely imminent or has just fired
Step 3 — Enter on the Triangle Signal
A ▲ or ▼ triangle confirms all three phases have aligned — pattern identified, break classified, RSI triggered, quality scored
Read the triangle color — bright full-color triangle is Grade A (score 8+). This is the premium entry with all components confirming. Faded triangles are Grade C — valid but with reduced size
The QUALITY row shows the exact score. For fakeout reversal signals, the score will typically be 1 point lower than an equivalent true break signal due to the trap signal type weighting
Enable Show SL + TP1 + TP2 to see the ATR guide levels projecting forward from the signal bar
Step 4 — Manage the Trade
Watch the CLASS row during the trade. A new PENDING state in the opposing direction during an open position is an early warning that a counter-breakout is developing
Monitor RSI F/C — if Fast RSI begins rolling toward 50 against the trade direction, intermediate momentum is weakening. Consider taking TP1
The candle tint changing from yellow-green to red (or vice versa) during a trade means the bias has reversed — this is a structural exit cue
━━━━━━━━━━━━━━━━━━━━━━━━━━━━━━━━━━━━━━━━
⚠ Identifying Low-Quality Conditions — When Not to Trade
Stand aside when:
CHOP is orange on the dashboard — the hard chop gate is active. All signals are blocked. Pattern breakouts in extreme chop environments are dominated by noise — the range is too oscillatory for genuine structural breaks
CLASS shows PENDING for multiple consecutive bars with no resolution — when the system remains in PENDING state approaching the fakeWindow expiry without classifying as either TRUE BREAK or FAKEOUT, the break is ambiguous. The system will expire it silently. This ambiguity itself is a warning — directional commitment is absent
Pattern height is too small (sizeOk = false, quality score below 7) — the pattern exists but is too narrow to produce meaningful measured moves. Low-quality entries at micro-patterns carry reduced reward with the same stop risk
HTF Bias opposes the breakout direction — a bull breakout signal against a bearish HTF produces 0 HTF confluence points. The signal may still fire if other components score sufficiently, but counter-HTF breakouts resolve in the HTF direction far more often than not
FAKEOUT class appears but RSI is not approaching the midline — a fakeout has been detected but the RSI trigger for the reversal has not yet materialized. ARM SHORT / ARM LONG conditions are developing but no signal has fired. Do not anticipate the reversal signal without the RSI confirmation — the reversal could still fail
Multiple rapid PENDING → expiry cycles without TRUE BREAK or FAKEOUT — when the classifier repeatedly enters and exits PENDING state without resolving, the pattern boundary is being tested multiple times without follow-through. This is range-bound behavior masquerading as a breakout environment. Increase the break threshold or wait for a cleaner structural setup
The ideal BREAKRUNE setup:
Well-sized pattern (sizeOk true, pattern height 2× ATR or more)
Clean single raw break bar followed by TRUE BREAK classification within 2–3 bars
Fast RSI clearly above 55 (long) or below 45 (short) with positive/negative slopes on both RSI layers
HTF aligned with the breakout direction
Volume confirmed on the breakout bar
Chop Index well below threshold
Quality score at 8–10 (Grade A triangle, full brightness)
━━━━━━━━━━━━━━━━━━━━━━━━━━━━━━━━━━━━━━━━
⚡ Key Features
🔮 Three-phase breakout architecture — Pattern Recognition → Breakout Classification (PENDING → TRUE BREAK or FAKEOUT) → RSI Trigger Confirmation. No signal fires without all three phases completing sequentially
📐 Five-pattern detection engine — Range, Double Top/Bottom, Triangle, Rising/Falling Wedge, and Trend Channel identified from confirmed pivot structure with freshness and size filters
⚡ Real vs fake breakout classifier — candle body and wick geometry over a configurable decision window distinguishes genuine structural breaks from stop-hunt reversals before the signal fires
🔀 Fakeout reversal signal mode — when a break is classified as FAKEOUT, BREAKRUNE reverses bias and watches for an RSI midline crossover trap signal in the opposing direction, profiting from the crowd that got trapped
📊 Dual RSI trigger layer — Fast RSI (7) for timing precision and Core RSI (14) for momentum confirmation, with slope measurement on both. Required alignment conditions differ between true break and trap reversal entries
✕ Live fakeout markers — orange × marks above (failed long break) or below (failed short break) on bars where fakeout classification occurs, providing real-time awareness of failed breakouts independently of signal generation
🏅 10-point quality scoring — Pattern Size (2pts), RSI Alignment (2pts), Signal Type (1–2pts), Volume (1pt), Non-Chop (1pt), HTF Bias (2pts). Grade-coded triangle colors reflect score quality at a glance
🎨 Candle tinting — bars tinted yellow-green during bull pending/bias periods and red during bear periods, providing continuous directional context between signals
📊 10-row live dashboard — Pattern, Class, Bias, Levels, Quality, RSI F/C, HTF, Chop, and Volume updated in real time every bar
🔔 3 alert conditions — BREAKRUNE Long, BREAKRUNE Short, BREAKRUNE Fakeout (independent alert for fakeout detection regardless of reversal signal)
⚙ Fully configurable — pivot length, flat and trend tolerances, minimum pattern height, freshness window, break threshold, confirmation bars, fakeout decision window, wick rejection minimum, volume filter, dual RSI periods and trigger levels, RSI slope lookback, fakeout reversal enable, cooldown, quality minimum, HTF parameters, chop gate, SL/TP ATR multiples, guide extension, all visual toggles, and all colors are independently adjustable
━━━━━━━━━━━━━━━━━━━━━━━━━━━━━━━━━━━━━━━━
⚙ Settings Reference
Pattern Intelligence
Pivot Length — fractal sensitivity for pivot detection (default: 5). Lower = more frequent smaller patterns; higher = fewer, larger structural patterns
Flat Level Tol (xATR) — ATR tolerance for determining whether consecutive pivots are at the same level (default: 0.35). Controls Double Top/Bottom and Range classification sensitivity
Trend Shift Tol (xATR) — ATR tolerance for determining whether consecutive pivots show a directional shift (default: 0.20). Controls Triangle, Wedge, and Channel classification
Min Pattern Height (xATR) — minimum pattern height for the sizeOk condition and quality score (default: 1.1). Raise to filter micro-patterns
Pattern Freshness (bars) — maximum age of the oldest contributing pivot for pattern classification (default: 80). Older pivots are excluded
Breakout Classifier
Break Threshold (xATR) — minimum close extension beyond the pattern boundary to register a raw break (default: 0.12). Lower = more sensitive; higher = requires stronger breaks
True Break Confirmation Bars — consecutive candles that must all close beyond the level for TRUE BREAK classification (default: 2)
Fakeout Decision Window — maximum bars after the raw break within which FAKEOUT or TRUE BREAK must be classified (default: 5). After this window, the pending state expires
Fakeout Wick Rejection Min — minimum wick-to-body ratio required for FAKEOUT classification (default: 0.45). Higher = requires more obvious rejection wicks
Volume Confirm — require volume above average on the signal bar (default: on)
Volume Avg Length / Volume vs Avg — volume baseline parameters (defaults: 20 bars / 1.1×)
RSI Trigger Layer
RSI Fast — the timing RSI period (default: 7)
RSI Core — the confirmation RSI period (default: 14)
Long Trigger — minimum Fast RSI level for a true break long (default: 55). Above 50 is the baseline; raising this requires stronger bull momentum
Short Trigger — maximum Fast RSI level for a true break short (default: 45)
RSI Slope Bars — lookback period for RSI slope calculation (default: 3)
Enable Fakeout Reversal Signals — toggle the trap reversal signal mode (default: on)
Confluence Gate
Signal Cooldown (bars) — minimum bars between consecutive signals (default: 6)
Min Quality Score (of 10) — minimum score to fire a signal (default: 5)
HTF Bias Layer — when on, HTF alignment contributes up to 2 points to the quality score (default: on)
Hard HTF Alignment — when on, counter-HTF signals are fully blocked regardless of score (default: off)
HTF Timeframe / HTF Fast / Slow EMA — higher timeframe parameters (defaults: 60-minute / 21 / 55)
Block Extreme Chop / Choppiness Length / Chop Block Above — chop gate parameters (defaults: on / 14 / 62.0)
Entry / Exit Guides
Show SL + TP1 + TP2 — toggle guide line display (default: off)
ATR Length — ATR calculation lookback (default: 14)
SL (xATR) — stop loss distance in ATR multiples (default: 1.2)
TP1 (xATR) — first take profit distance (default: 1.8)
TP2 (xATR) — second take profit distance (default: 3.0)
Guide Extend (bars) — bars forward the guide lines project (default: 30)
Display
Show Pattern Boundary Lines — toggle the resistance and support boundary lines (default: on)
Show Signals — toggle signal triangle rendering (default: on)
Show Fakeout Marks — toggle the orange × fakeout markers (default: on)
Tint Candles by Active Bias — toggle directional candle tinting (default: on)
Show Dashboard — toggle the full dashboard (default: on)
Dashboard Position — Top Left / Top Right / Bottom Left / Bottom Right
Colors
Bull / Bull Bright — yellow-green family for bullish signals and tinting
Bear / Bear Bright — red family for bearish signals
Pattern Accent — purple for pattern labels, boundary lines, and structural elements
Pending / Fakeout — orange for fakeout marks, CHOP warnings, and VOL LIGHT indicators
Neutral — gray for IDLE class and neutral dashboard states
Stop / TP1 / TP2 — individual guide line colors
Dash BG / Dash Header / Dash Section / Dash Frame / Dash Text — full dashboard color control
━━━━━━━━━━━━━━━━━━━━━━━━━━━━━━━━━━━━━━━━
🔔 Alert Conditions (3 total)
BREAKRUNE Long — all three phases confirmed for a long entry: pattern identified, TRUE BREAK or FAKEOUT reversal classified, RSI trigger aligned, quality score met
BREAKRUNE Short — all conditions confirmed for a short entry
BREAKRUNE Fakeout — a fakeout has been classified on the current bar (fakeLongNow or fakeShortNow). This fires independently of whether a reversal signal follows — useful for awareness of failed breaks even when the reversal RSI conditions are not yet met
━━━━━━━━━━━━━━━━━━━━━━━━━━━━━━━━━━━━━━━━
🎯 Recommended Settings by Instrument & Timeframe
The default configuration is optimized for XAUUSD, major forex pairs, and crypto on M5–H1 :
Pivot Length at 5 — captures intraday structural swings without excessive micro-sensitivity
Fakeout Window at 5 — on M5 this is 25 minutes, sufficient to observe whether a break holds or fails without waiting too long. On M15, consider reducing to 3
Confirmation Bars at 2 — requires two consecutive closes beyond the level before TRUE BREAK classification. On M1, consider reducing to 1
RSI Long/Short Triggers at 55/45 — the asymmetric thresholds (not 60/40) accept momentum confirmation that is directional but not yet overbought/oversold
For other instruments or timeframes, adjust:
M1–M3 scalping — reduce Pivot Length to 3, reduce Fakeout Window to 3, reduce Confirmation Bars to 1, reduce Cooldown to 3, tighten Break Threshold to 0.08
H4–Daily swing trading — increase Pivot Length to 8–10, increase Pattern Freshness to 150, increase Fakeout Window to 8–10, increase Confirmation Bars to 3, increase TP2 to 5.0× ATR
Crypto (BTC, ETH) — increase Fakeout Wick Rejection to 0.50 for crypto's wider rejection wicks, increase Break Threshold to 0.18, increase Min Quality to 6 for tighter filtering on volatile instruments
Indices (NAS100, US30) — use Hard HTF Alignment (on), set RSI Long Trigger to 57, increase Confirmation Bars to 3 for cleaner index breakouts
Pure true-break mode — disable Enable Fakeout Reversal Signals, raise Min Quality to 6, raise RSI Long Trigger to 58 for higher-conviction momentum-only entries
Fakeout-specialist mode — enable Fakeout Reversal Signals, reduce Fakeout Wick Rejection to 0.38 for more sensitive fakeout detection, lower RSI Slope Bars to 2 for faster RSI crossover detection
━━━━━━━━━━━━━━━━━━━━━━━━━━━━━━━━━━━━━━━━
👥 Who This Is For
🔮 Breakout traders who are tired of being faked out — BREAKRUNE is built specifically around the fakeout problem. The three-phase architecture exists for one reason: to separate genuine structural breaks from the stop-hunt reversals that cost breakout traders money consistently
🔀 Traders who want to profit from both real breaks AND fakeouts — the fakeout reversal signal mode transforms the system's most common failure scenario into its own entry opportunity. The crowd that bought the false breakout becomes the fuel for the reversal trade
📊 Pattern-aware traders who want quantified structure — the five-pattern detection engine provides automatic structural context without manual drawing. Every signal tells you which pattern type it came from
📐 Momentum traders who need RSI precision — the dual RSI trigger layer (Fast 7 + Core 14) with slope measurement provides the most precise momentum timing gate in the AlphaX breakout signal suite
🧠 Systematic traders who want state transparency — the PENDING → TRUE BREAK / FAKEOUT classification state machine is fully visible on the dashboard in real time. You always know exactly what phase the system is in and why
🥇 Gold and forex intraday traders — breakout and fakeout patterns are particularly consistent on XAUUSD and major forex pairs during London and New York session transitions. Default settings are calibrated for these instruments
⚠ Traders who struggle with breakout timing — the RSI trigger layer forces every entry to have genuine momentum behind it at the moment of entry, eliminating the common experience of entering a breakout just as momentum exhausts
━━━━━━━━━━━━━━━━━━━━━━━━━━━━━━━━━━━━━━━━
📝 Notes
All signals are confirmed on bar close — the indicator is non-repainting by design. Pattern detection, breakout classification, and RSI conditions all finalize on confirmed bars
The pending state machine uses persistent variables (var) — the PENDING, TRUE BREAK, and FAKEOUT states persist across bars until resolved or expired. This is essential for multi-bar classification but means the state machine holds values from previous breakout events. A signal firing clears all pending state variables
Pattern detection is a best-fit classification — the system selects the most matching pattern from the available pivot structure on every bar. When the pivot structure changes (new pivots form), the pattern classification may update. This means the PATTERN row on the dashboard may change between signal events as new structure forms
The Pattern Freshness filter (default: 80 bars) ensures the oldest contributing pivot is recent. On slower timeframes with infrequent pivots, this may cause pattern detection to intermittently show — before new pivots form. Increase the freshness window on higher timeframes
Maximum 80 labels, 120 lines, and 600 bars back are configured. On very active low-timeframe charts, the oldest guide lines may be removed by TradingView's rendering limits
The fakeout mark (orange ×) fires independently of the reversal signal. A fakeout mark can appear without a subsequent reversal signal if the RSI trap conditions (midline cross with slope) are not met — the fakeout is real but the reversal momentum confirmation is absent
The indicator does not track open positions or P&L and does not connect to any broker or account
━━━━━━━━━━━━━━━━━━━━━━━━━━━━━━━━━━━━━━━━
⚠ Disclaimer
This indicator is a technical analysis and visualization tool intended for educational and informational purposes only. It does not constitute financial advice or a recommendation to buy or sell any financial instrument. All signals are generated from historical and real-time price data using mathematical calculations — their accuracy or profitability is not guaranteed. Past performance of any signal type does not guarantee future results. Always conduct your own analysis, use proper risk management, and consult a licensed financial advisor before making any trading decisions. The author accepts no responsibility for any losses incurred from the use of this indicator.
━━━━━━━━━━━━━━━━━━━━━━━━━━━━━━━━━━━━━━━━
Built for traders who understand that a breakout is not a signal — it is the beginning of an evaluation. The signal comes after the market proves whether the break was real. Indicatore
[ A L P H A X ] RELAY - Pattern Relay EngineAlphaX RELAY — Pattern Relay Engine: Formation → Armed → Fired Lifecycle System, Pre-Breakout Detection, Completion Scoring, Volume Coil Confirmation & Real-Time Phase Intelligence
AlphaX RELAY is a professional-grade chart pattern anticipation system built around a fundamentally different concept from every other pattern indicator — including its companion AlphaX FORGE. Where FORGE detects patterns after breakout confirmation and fires entry signals on completed formations, RELAY tracks patterns throughout their entire development lifecycle , scoring their completion percentage in real time and alerting you before the breakout occurs. The RELAY framework divides every pattern's life into three sequential phases — FORMING, ARMED, and FIRED — and updates the phase designation on every bar as price evolves within the formation. When a pattern enters the ARMED zone (price approaching the neckline or boundary within ATR tolerance), RELAY alerts you to prepare. When the breakout fires, the full entry framework activates with computed entry, stop, TP1, and TP2 levels alongside a JSON alert. The result is a system that gives you advance warning of high-probability breakouts rather than reactive confirmation — designed for traders who want to be positioned before the crowd, across crypto, forex, gold, and indices on any timeframe.
━━━━━━━━━━━━━━━━━━━━━━━━━━━━━━━━━━━━━━━━
🔄 The RELAY Philosophy — Anticipation Over Confirmation
Every significant chart pattern begins forming bars or hours before the breakout. A Double Top starts when the second peak forms near the first — at that moment, a skilled technical trader begins watching the neckline. A Head & Shoulders is identifiable from the moment the right shoulder begins forming — before price has reached the neckline. A Bull Flag is established from the moment the pole terminates and consolidation begins.
Most pattern indicators wait until the breakout is confirmed — at which point the pattern is already complete, the first wave of breakout traders has already entered, and the entry price is often significantly beyond the pattern boundary. RELAY inverts this model. By continuously scanning for pattern geometries as they form , scoring their completion, and communicating their phase state in real time, RELAY gives traders the ability to:
Identify patterns well before breakout — watching them develop in real time on the chart
Receive an ARMED alert when price approaches the trigger level — preparing limit orders or monitoring for the candle close
Enter on the FIRED event with a pre-planned trade, not a reactive chase
Track completion percentage continuously — knowing whether a formation is 65% complete or 95% complete changes the urgency of preparation
This anticipatory framework is the core intellectual contribution of RELAY to the AlphaX suite, and it is what distinguishes it from FORGE — two systems covering the same pattern types from opposite temporal perspectives.
━━━━━━━━━━━━━━━━━━━━━━━━━━━━━━━━━━━━━━━━
🔄 The Three-Phase Lifecycle — FORMING → ARMED → FIRED
Every pattern in RELAY exists in exactly one of three states at any moment. The phase is computed on every bar and displayed prominently on both the chart label and the dashboard.
━━━━━━━━━━━━━━━━━━━━━━━━━━━━━━━━━━━━━━━━
Phase 1 — FORMING (Purple)
The pattern geometry has been confirmed — the pivots are in the correct structural relationship and the formation is identifiable. However, price has not yet approached the neckline or boundary level closely enough to be considered imminently actionable.
What FORMING means: The pattern exists and is valid. Completion percentage is typically 60–80% in this phase. The formation box is drawn on the chart in purple. The neckline or boundary is plotted as a solid purple line. The dashboard shows the pattern name, FORMING phase, and the current completion percentage.
How to use FORMING: Plan your trade. Note the neckline level. Calculate where your entry, stop, and targets will be if the pattern fires. Set a price alert at the ARMED zone boundary so you are notified when price begins approaching the trigger level. Do not enter yet.
━━━━━━━━━━━━━━━━━━━━━━━━━━━━━━━━━━━━━━━━
Phase 2 — ARMED (Orange)
Price has approached the neckline or boundary to within the configurable ATR tolerance (default: 0.35× ATR). The pattern is in its final stage of formation before the breakout. The trigger is imminent.
What ARMED means: Price is close enough to the neckline that the next 1–5 bars will likely determine whether the pattern fires or fails. Completion percentage typically reaches 85–100% in this phase. The formation box and neckline shift to orange. The dashboard phase row turns orange. An ARMED alert fires.
How to use ARMED: This is your active preparation signal. If you are trading with limit orders, now is the time to place a limit order at the neckline level. If you prefer market orders on breakout, watch the chart closely for the closing candle confirmation. Review the confluence score — if it is at or above the minimum, the ARMED setup is worth your full attention.
ARMED alert: Separate alert conditions fire for ARMED Long and ARMED Short, allowing you to set up targeted notifications for the direction you want to trade. The ARMED alert is the pre-breakout awareness signal.
━━━━━━━━━━━━━━━━━━━━━━━━━━━━━━━━━━━━━━━━
Phase 3 — FIRED (Yellow-Green / Red)
Price has closed beyond the neckline or boundary by more than the configured break margin (default: 0.6× ATR). The pattern has completed and the entry framework activates. Completion is 100%.
What FIRED means: The breakout is confirmed by bar close. The formation box and neckline shift to the directional color — yellow-green for bull patterns, red for bear patterns. Entry, SL, TP1, and TP2 lines are drawn on the chart extending 40 bars forward. All four levels are labeled with exact prices. The TP2 label also shows the computed R:R. A FIRED alert fires with a full JSON payload.
How to use FIRED: Enter on the next bar's open at or near the entry level shown on the chart. Place the stop at the SL level. Scale out 50% (default) at TP1. Let the remainder run to TP2 or trail with a stop.
━━━━━━━━━━━━━━━━━━━━━━━━━━━━━━━━━━━━━━━━
📊 Formation Completion Scoring — The Pattern Health Metric
The completion percentage is a pattern-specific quantitative score that measures how far along the formation has progressed toward its breakout. Unlike a simple binary detection, the completion score gives you continuous awareness of pattern health.
How completion is computed:
Each pattern type starts with a base completion score that reflects the geometric confirmation of the core structure:
Double Top / Bottom base: 70% — the two-pivot structure is confirmed
Head & Shoulders / Inv H&S base: 65% — the three-pivot structure with neckline is confirmed
Triangles base: 60–75% — converging trendlines with sufficient base height
Flags / Pennants base: 62% — pole plus parallel or converging consolidation confirmed
Wedges base: 58–78% — converging wedge with correct slope relationship
Additional completion points are awarded for:
+15 points — price is on the correct side of the neckline (below the neckline for Double Tops, above for Double Bottoms)
+15–20 points — price is within the ARMED zone (within ATR tolerance of the neckline or boundary)
Maximum possible completion before breakout is 100%. FIRED state also shows 100% on the dashboard.
Minimum formation threshold: Patterns below the configured minimum completion percentage (default: 55%) are not displayed. This prevents very early, nascent patterns with insufficient structural confirmation from cluttering the chart. Raising this threshold (e.g., to 70%) shows only well-developed formations where the pattern geometry is fully confirmed and price is approaching the trigger.
━━━━━━━━━━━━━━━━━━━━━━━━━━━━━━━━━━━━━━━━
📐 Pattern Detection — Five Formation Types
RELAY continuously scans for five pattern families in real time, computing their phase and completion on every bar.
━━━━━━━━━━━━━━━━━━━━━━━━━━━━━━━━━━━━━━━━
Double Top / Double Bottom
Two pivot highs at approximately the same level separated by a pullback low (Double Top), or two pivot lows at approximately the same level separated by a recovery high (Double Bottom). The neckline is the intervening low (Double Top) or high (Double Bottom).
Phase transitions:
FORMING — geometry confirmed, price not yet near neckline
ARMED — price within 0.35× ATR of the neckline
FIRED — price closes below neckline by 0.6× ATR (Double Top) or above by 0.6× ATR (Double Bottom)
━━━━━━━━━━━━━━━━━━━━━━━━━━━━━━━━━━━━━━━━
Head & Shoulders / Inverted H&S
Three-peak structure with a dominant central peak (head) flanked by two lower peaks (shoulders) at approximately equal heights, connected by a potentially sloped neckline through the two intervening lows. The Inverted H&S is the mirror pattern with a dominant central trough.
The neckline for H&S patterns is computed as a projected line through the two neckline pivot points, evaluated at the current bar — producing a dynamically sloped neckline that accurately reflects the true pattern boundary at any point in time.
Phase transitions follow the same ATR-based FORMING → ARMED → FIRED logic, with the ARMED zone assessed against the sloped neckline projection.
━━━━━━━━━━━━━━━━━━━━━━━━━━━━━━━━━━━━━━━━
Triangles — Ascending, Descending, Symmetrical
Converging trendlines formed by a falling or flat upper trendline and a rising or flat lower trendline. The three variants are distinguished by slope:
Ascending Triangle — upper trendline near flat, lower trendline rising. Bull breakout expected
Descending Triangle — lower trendline near flat, upper trendline falling. Bear breakout expected
Symmetrical Triangle — both trendlines converging, neither flat. Can break either direction; RELAY tracks the direction of the actual breakout
The ARMED zone is computed relative to the projected upper (bull) or lower (bear) trendline at the current bar. Completion receives a bonus for larger triangle base heights (more than 2× ATR adds 15 points vs 5 points for smaller bases).
━━━━━━━━━━━━━━━━━━━━━━━━━━━━━━━━━━━━━━━━
Flags and Pennants
A sharp pole move followed by a consolidation with parallel downward-sloping trendlines (Bull Flag / Pennant) or parallel upward-sloping trendlines (Bear Flag / Pennant). The pole size must be at least 2.5× ATR to qualify as a genuine pole rather than normal price movement.
The upper trendline for Bull Flags and the lower trendline for Bear Flags are the breakout boundaries. The ARMED zone is assessed against the projected trendline level at the current bar. The target is the breakout level plus the full pole distance.
━━━━━━━━━━━━━━━━━━━━━━━━━━━━━━━━━━━━━━━━
Rising and Falling Wedges
Converging patterns where both trendlines slope in the same direction but the lower trendline has a more extreme slope than the upper (Rising Wedge — bearish) or the upper trendline has a more extreme slope than the lower (Falling Wedge — bullish). The slope relationship distinguishes wedges from flags (which are parallel) and triangles (where lines converge to a point rather than widening).
Completion bonus is proportional to the wedge width in ATR multiples — wider wedges with more price range between the trendlines score higher completion. The target is the high of the wedge origin (Falling Wedge) or the low (Rising Wedge) — the structural measurement move.
━━━━━━━━━━━━━━━━━━━━━━━━━━━━━━━━━━━━━━━━
🏅 The 10-Point Quality Scoring System
Every active pattern is scored through a 10-point confluence system. Only patterns meeting the minimum score threshold (default: 5) are displayed, and the quality-ranked selection algorithm picks the highest-scoring pattern when multiple formations are active simultaneously.
Score components:
Formation Completion (up to 2 points):
Completion at 85% or above scores 2 points. Completion above the configured minimum scores 1 point. This ensures well-developed patterns score higher than nascent formations.
HTF Bias Alignment (up to 2 points):
Bull pattern with bull HTF, or bear pattern with bear HTF, scores 2 points. When HTF is disabled, 1 neutral point is awarded. Counter-HTF patterns score 0. The HTF filter can be set as a hard block on FIRED patterns — preventing counter-HTF breakout alerts even if the pattern is technically valid.
Non-Chop Market (1 point):
Choppiness Index below the threshold. Also enforced as a hard gate — extreme chop blocks all patterns from displaying.
Pattern Phase (up to 2 points):
FIRED scores 2 points, ARMED scores 1 point, FORMING scores 0. This weighting ensures that more advanced phases naturally score higher in the quality ranking — a FIRED pattern will nearly always outscore a FORMING pattern in the selection algorithm.
Volume Coil Before Break (1 point):
Current volume is below the configured fraction of the volume moving average (default: 0.85×). A drying volume condition approaching the neckline is the classic pre-breakout behavior — the market is consolidating on declining interest before the explosive release. This layer rewards patterns where this institutional behavior is present.
R:R at Minimum (1 point):
The computed R:R between entry and TP2 meets or exceeds the minimum (default: 1.5). Ensures only patterns with adequate measured moves relative to their stop are displayed.
Pattern Size (1 point):
The pattern height or target distance meets or exceeds 1.5× ATR. Filters micro-patterns with trivial measured moves.
Selection algorithm:
When multiple patterns qualify simultaneously, RELAY uses a composite ranking that combines the confluence score, completion percentage (weighted at 0.05 per percent), and phase bonus (FIRED: +3, ARMED: +2, FORMING: +0). This ensures that a FIRED pattern with good confluence almost always outranks a FORMING pattern, while also rewarding high-completion ARMED patterns over low-completion FORMING patterns of equal confluence.
━━━━━━━━━━━━━━━━━━━━━━━━━━━━━━━━━━━━━━━━
📦 Formation Box and Neckline Visualization
Every active pattern is rendered with two core visual elements:
Formation Box:
A rectangle spanning the pattern's horizontal range (from the start bar to the current bar) and vertical range (from the neckline to the opposite extreme of the pattern — the tops for bear patterns, the bottoms for bull patterns). The box color reflects the current phase: purple for FORMING, orange for ARMED, yellow-green or red for FIRED. The fill opacity is moderate (88%) — present enough to identify the pattern zone without obscuring price action behind it.
Neckline / Boundary:
A solid line at the critical breakout level, extending 20 bars beyond the current bar. For patterns with flat necklines (Double Tops, Rectangles), this is a horizontal line. For Head & Shoulders with sloped necklines, the line reflects the slope. The neckline color matches the phase color — shifting through purple, orange, and the directional color as the phase advances.
Phase Label:
A label at the right edge of the formation showing the pattern name, current phase, and completion percentage. Positioned above price for bear patterns, below for bull patterns. The label color matches the phase.
━━━━━━━━━━━━━━━━━━━━━━━━━━━━━━━━━━━━━━━━
📊 Live Dashboard
The 13-row real-time dashboard displays the complete state of the current highest-scoring pattern.
RELAY STATE
Pattern — the name of the current pattern: Double Top, Head & Shoulders, Asc Triangle, Bull Flag, Falling Wedge, etc. Color-coded yellow-green for bull, red for bear
Phase — FORMING (purple), ARMED (orange), or FIRED (yellow-green/red). The most critical single row in the entire dashboard
Formation — the live completion percentage. Orange when below 80%, yellow-green when above 80%
Neckline — the exact price of the current neckline or boundary level in real time
LEVELS (FIRED)
Entry — the computed entry price (current bar's open at FIRED). Shows — when pattern is still FORMING or ARMED
TP1 / TP2 — both take-profit targets displayed as a price pair
Stop — the computed stop loss level
QUALITY
Confluence — the pattern's score out of 10. Yellow-green when at or above the minimum threshold
HTF · Chop — HTF bias (▲ BULL, ▼ BEAR, FLAT) and live Choppiness Index displayed on a single row. Orange CI indicates the chop gate is near or active
━━━━━━━━━━━━━━━━━━━━━━━━━━━━━━━━━━━━━━━━
📈 Chart Visual System
Formation Box (FORMING — purple) — the developing pattern's price range from start to current bar, purple-tinted
Formation Box (ARMED — orange) — box shifts to orange when price enters the ARMED zone. This color change on the chart is itself an alert
Formation Box (FIRED — yellow-green / red) — pattern complete, box color reflects direction
Neckline Line (solid, phase color) — the critical breakout level extending 20 bars forward
Phase Label — pattern name, phase text, and completion percentage. Positioned at the right edge of the formation
Entry Line (yellow-green dashed) — FIRED phase only, with "ENTRY x.xxxx" label
SL Line (red dashed) — FIRED phase only, with "SL x.xxxx" label
TP1 Line (lime dotted) — FIRED phase only, with "TP1 x.xxxx" label
TP2 Line (bright yellow-green dashed, width 2) — FIRED phase only, with "TP2 x.xxxx · R:R x.xx" label
━━━━━━━━━━━━━━━━━━━━━━━━━━━━━━━━━━━━━━━━
📡 JSON Alert System
RELAY fires a structured JSON alert on every FIRED event, delivering complete trade parameters to webhook receivers.
FIRED JSON structure: Indicatore

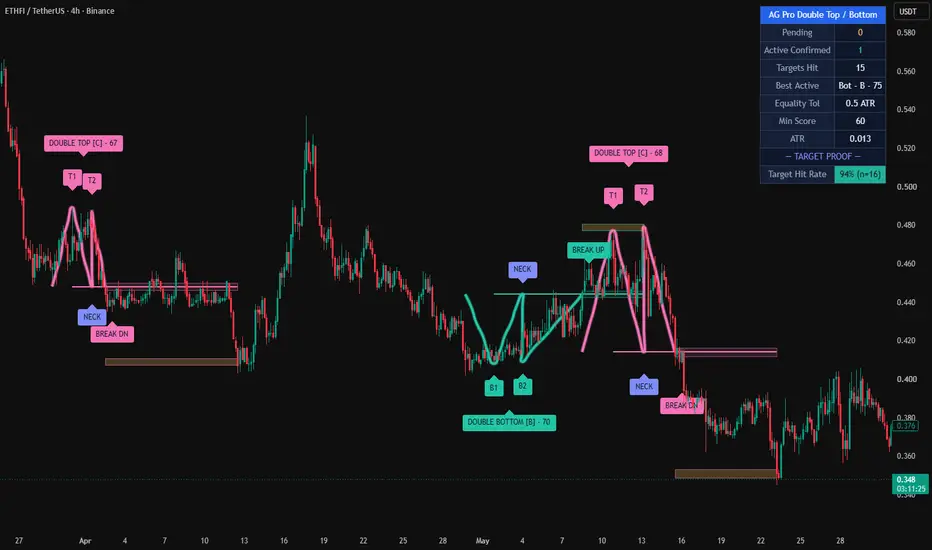
Double Top / Bottom Quality [AGPro Series]Double Top / Bottom Quality
Double Top / Bottom Quality is a disciplined, rules-based detector for the two most iconic reversal chart patterns: the Double Top (M-shape) and the Double Bottom (W-shape). Unlike basic pattern finders that fire on any two similar swings, this indicator scores every candidate pattern on a transparent 0–100 Quality Score across four independent factors — and only confirms patterns that pass a user-defined minimum. The result is a cleaner chart with fewer, higher-conviction setups.
Every confirmed pattern delivers a full trading lifecycle: a neckline flip S/R zone (resistance → support on a Double Bottom; support → resistance on a Double Top) and a measured-move target projection band. Pending, confirmed, target-hit and invalidated states are all tracked with disciplined cleanup, so the chart never becomes cluttered.
🔹 WHAT THE INDICATOR DOES
It detects classic Double Top and Double Bottom reversal structures using pivot-based swing analysis with ATR-normalised equality, depth and time-window filters. Each valid candidate is then scored on four independent quality factors. Only candidates that exceed the user-defined minimum score and break the neckline on close are confirmed. Once confirmed, the pattern draws its neckline flip zone and target projection band, labels the setup with its letter grade and score, and tracks the outcome until target hit or invalidation.
🔹 UNIQUE EDGE — WHY IT IS DIFFERENT
Most Double Top / Double Bottom scripts simply connect two similar swings and draw a line. This indicator adds a transparent 4-component Quality Score so every setup is rated before confirmation, not just flagged. Three factors that most scripts ignore are treated as first-class inputs here:
• Pattern Symmetry — the left leg and the right leg of the M / W must be comparable in time, or the pattern is penalised
• Break Volume Confirmation — the neckline break bar is compared to its rolling volume average, and thin breaks score lower
• Depth Quality — shallow, flat patterns are filtered out in favour of deep, decisive reversals
The full lifecycle visualisation (pending → confirmed → target hit) and same-region deduplication are also uncommon in this pattern category, and together they produce a chart that reads cleanly even on long history.
🔹 METHODOLOGY
• Pivot detection via ta.pivothigh / ta.pivotlow with user-configurable length
• Equality check: the two peaks (or troughs) must be within a configurable ATR tolerance
• Time-window filter: minimum and maximum bars allowed between the two pivots
• Depth filter: the vertical distance from peaks to neckline must exceed a minimum ATR threshold
• Neckline: lowest low between the two peaks for a Double Top, or highest high between the two troughs for a Double Bottom
• Confirmation trigger: daily close beyond the neckline
• Invalidation: price exceeds the pattern extreme before the neckline break
• Cooldown: after confirmation, new patterns in the same price region are suppressed for N bars to prevent clustering
🔹 QUALITY SCORE (0–100)
Each confirmed pattern receives a transparent score based on four equally-weighted factors (25 points each):
1. Peak / Trough Equality — how close the two extremes are to each other, measured in ATR units
2. Break Volume Confirmation — break-bar volume relative to the 20-bar average
3. Pattern Symmetry — ratio of the shorter leg to the longer leg (time-based)
4. Depth Quality — pattern height relative to ATR (deeper = higher score)
Score → Grade mapping:
• 85–100 = A
• 70–84 = B
• 55–69 = C
• <55 = D
🔹 SIGNALS, ZONES & ALERTS
Once a pattern confirms, the indicator renders:
• A solid neckline that extends to the right edge
• A neckline flip zone (rectangular S/R band at the neckline level)
• A target projection zone at the measured-move price (pattern height projected from neckline)
• A grade label (A / B / C) and numeric score on the pattern
Two alert types are available: "Confirmed Pattern" fires on confirmation, and "Target Hit" fires when the measured-move target is reached.
🔹 KEY INPUTS
• Pivot Length, ATR Length
• Peak / Trough Equality tolerance (ATR)
• Min / Max bars between peaks
• Minimum Pattern Depth (ATR)
• Break Volume Multiplier
• Cooldown bars
• Minimum Quality Score filter
• Show Pending Patterns toggle
• Show Neckline Flip Zone / Target Zone toggles
• Zone Width (ATR)
• Stale Cleanup Distance, Max Active Zones
• Label size, Panel position / theme / size
• Alert toggles
🔹 HOW TO USE
• Choose a liquid market and a timeframe that matches your trading style (4H and 1D are particularly well-suited to classic reversal patterns)
• Watch for Pending patterns (dashed lines) — these mark candidates awaiting a neckline break
• A Confirmed pattern with grade B or higher is the typical entry signal; aggressive traders may use C-grade while conservative traders may filter to A-grade only
• Use the neckline flip zone as a logical stop-loss reference (above it for Double Tops, below for Double Bottoms)
• Use the target projection zone as a take-profit reference based on the classical measured-move rule
• Combine with higher-timeframe trend, volume profile or an independent confluence tool for best results
🔹 LIMITATIONS & TRANSPARENCY
• Pivot-based detection means patterns confirm with a natural lag equal to the pivot length
• No strategy is 100% reliable — Quality Score filters improve average conviction but do not guarantee outcomes
• Very low-liquidity markets may produce unstable pivots; a longer pivot length helps
• Measured-move targets are a classical reference, not a prediction
• Historical statistics shown in the panel are pattern-completion counts on the loaded chart; they are not a guaranteed forward performance estimate
🔹 RISK DISCLOSURE
This script is provided for educational and analytical purposes only. It is not financial advice and does not constitute a recommendation to buy, sell or hold any asset. Trading involves substantial risk of loss; past pattern performance is not indicative of future results. Always perform your own research and use appropriate risk management.
Open-source under the Mozilla Public License 2.0 — contributions and feedback are welcome. Indicatore

AG Pro Reversal Pattern Quality Scanner [AGPro Series]AG Pro Reversal Pattern Quality Scanner
Overview / What it does
AG Pro Reversal Pattern Quality Scanner is an overlay tool designed to detect and visualize selected classical reversal structures directly on the chart while adding a structured quality layer to each valid setup. The script focuses on four widely recognized reversal formations: Double Top, Double Bottom, Head & Shoulders, and Inverse Head & Shoulders.
Instead of marking every possible structural resemblance, the script applies a filtered detection workflow based on pivot structure, pattern width, peak or trough equality, pullback depth, neckline logic, and an internal quality model. The goal is not simply to identify a shape, but to highlight formations that display more balanced structure and more usable context.
Each detected pattern can be displayed with a pattern box, a projected neckline, and a quality label that summarizes the pattern type, directional bias, quality score, and grade. This makes the script suitable for traders who want a structured visual map of potential reversal zones rather than a raw pattern-highlighting tool with no ranking logic.
The indicator is built for chart reading and workflow support. It does not attempt to forecast future price movement with certainty, and it should not be interpreted as a standalone trade system. Its role is to help users organize reversal structures, compare them visually, and focus on higher-quality formations when reviewing price action.
Unique Edge
The main distinction of this script is that it does not treat all reversal patterns as equivalent. A detected pattern is further evaluated through a composite quality framework that considers structural symmetry, pullback depth, and volume behavior during formation and break conditions.
For Double Top and Double Bottom structures, the script checks whether the two peaks or troughs remain sufficiently close to each other within a defined tolerance and whether the intermediate pullback is large enough to make the structure meaningful. For Head & Shoulders and Inverse Head & Shoulders structures, the script evaluates shoulder symmetry, time symmetry, and relative positioning of the head against the shoulders.
The volume component is not used as a promise of confirmation. It is used as an additional contextual factor inside the quality score. In general terms, contracting volume during formation and stronger participation during the break candidate can improve the overall score when those conditions are present.
Another important part of the design is visual prioritization. The script does not only draw the structure. It also attempts to keep the chart readable by organizing labels, neckline extensions, and pattern boxes in a way that preserves interpretation. The result is a cleaner reversal-pattern map that aims to be more practical than a simple shape detector.
Methodology
The script begins with swing pivot detection. These pivots act as the structural foundation for all pattern candidates. Once enough pivot highs and lows are available, the script evaluates whether recent pivot sequences fit the requirements of one of the supported reversal structures.
For Double Top detection, the script checks whether two recent highs are similar enough, whether the interim low forms a valid neckline reference, whether the pattern width stays within defined limits, and whether price has broken below the neckline. For Double Bottom detection, the logic is mirrored on the bullish side through two similar lows, an interim high as the neckline reference, and a bullish break condition above that neckline.
For Head & Shoulders detection, the script evaluates a sequence of three pivot highs where the middle high must exceed the two shoulders. It then estimates neckline structure from the lows between those highs and applies symmetry and pullback checks before accepting the setup. Inverse Head & Shoulders applies the same structural concept in reverse using pivot lows.
After a valid break condition is detected, the script calculates a composite quality score. This score is based on user-controlled weights for volume behavior, symmetry, and pullback depth. The final output is normalized into a 1 to 10 quality scale, then translated into a grade label for easier scanning.
Signals & Alerts
The script can generate pattern-based alert conditions for:
- Double Top
- Double Bottom
- Head & Shoulders
- Inverse Head & Shoulders
These alerts are tied to the script’s internal structural conditions and neckline break logic. As with any chart-based alert workflow, users should confirm that the selected settings match their market, timeframe, and execution style.
Visual output can include:
- Pattern boxes
- Neckline lines
- Neckline labels
- Pattern quality labels
- Break candle highlighting
- Information panel with detection statistics
The quality label is intended to summarize the detected structure, not to guarantee outcome quality. A higher score means the pattern aligned more closely with the script’s internal criteria. It does not mean the setup must succeed.
Key Inputs
The script includes adjustable inputs for both detection behavior and presentation. Key controls include:
- Swing Pivot Length
- Peak / Trough Equality tolerance
- Minimum Pullback Between Peaks or Troughs
- Minimum and Maximum Pattern Width
- Minimum Quality to Display
- Weighting of volume, symmetry, and pullback depth inside the quality score
- Box, neckline, and pattern-label visibility
- Global label size
- Panel font size
- Panel position
- Neckline extension length
- Pattern-specific alert toggles
These controls make it possible to adapt the scanner to different chart densities, volatility profiles, and personal visual preferences.
Limitations & Transparency
This indicator is a rule-based pattern scanner. It is not a predictive engine, and it does not claim that all detected formations will lead to continuation or reversal. Classical chart structures can fail, invalidate, or behave differently depending on volatility, trend strength, liquidity conditions, timeframe, and broader market context.
Pattern recognition on live charts is inherently sensitive to pivot settings and bar structure. Small changes in pivot length, equality tolerance, or minimum pullback can materially change how many formations appear. Because of that, users should treat the script as a configurable analytical framework rather than a universal template.
The quality score is an internal ranking model built from the script’s own criteria. It is meant to help compare setups inside the same framework. It should not be interpreted as an objective probability model, a performance promise, or a substitute for independent trade management.
Volume analysis also depends on the reliability and characteristics of the symbol’s reported data. On some instruments, volume may be less informative or behave differently than expected. Users should evaluate this in the context of their own market.
Risk Disclosure
This script is provided for chart analysis, workflow organization, and educational use. It does not provide financial advice, investment advice, or guaranteed trade signals. All trading and investment decisions remain the sole responsibility of the user.
Reversal patterns can fail even when they appear clean and well-structured. Breaks can reverse, neckline moves can trap participants, and high-scoring formations can still underperform. Risk management, confirmation process, position sizing, and overall strategy design remain essential.
Use this tool as a structured visual aid inside a broader decision-making process, not as a standalone reason to enter or exit a position. Indicatore

Pattern Recognition Signals | ProjectSyndicatePattern Recognition Signals automatically identifies and validates high-probability, non-repainting Double Top and Double Bottom patterns. It filters for structural quality, calculates adaptive take-profit and stop-loss zones based on Average Daily Range (ADR), and presents a complete statistical breakdown on a non-intrusive dashboard to provide a quantifiable edge.
🧠 NRP Multi-Wave Detection — identifies classic Double (W/M) and Triple (W/M) patterns using a non-repainting pivot engine, ensuring signals are confirmed and stable.
🎯 ADR-Adaptive TP/SL Zones — automatically calculates and plots TP1, TP2, and SL zones based on a percentage of the 10-day ADR, allowing the strategy to dynamically adapt to any asset's volatility.
🎨 Direction-Matched Colors — Bullish pattern labels are colored green to match the TP zones, and Bearish labels are colored red to match the SL zone, providing instant visual confirmation of trade direction.
📊 Full Performance Dashboard — provides a complete statistical overview, including the real-time ADR10 value, total signals, win rates for TP1/TP2, and a log of the last 10 trade outcomes.
✅ Advanced Quality Control Filters — user-configurable inputs for Max Pattern Bars, Max Pattern Height (% of ADR10), and Min Bars Between Signals eliminate low-quality or excessively large patterns and prevent over-signaling.
🔔 Comprehensive Alerts — get a single, detailed alert per signal—including the symbol, timeframe, entry price, SL, TP1, and TP2—formatted for easy integration with automated trading systems.
🔧 Fully Customizable — control everything from pivot lengths and pattern quality filters to the colors and extension of all zones, labels, and dashboard elements.
🎯 Why this algo is unique: Standard ZigZag and pattern indicators are notorious for repainting and providing subjective signals with no statistical backing. This algorithm provides an objective, fully-gated, non-repainting signal engine. It doesn’t just draw a pattern; it builds a complete, quantifiable trading framework around it with adaptive risk management (ADR-based zones) and a dashboard to prove its historical performance on the chart you are trading.
🚀 Apply to Gold (XAUUSD), Forex, Crypto, and Indices on any M5/M10/M15/M30/H1. The ADR-based system and extensive quality filters allow it to adapt to anything from M5 scalping to H4 swing trading.
🎯 How to use this? Use the dashboard to understand the strategy's recent performance on the current asset/timeframe. Adjust the TP/SL and pattern filter percentages to match your risk tolerance. Consider taking trades that align with the higher-timeframe trend for higher probability setups.
⚠️ IMPORTANT NOTICE: This indicator is designed to identify statistically-backed pattern signals. It should NOT be used as a standalone signal for entering trades. Always use it in conjunction with your own trading strategy, price action analysis, and other technical indicators to confirm trade setups and manage risk. Indicatore
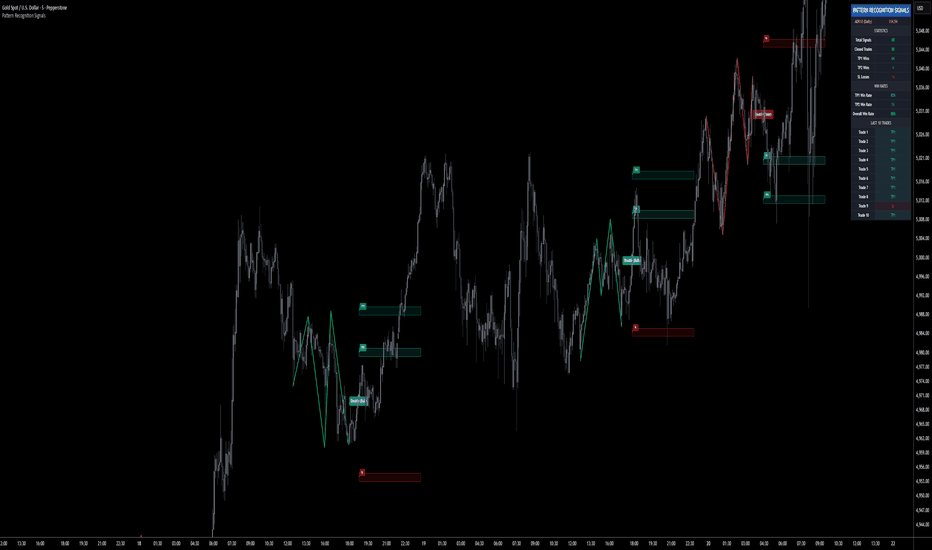
Indicatore

Jurik MA Trend Breakouts [BigBeluga]🔵 OVERVIEW
Jurik MA Trend Breakouts is a precision trend-breakout detector built on a custom Jurik-smoothed moving average.
It identifies trend direction with ultra-low lag and maps breakout levels using pivot-based swing highs/lows.
The indicator plots dynamic breakout lines and confirms trend continuation or reversal when price breaks them — providing clean, minimalistic yet extremely accurate trend signals.
🔵 CONCEPTS
Jurik Moving Average (JMA) — A highly smooth and low-lag moving average that reacts quickly to trend shifts without noise. This becomes the core trend baseline.
Trend Bias —
• JMA rising → bullish trend
• JMA falling → bearish trend
The JMA color updates instantly based on slope.
Swing Pivots — Recent pivot highs/lows are detected to define structural break levels while filtering out weak noise.
Trend Breakout Levels —
The indicator draws horizontal levels at the last valid pivot in the direction of the trend.
These levels act as “confirmation gates” for breakout entries.
ATR Validity Filter — Ensures only meaningful pivots within a threshold are used to prevent fake breakouts.
🔵 FEATURES
Ultra-Smooth Jurik Trend Line — A visually clean trend baseline changing color based on direction.
Automatic Swing High Breakout Setup (Bullish) —
• During an uptrend, the indicator tracks the most recent pivot high.
• A horizontal breakout line is extended across the chart.
• A ✔ marker appears at both pivot points when the breakout structure becomes valid.
Automatic Swing Low Breakout Setup (Bearish) —
• During a downtrend, pivot lows are tracked.
• A horizontal breakout line marks the breakdown level.
• ✔ markers confirm valid structure before the breakout triggers.
Breakout Detection —
• Price closing above the bullish breakout line → “↑” signal printed on the chart.
• Price closing below the bearish breakout line → “↓” signal printed on the chart.
Automatic Reset on Trend Change —
When the JMA trend flips, all breakout structures are cleared and the model starts tracking new pivot levels.
Trend-Colored Visualization —
Glow + main JMA line give instant clarity of market direction.
🔵 HOW IT WORKS
1. JurikMA defines the main trend — Slope determines bullish or bearish state.
2. The indicator continuously searches for pivots in the direction of the trend.
3. When a valid pivot forms and passes ATR proximity filter, a structural breakout level is drawn.
4. As long as price stays below that level (bullish case), the trend setup remains active.
5. When price finally breaks the level , the indicator prints a directional arrow (↑ or ↓).
6. Trend flip instantly resets all levels and begins tracking pivots on the opposite side.
🔵 HOW TO USE
Breakout Trading — Enter long on “↑” and short on “↓” signals when price breaks key pivot structure.
Trend Confirmation — Use the JurikMA color to stay aligned with the main trend direction.
Reversals — Trend flips often mark major turning points.
Structure Mapping — Use the horizontal breakout lines to understand how close price is to confirming a new trend leg.
🔵 CONCLUSION
Jurik MA Trend Breakouts combines the speed of a Jurik MA with structural breakout logic to deliver clean, reliable entry signals.
Its minimal design, pivot-based confirmation, and trend-aligned logic make it suitable for scalping, swing trading, and intraday trend continuation setups.
If you want fast yet filtered breakout recognition with almost zero noise, this tool gives you everything you need. Indicatore

Indicatore

Double&Triple Pattern[TS_Indie]📌 Description – Double & Triple Pattern Indicator
The Double & Triple Pattern Indicator is developed to help traders systematically and clearly identify Double Top, Double Bottom, Triple Top, and Triple Bottom chart patterns.
⚙️ Core Logic & Working Mechanism
The Double & Triple Pattern Indicator is built on the concept of price swing formation, based on the logic of Trend Entry_0 , which focuses on structured market analysis and price action behavior.
The indicator detects three main swing points (Swing 1, Swing 2, and Swing 3). A Fibonacci Box is then created using Swing A and Swing B as reference points to define the swing detection zone.
When all three swings remain inside the defined Fibonacci Box, the structure is considered a valid Price Action setup.
The indicator then plots key lines on the chart:
➩ Break Line – used to confirm the signal (confirmation)
➩ Cancel Line – used to invalidate the price action if price moves against the conditions
➛ When price breaks the Break Line , the structure is confirmed and a Pending Order is placed at Swing B , with the Stop Loss set at Swing 1.
➛ If price breaks the Cancel Line first, the price action structure is immediately invalidated.
⚙️ Fibonacci Entry Zone & Change SL Settings
➩ When Fibo Entry Zone is set to 0, the Pending Order is placed directly at Swing B.
➩ When the value is greater than 0, the Pending Order is calculated using Fibonacci levels drawn from Swing B to the Stop Loss level.
➩ Change SL allows switching the Stop Loss reference between Swing 1 and Swing A.
⚙️ Min & Max Control for Swing Size : xATR
When enabling Control Size Swing : xATR , the indicator filters Swing B based on the defined Min and Max range.
This allows traders to selectively test larger or smaller swing-based price actions , depending on their trading strategy.
⭐ Pending Order Cancellation Conditions
A Pending Order will be canceled under the following conditions:
1.A new Price Action signal appears on either the Buy or Sell side.
2.When Time Session is enabled, the Pending Order is canceled once price exits the selected session.
🕹 Order Management Rule
When there is an active open position, the indicator restricts the creation of new Pending Orders to prevent overlapping positions.
💡 Double Pattern Example
💡 Triple Pattern Example
⚠️ Disclaimer
This indicator is designed for technical analysis purposes only and does not constitute investment advice.
Users should apply proper risk management and make decisions at their own discretion.
🥂 Community Sharing
If you find parameter settings that work well or produce strong statistical results, feel free to share them with the community so we can improve and develop this indicator together.
Strategia

Chart Patterns [ActiveQuants]The Chart Patterns indicator is a comprehensive tool designed to automatically identify a variety of common chart patterns directly on your price chart. By detecting sequences of pivot highs and lows , this indicator helps traders spot potential trend continuations , reversals , and key market structures such as Double Tops and Double Bottoms . Enhance your technical analysis by quickly recognizing these formations as they emerge.
How It Works
The indicator operates in a two-stage process:
Pivot Point Detection: It first identifies significant swing highs and swing lows (pivot points) based on a user-defined Period . These pivots form the fundamental building blocks for pattern recognition.
Pattern Recognition: Using the sequence of these detected pivot points, the script then applies logical rules to identify the following patterns:
Lower Low (LL)
Lower Low & Lower High (LL & LH)
Higher High (HH)
Higher High & Higher Low (HH & HL)
Double Tops
Double Bottoms
Patterns are drawn on the chart with connecting lines and labeled for easy identification. Double Tops and Double Bottoms also feature a status system: " Active " while forming, " Confirmed " upon neckline breakout, or " Invalid " if specific conditions negate the pattern before confirmation.
█ KEY FEATURES
Comprehensive Pattern Detection: Identifies six distinct types of chart patterns, offering insights into both trend continuation and potential reversals.
Pivot-Based Analysis: Uses a robust method of identifying pivot highs and lows as the foundation for pattern formation.
Pattern Status for Double Tops/Bottoms:
- Active: A Double Top or Double Bottom pattern has formed its two peaks/troughs and the intervening neckline point, but the price has not yet broken beyond the neckline. The pattern is developing .
- Confirmed: The price has decisively closed beyond the neckline (below for Double Top, above for Double Bottom), signaling a potential entry or validation of the pattern.
- Invalid: An " Active " Double Top or Double Bottom pattern can be invalidated if, before a neckline breakout occurs, a new pivot point forms that negates the pattern’s structural integrity. For example, if a new pivot low forms above or at the neckline of an Active Double Top, the pattern is considered invalid because the market failed to break down and instead showed relative strength.
Customizable Visuals: Allows users to define colors for bullish and bearish patterns, line widths, and the visibility of pivot points.
Selective Pattern Display: Users can choose to display all patterns or filter by status (Active, Confirmed, Invalid) for Double Tops/Bottoms. Individual pattern types can also be toggled on or off.
Historical Analysis Control: The Show Last History (Bars) input allows users to specify how far back the indicator should plot patterns, optimizing performance and chart readability.
Clear Labeling: Patterns are clearly labeled on the chart, with Double Tops/Bottoms also showing " Top 1 ," " Top 2 ," or " Bottom 1 ," " Bottom 2 " labels.
█ PATTERNS DETECTED
Lower Low (LL): Indicates a potential bearish continuation or the start of a downtrend. Forms when price makes a lower low during an uptrend.
Lower Low & Lower High (LL & LH): A stronger confirmation of a bearish trend, where the market forms a lower low followed by a lower high .
Higher High (HH): Signals a potential bullish continuation or the start of an uptrend. Forms when price makes a higher high during a downtrend.
Higher High & Higher Low (HH & HL): A stronger confirmation of a bullish trend, where the market forms a higher high followed by a higher low .
Double Top: A bearish reversal pattern characterized by two distinct peaks at roughly the same price level, separated by a trough (neckline). Confirmation occurs when price breaks below the neckline.
Double Bottom: A bullish reversal pattern featuring two distinct troughs at roughly the same price level, separated by a peak (neckline). Confirmation occurs when price breaks above the neckline.
█ EXAMPLE: DOUBLE TOP INVALIDATION
Understanding how a Double Top or Double Bottom can be invalidated is crucial. Here's an example for a Double Top:
Formation: The indicator identifies two peaks (Top 1, Top 2) at a similar price level, with a corrective trough (Neckline Pivot P5) in between. The pattern is labeled " Double Top " and is in an " Active " state. ( Imagine points P4 and P6 are the two tops, and P5 is the low point of the neckline between them ).
Pre-Breakout Condition: The price action continues, but before it breaks decisively below the P5 neckline level, a new significant swing low (a new pivot low) forms.
Invalidation Check: The indicator checks the price level of this new pivot low. If this new pivot low occurs at a price equal to or higher than the P5 neckline level, the " Active " Double Top pattern is re-labeled as " Invalid Double Top ". ( See image below for a visual representation of this scenario )
In this example, the Double Top formed with Top 1 (P4) and Top 2 (P6). The neckline is at P5. Before price broke below P5, a new pivot low formed at the red circle. Since this new pivot low is above the P5 neckline, the Double Top is marked " Invalid ".
The logic is that the market failed to break the neckline support and instead established a higher low (or a low at the support level), suggesting that the immediate bearish pressure has waned, thus invalidating the bearish reversal implication of the Double Top before it could confirm. A similar logic applies to Double Bottoms (a new pivot high forming below or at the neckline before an upside breakout).
█ USER INPUTS
Visibility and Common Styling
- Show Last History (Bars):
Specifies the number of recent bars the indicator will analyze and plot patterns on.
Default: 3000 bars. Min: 10.
- Patterns:
Filters which patterns are displayed based on their status.
Options: All, Active, Confirmed, Invalid.
Default: All.
- Pattern Line Width:
Sets the thickness of the lines used to draw the patterns.
Default: 1. Min: 1, Max: 10.
- Bearish Color:
Color for bearish patterns (LL, LL & LH, Double Tops).
Default: Red.
- Bullish Color:
Color for bullish patterns (HH, HH & HL, Double Bottoms).
Default: Green.
Pivot Points
- Period:
The lookback period on either side of a bar to qualify it as a pivot high or low. Higher values detect more significant pivots.
Default: 10 bars. Min: 2.
- Show Pivot Highs:
Toggles the visibility of detected pivot high markers.
Default: Enabled.
- Show Pivot Lows:
Toggles the visibility of detected pivot low markers.
Default: Enabled.
- Pivot Highs Color:
Color for the pivot high markers.
Default: #ff5252 (Reddish).
- Pivot Lows Color:
Color for the pivot low markers.
Default: #089981 (Greenish).
Patterns (Toggles)
- Lower Low:
Enable/disable detection and display of Lower Low patterns.
Default: Enabled.
- Lower Low & Lower High:
Enable/disable detection and display of Lower Low & Lower High patterns.
Default: Enabled.
- Higher High:
Enable/disable detection and display of Higher High patterns.
Default: Enabled.
- Higher High & Higher Low:
Enable/disable detection and display of Higher High & Higher Low patterns.
Default: Enabled.
- Double Tops:
Enable/disable detection and display of Double Top patterns.
Default: Enabled.
- Double Bottoms:
Enable/disable detection and display of Double Bottom patterns.
Default: Enabled.
█ CONCLUSION
The Chart Patterns indicator is a versatile and powerful assistant for traders who utilize classical chart pattern analysis. By automating the detection of key formations and providing clear visual cues along with status updates for patterns like Double Tops and Bottoms, it allows traders to focus on strategy development and execution. With its customizable settings, it can be adapted to various instruments and timeframes, making it a valuable addition to any technical trader's toolkit.
█ IMPORTANT NOTES
⚠ Pivot Period Sensitivity: The Period setting for pivot detection is crucial. A shorter period will identify more frequent, smaller swings, while a longer period will focus on more significant turning points. Adjust this setting based on the asset's volatility, the timeframe you are trading and your trading style.
⚠ Confirmation is Key: While the indicator identifies patterns, always wait for pattern confirmation (e.g., neckline breaks for Double Tops/Bottoms) and consider other factors like volume and market context before making trading decisions.
⚠ Confirmed Bars for Detection: Patterns are identified based on confirmed pivot points, which means a pivot is recognized period bars after it has formed. Status updates for Double Tops/Bottoms (Active, Confirmed, Invalid) also occur on confirmed bars. This approach enhances reliability and reduces the likelihood of repainting based on intra-bar price fluctuations.
⚠ Not a Standalone System: Chart patterns provide valuable insights, but they should be used in conjunction with other technical analysis tools (e.g., trendlines, moving averages, oscillators) and a sound risk management plan.
⚠ Lagging Nature: By their very definition, chart patterns are lagging indicators as they require a sequence of price action and several pivot points to complete their formation.
█ RISK DISCLAIMER
Trading involves a substantial risk of loss and is not suitable for every investor. The information provided by the Chart Patterns indicator is for educational and informational purposes only. It should not be considered as financial advice or a recommendation to buy or sell any security. Chart patterns indicate potential price movements but do not guarantee future results. Always perform your own due diligence and consult with a qualified financial advisor before making any investment decisions. Past performance is not indicative of future results.
📈 Happy trading! 🚀 Indicatore
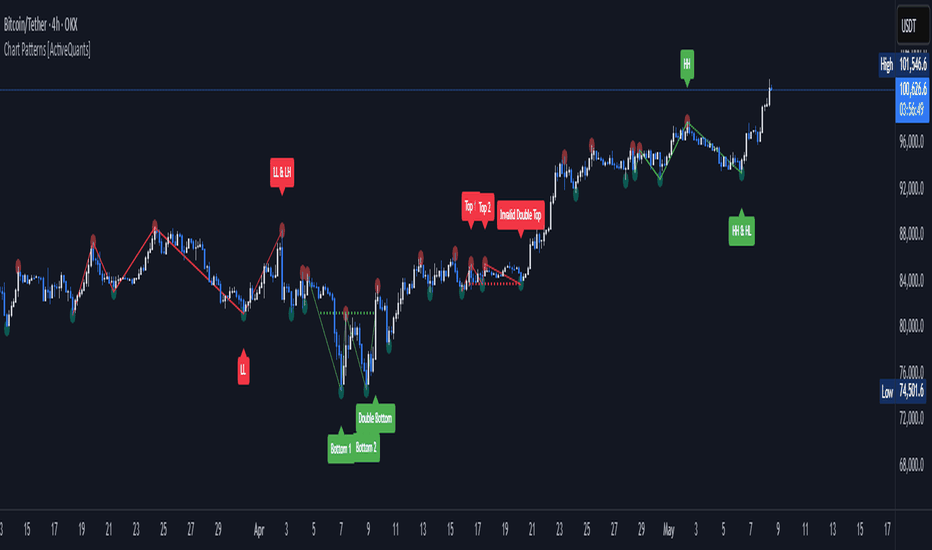
Indicatore

Indicatore

Double Tops & Bottoms [QuantVue]This indicator is designed to detect and plot Double Tops and Double Bottoms, by setting the initial high or low using standard pivot points.
Double Tops
A Double Top is a bearish reversal pattern, typically found when an uptrend returns back to a prior peak. It signifies a potential turning point or resistance level and could potentially reverse in direction.
The pattern is confirmed as a Double Top when the price breaks above the resistance level, but closes below it. A decisive close below this level is seen as a confirmation of the bearish trend.
Double Bottoms
A Double Bottom, on the other hand, is a bullish reversal pattern typically found after a downtrend. It signals a potential turning point or support level where the price has bottomed and could potentially reverse upwards.
The pattern is confirmed as a Double Bottom when the price breaks below the support level, but closes above it. A decisive close above this level is viewed as a confirmation of the bullish trend.
Indicator Features
🔹Double Top Detection: When a double top is identified, a downward-pointing triangle will be plotted above the bar, and if the alerts are enabled, a notification will be triggered.
🔹Double Bottom Detection: When a double bottom is identified, an upward-pointing triangle will be plotted below the bar, and if the alerts are enabled, a notification will be triggered.
🔹Pivot Lookback: Defines the number of bars to the left and right of the pivot that must be lower/higher to qualify as a pivot.
🔹Maximum Length Between Tops/Bottoms: Maximum number of bars between two tops/bottoms to be considered a double top or bottom.
🔹Style Settings: Allows the user to customize the appearance of the lines indicating the tops/bottoms. Options include color selection, line style (dotted, dashed, or solid), and line thickness.
🔹Alerts: The user can enable or disable alerts for Double Top and Double Bottom.
Give this indicator a BOOST and COMMENT your thoughts!
We hope you enjoy.
Cheers! Indicatore
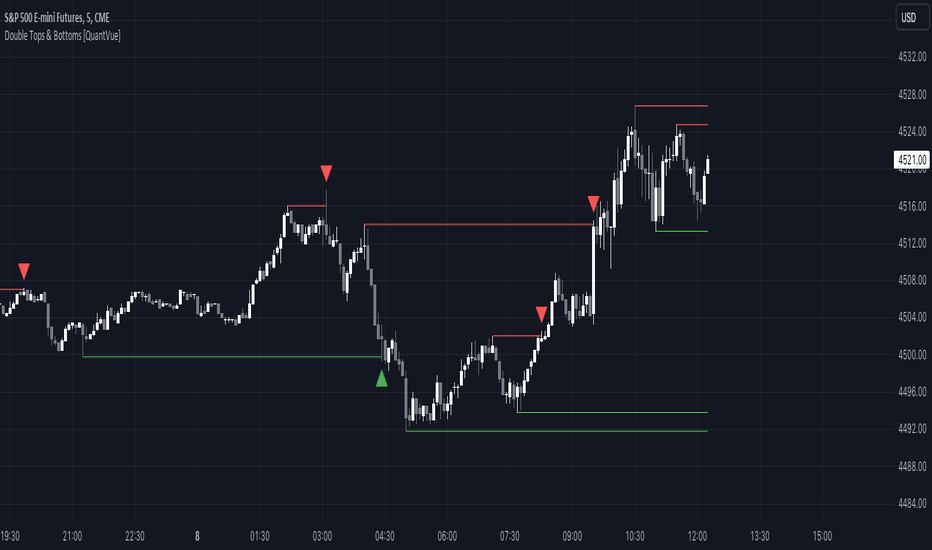
Indicatore

Indicatore
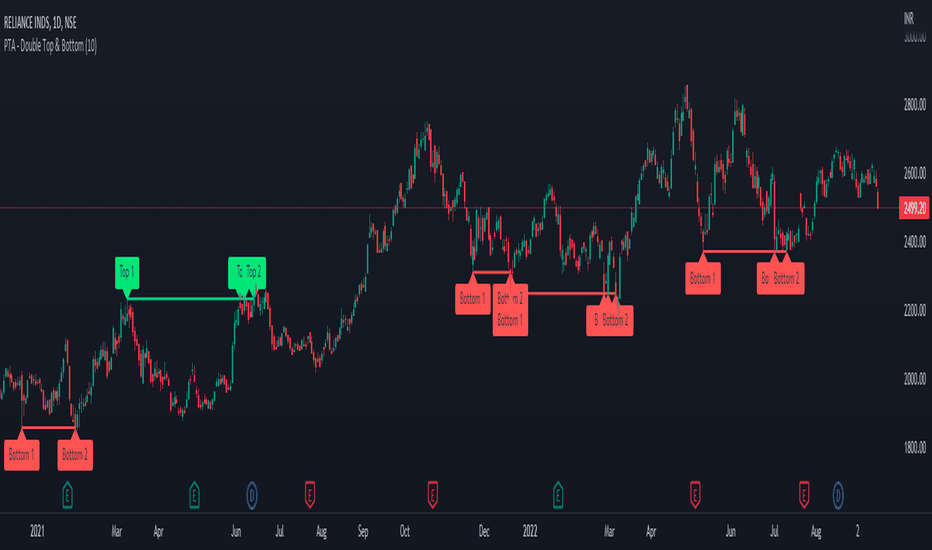
Strategia

Indicatore

Indicatore
Indicatore
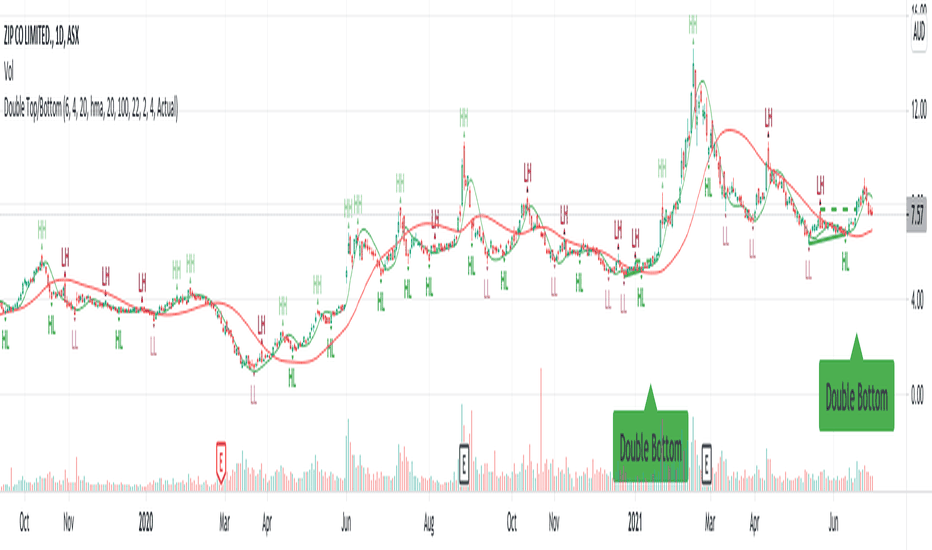
Indicatore